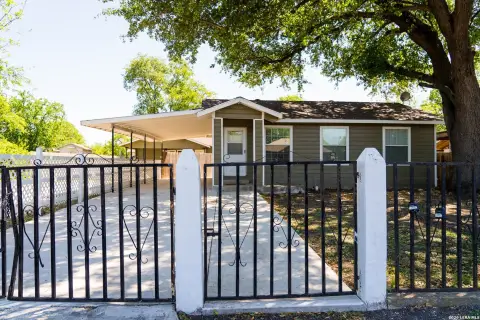
Updated Duplex with
For Sale
$224,950
1222 Gardina, San Antonio, TX 78201
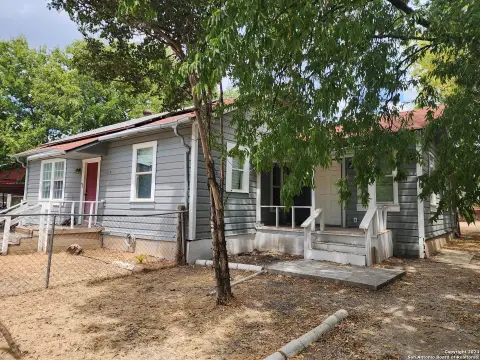
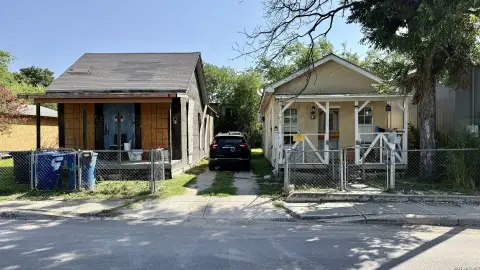
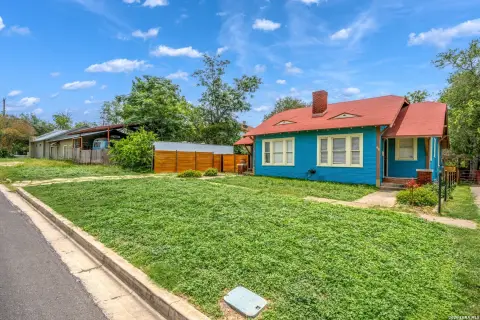
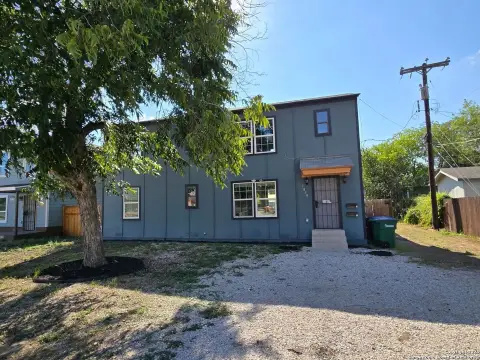
Two residential units offer refreshed finishes, electrical improvements, and included kitchen appliances.
Property Size1,296 SF
Price / SF$173.57
Days on Market60
Property Features for 1222 Gardina
General Information
Standard status
Active
Size
1,296 SF
Property subtype
Multi-Family
Additional Details
Public Transit
Yes
Multifamily Units
2
Building Details
Year Built
1966
Listing Agency:
Alamo Real Estate Brokers
Listed By:
Michael Guerrero
(210) 415-3010
Source:
Theswinneygroup
Added: Aug 20
Changed: Oct 7
Last Checked: Oct 7 at 3:10PM
Displayed information is deemed reliable but is not guaranteed and should be independently verified. All listing content including descriptions, pricing, images are the copyrighted material of Alamo Real Estate Brokers

Ask AI about this property
Review the available facts, identify missing information and prepare questions for the agent.
Investment Insights
Based on property information with market context.
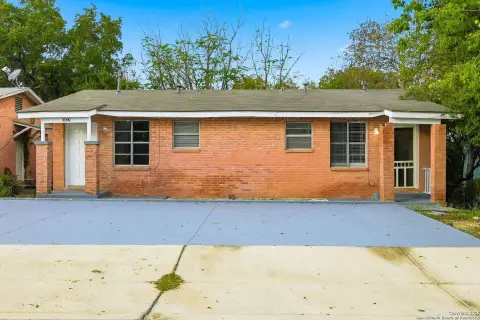
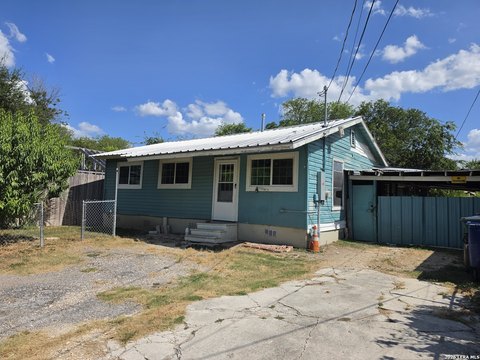
This 1,296-square-foot duplex, built in 1966, includes two residential units with recent interior updates. Improvements include new flooring and carpet, refinished wood floors, refreshed bathroom fixtures, and updated electrical sub-panels with new switches, outlets, and fixtures. Each unit is equipped with a refrigerator and gas stove.
The property is located at 1222 Gardina in San Antonio, Texas, and sits along a major bus line. The lot is described as large enough to accommodate a second structure, offering additional configuration potential. Both units have received soft remodel updates while retaining refinished wood flooring in portions of the interiors.
The property is located at 1222 Gardina in San Antonio, Texas, and sits along a major bus line. The lot is described as large enough to accommodate a second structure, offering additional configuration potential. Both units have received soft remodel updates while retaining refinished wood flooring in portions of the interiors.
Key Highlights
- 1,296‑square‑foot duplex with two residential units
- Built in 1966
- New flooring and carpet, plus refinished wood floors
Financial Insights
Estimated NOI and Cap Rate
NOI / Yr
$14,917
Cap Rate
6.63%
Suggested Prices Based on Cap Rates
Cap Rate 5%
$298,340
$298.3K
Cap Rate 7%
$213,100
$213.1K
Cap Rate 9%
$165,744
$165.7K
Market Conditions
NOI Build-Up for 1,296 SF
Gross rent
$22.6K $17.40/SF
− Vacancy
−$1.2K −$0.96/SF
EGI
$21.3K $16.44/SF
− OpEx
−$6.4K −$4.93/SF
NOI
$14.9K $11.51/SF
Area
San Antonio, TX
Vacancy
5.50%
Lease Rate
$17.40 /SF/Yr
Expense Ratio
30.00%
Simulate Cap Rate and NOI
Suggested Prices Based on Cap Rates
Cap Rate 5%
$298,340
Cap Rate 7%
$213,100
Cap Rate 9%
$165,744
Alternative Uses
Best Use
Multifamily LT 5
$213.1K
$186.5K – $248.6K
NOI $14,917 @ 7.0% cap · market cap 6.63%
Second Best
Apartment 5plus
$189.1K
$165.5K – $220.6K
NOI $13,238 @ 7.0% cap · market cap 5.88%
Theoretical Best
Office A
$330.6K
$289.3K – $385.7K
NOI $23,141 @ 7.0% cap · market cap 10.29%
Zoning and permitted uses should be independently verified with authorities.
How Realmo checks its estimates
Property Analytics
Current Use
Lease Details
2
Residential units
Location Intelligence
Trade Area within ½ mile
1,135
Businesses Nearby
Explore this area
Business Placement
Demographics for 78201, TX
42,005
Population
18,661
Households
2.3
Avg Household Size
39
Median Age
17%
College-Educated
73%
High-School Grad
7.1 sq mi
ZIP Area
5,916
Density / Sq Mi
$46,129
Median Household Income
$30,517
Median Earnings
$1,033
Median Rent
$187,400
Median Home Value
Market
Vacancy Rate% for Multifamily in South region



Frequently Asked Questions
What type of property is this?
Duplex - Two residential units offer refreshed finishes, electrical improvements, and included kitchen appliances.
Where is this duplex located?
The property is located at 1222 Gardina San Antonio, TX.
What is the asking price?
The asking price for this property is $224,950.
What are key features of this property?
This property features: 1,296‑square‑foot duplex with two residential units; Built in 1966; New flooring and carpet, plus refinished wood floors