Two-Story Live-Work
For Sale
$725,000
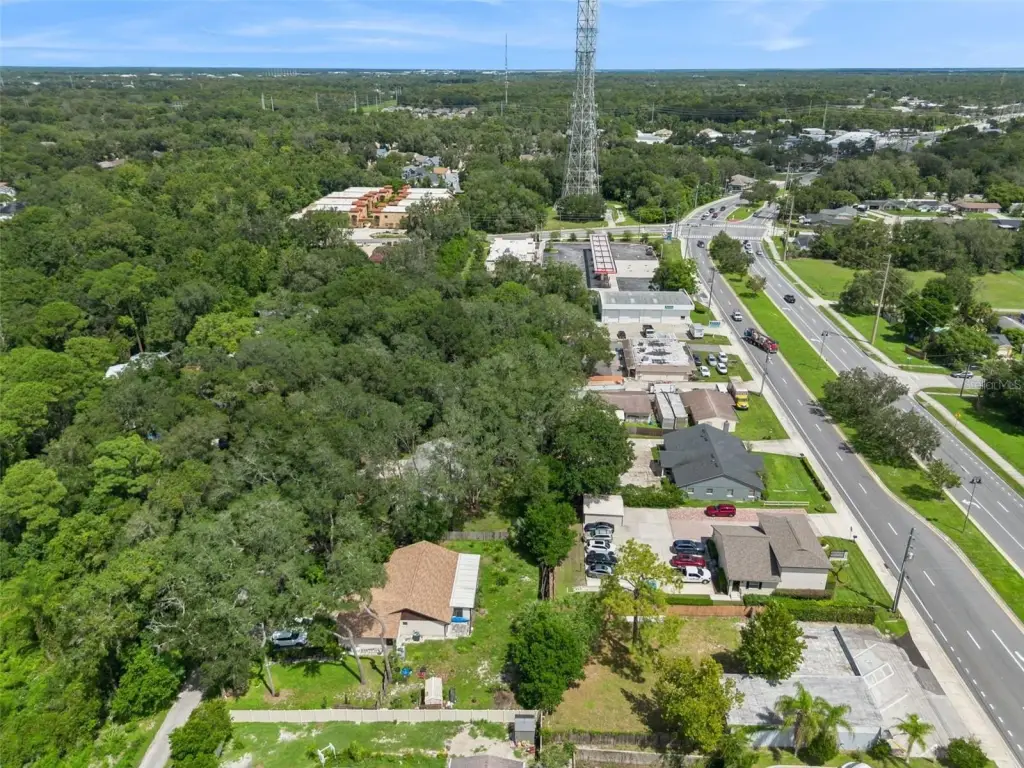
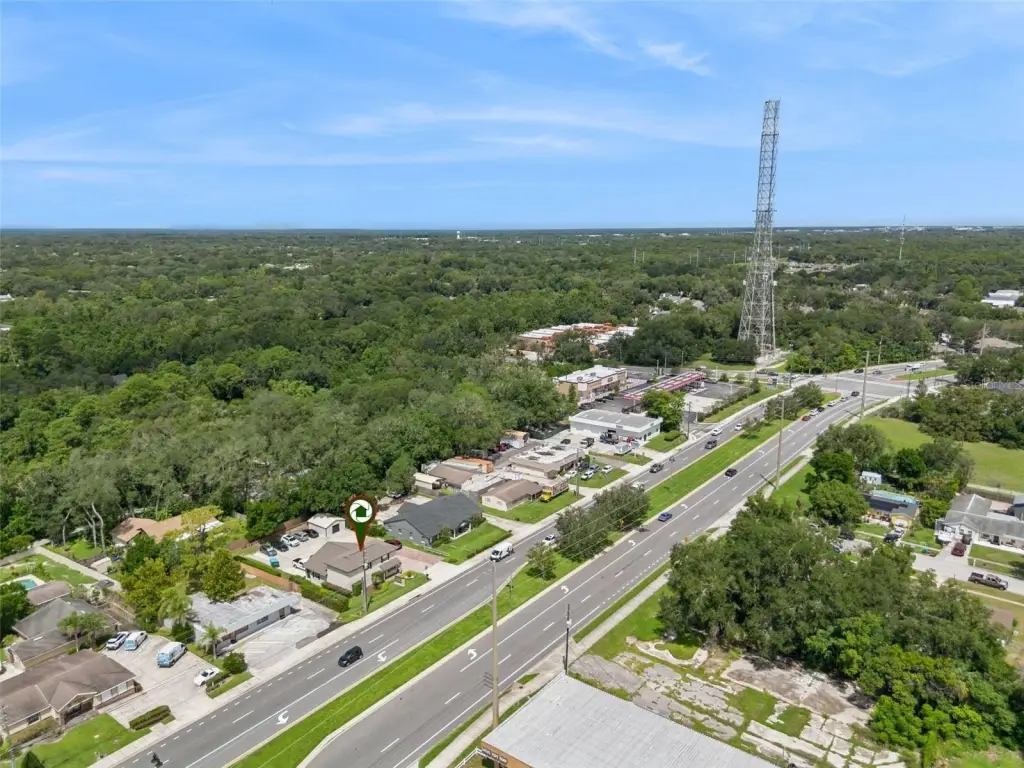
1150 N RONALD REAGAN Boulevard, Longwood, FL 32750
Commercial Sale, LONGWOOD, FL
Property Size2,480 SF
Lot Size0.31 Acres
Price / SF$292.34
Days on Market47
Property Features for 1150 N RONALD REAGAN Boulevard
General Information
Property type
Commercial Sale
Property subtype
Other
Zoning
GC
Window features
Double Pane Windows, Insulated Windows
Appliances
Microwave, Refrigerator
Subdivision
BRADLEYS ADD
Directions
From Longwood Hills Road Turn Right on Ronald Reagan and Property will be on your Right
Standard status
Active
APN
32-20-30-505-0000-007F
Size
2,480 SF
Lot size
0.31 Acres
Taxes and HOA fees
Tax Year
2025
Tax Description
N 90 FT OF S 260 FT OF E 150 FT OF LOT 7 BRADLEYS ADD PB 1 PG 17
Tax Annual Amount
6831
Legal Description
N 90 FT OF S 260 FT OF E 150 FT OF LOT 7 BRADLEYS ADD PB 1 PG 17
Utilities
Utilities
Phone Available
Sewer type
Public Sewer
Heating system
Heat Pump (Heating), Central
Cooling system
Central Air
Water source
Public
Amenities
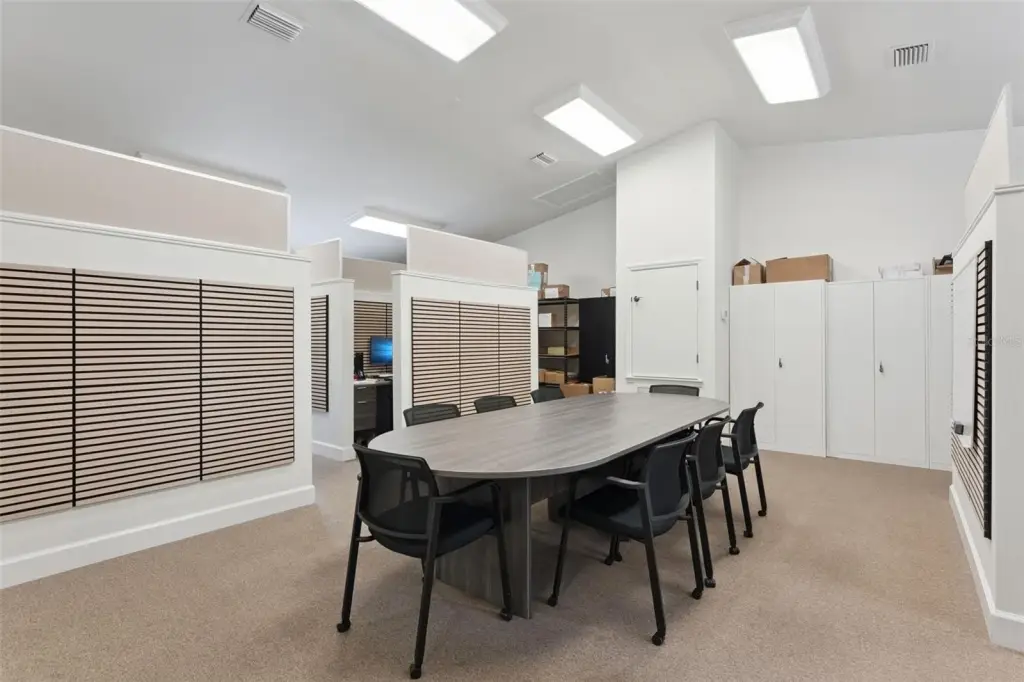
conference room
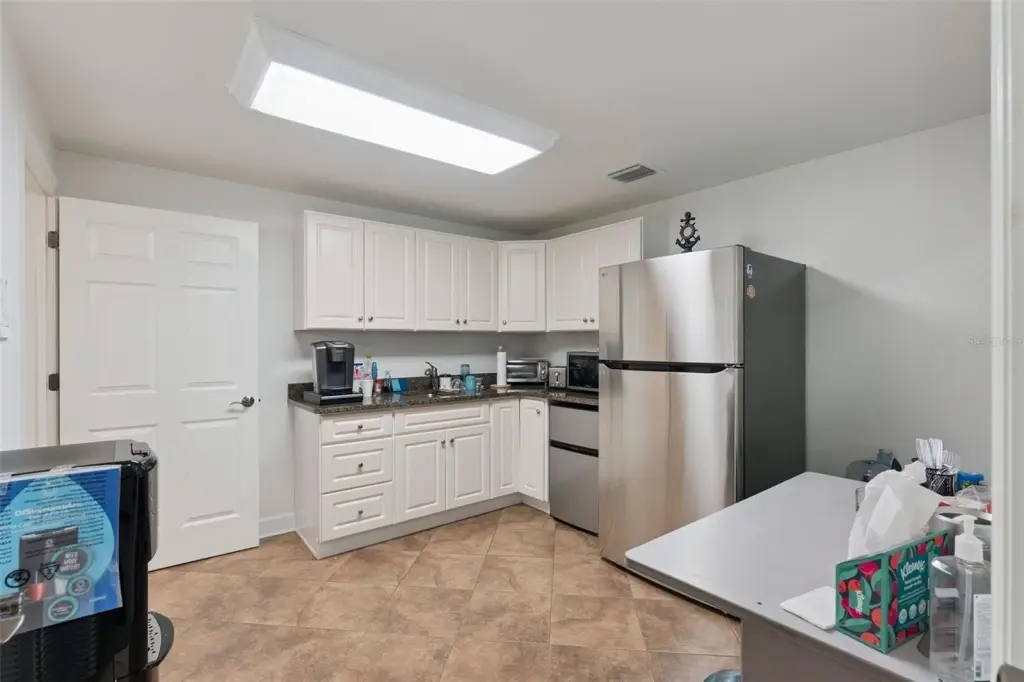
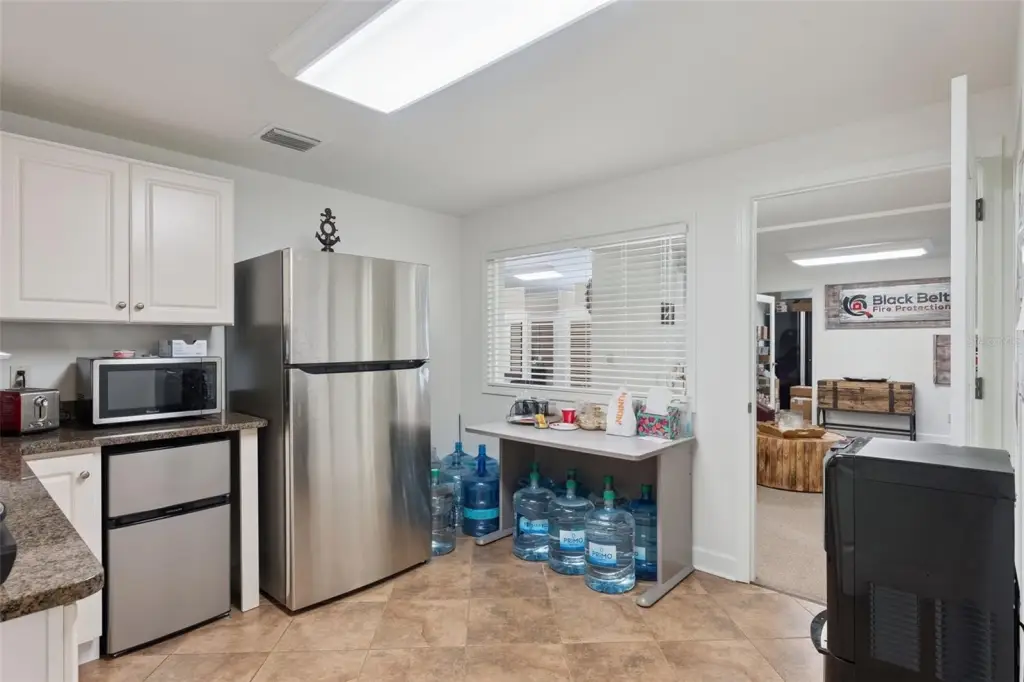
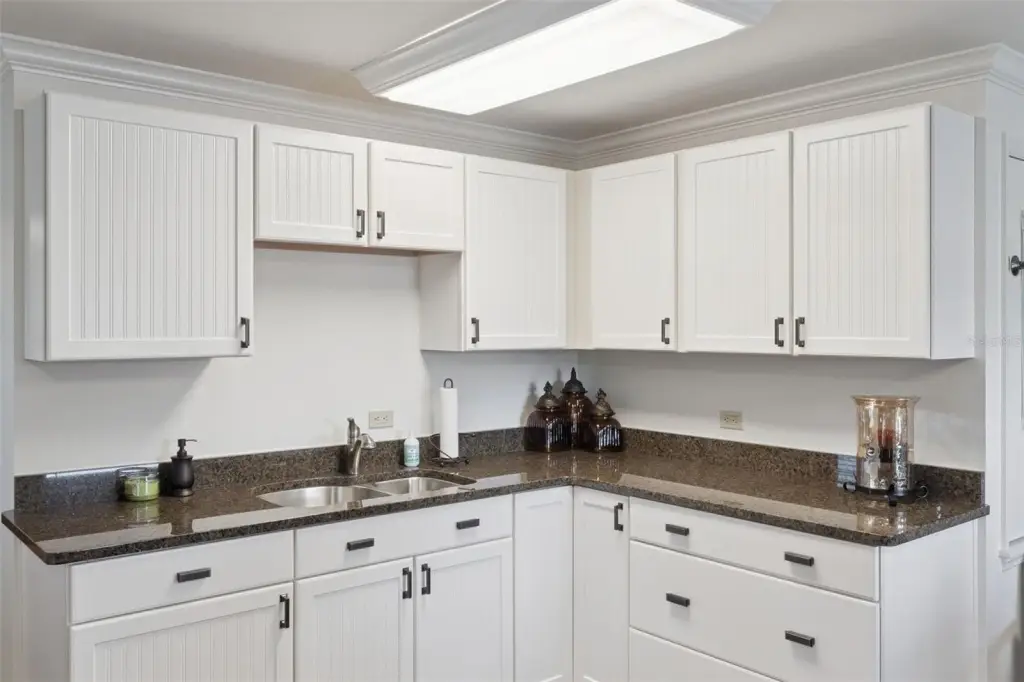
kitchen
storage shed
Building Details
Year built
1982
Floors in Building
2
Flooring type
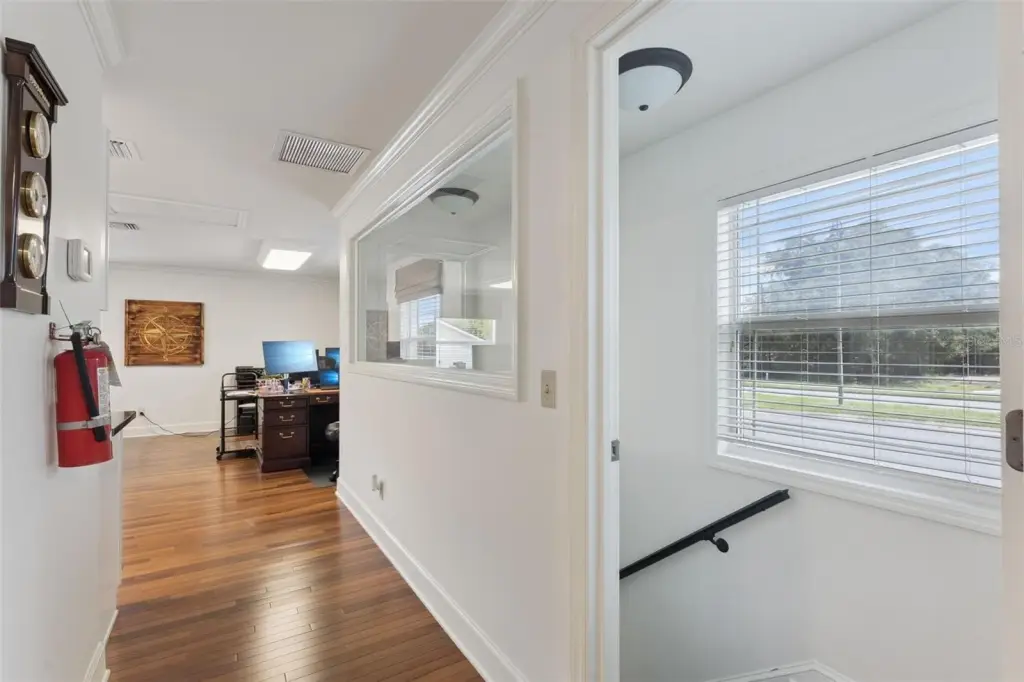
Hardwood, Tile - Ceramic, Carpet
Building materials
Block, Concrete, Stucco
Listing Agency:
RE/MAX TOWN & COUNTRY REALTY · RE/MAX International
(407) 695-2066
Listed By:
Randy Adams PA
(321) 438-1027
Added: Sep 4
Changed: Oct 16
Last Checked: Oct 20 at 9:06PM
MLS# O6439245
Copyright © 2026 Stellar MLS. All rights reserved. All information provided by the listing agent/broker is deemed reliable but is not guaranteed and should be independently verified.

Ask AI about this property
Review the available facts, identify missing information and prepare questions for the agent.
Investment Insights
Based on property information with market context.
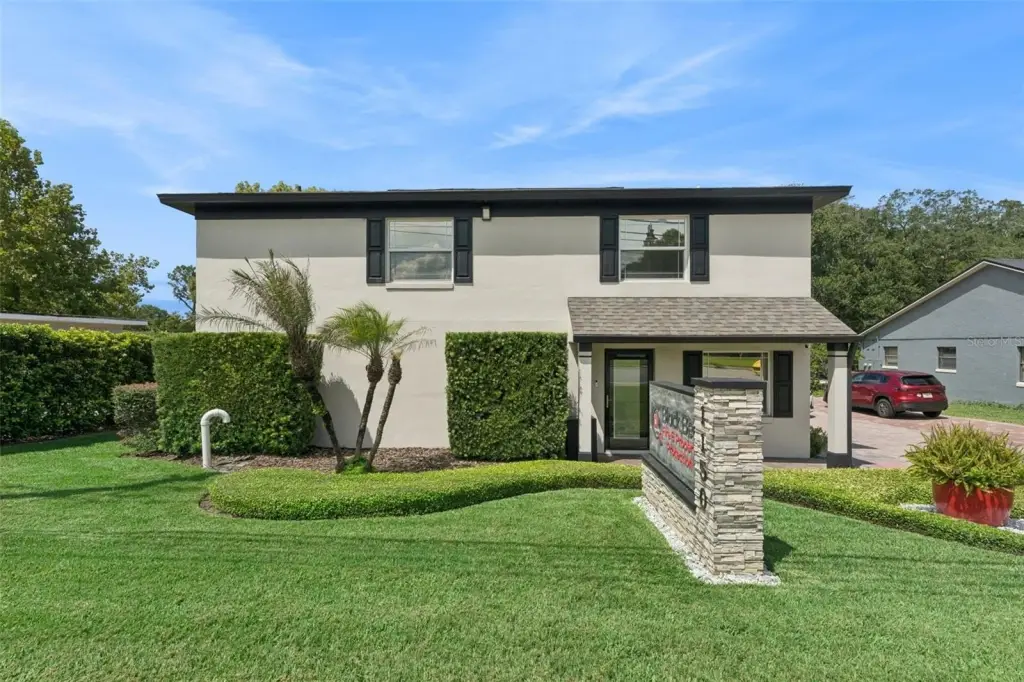
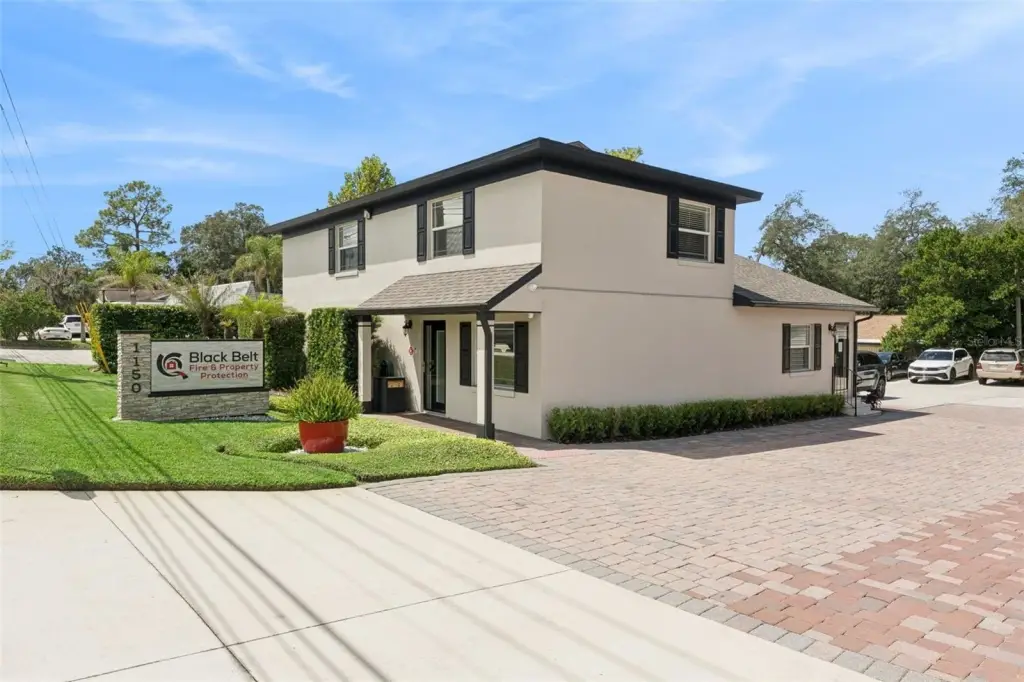
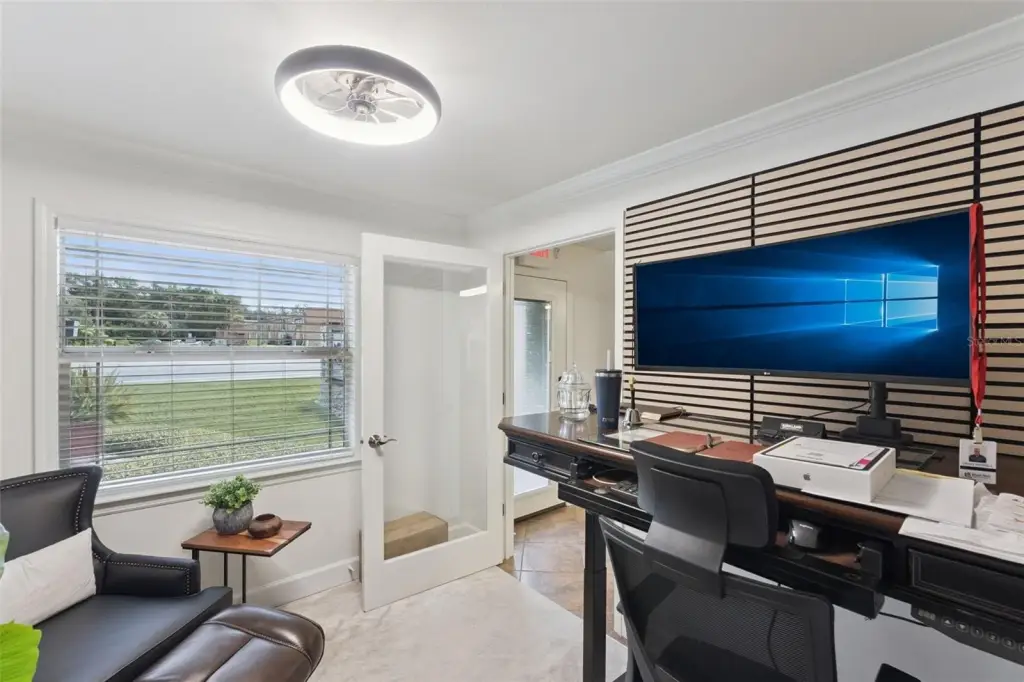
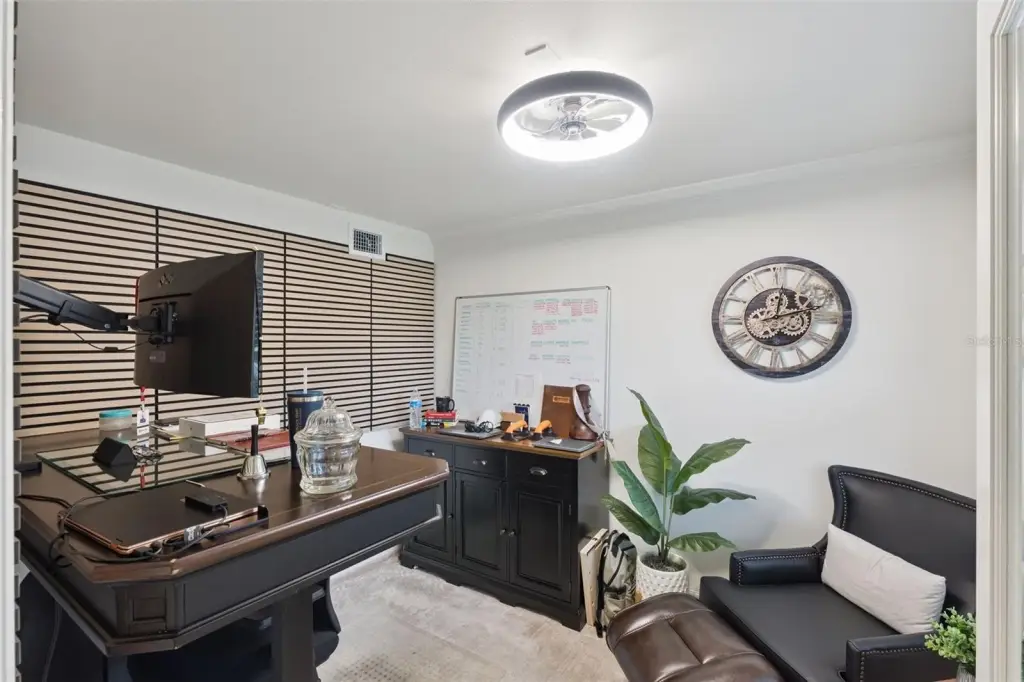
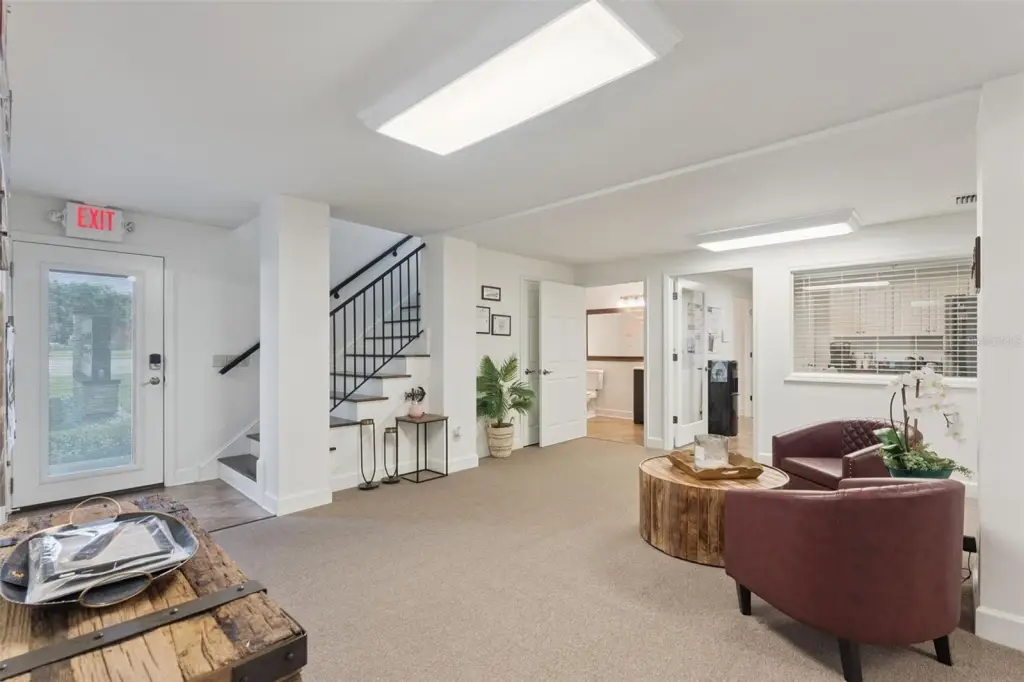
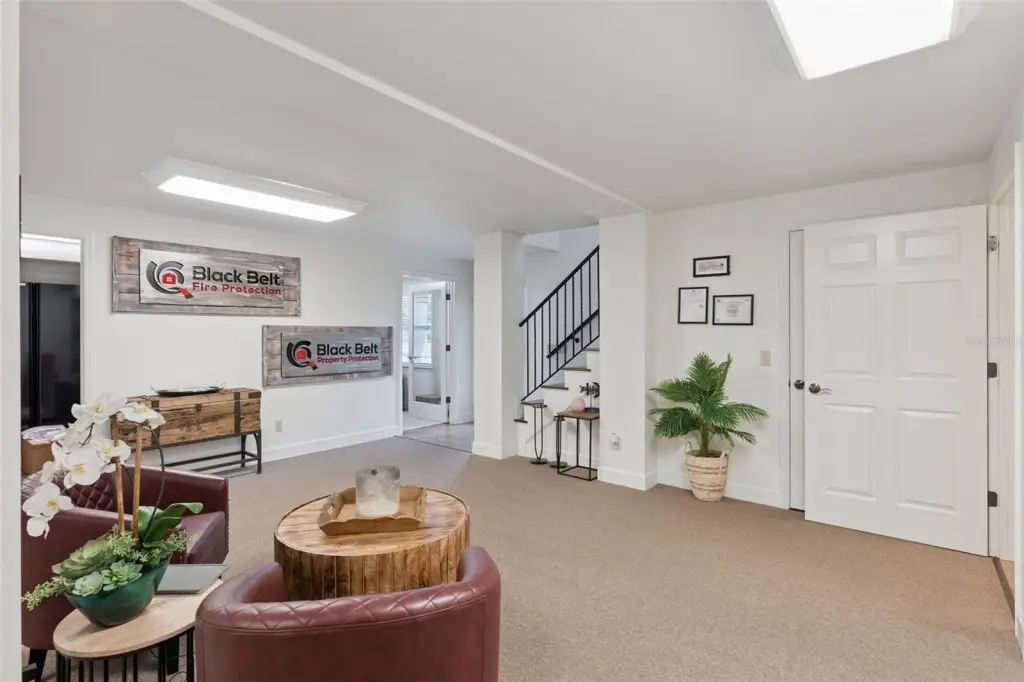
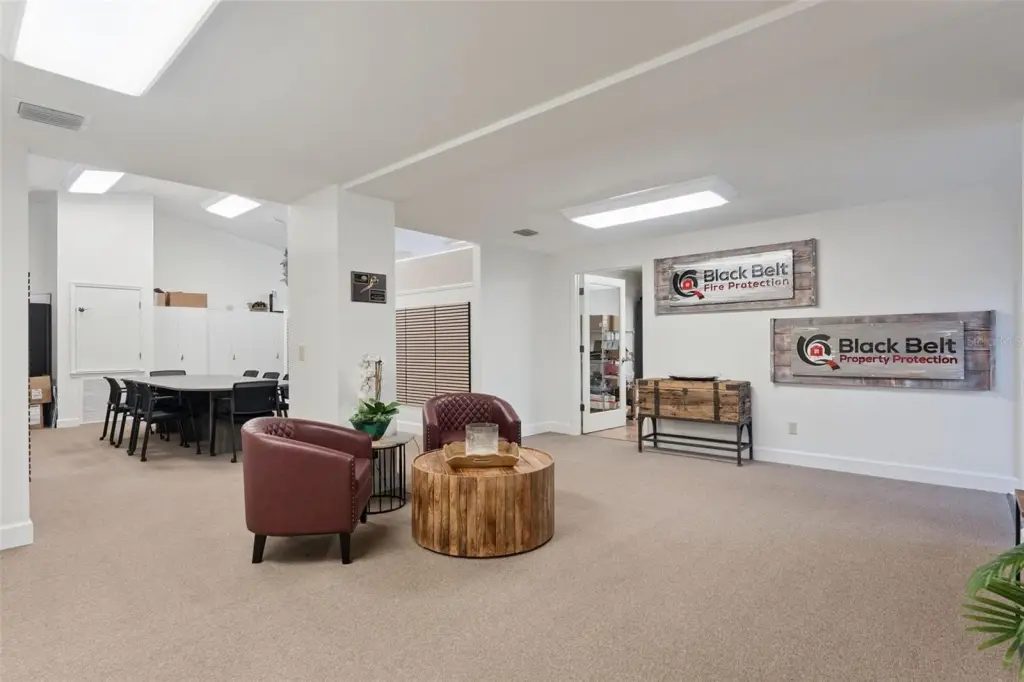
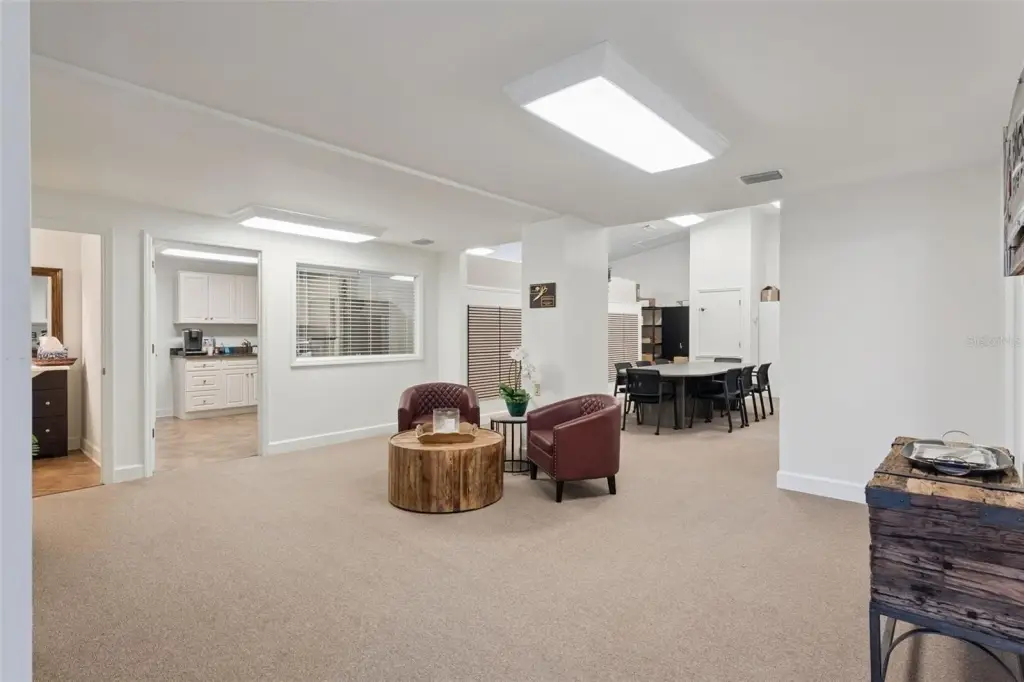
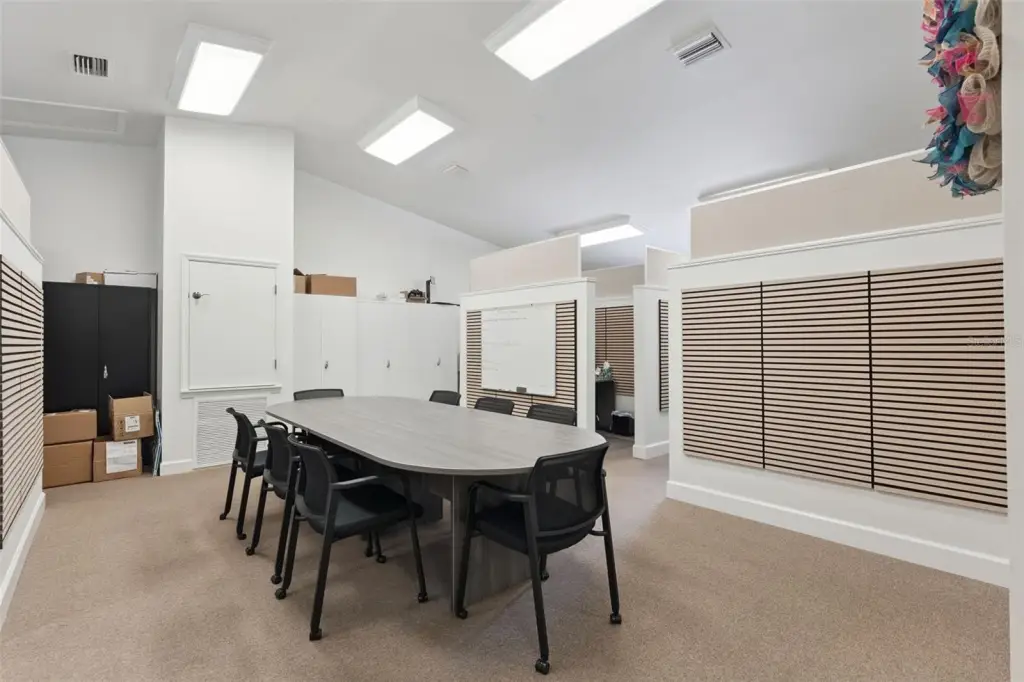
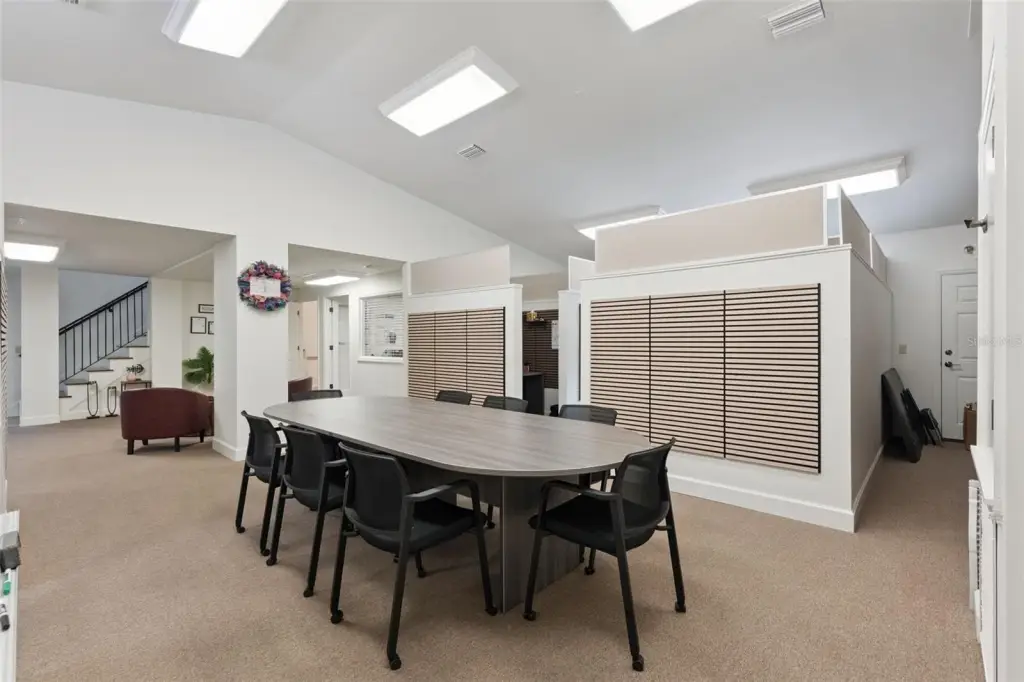
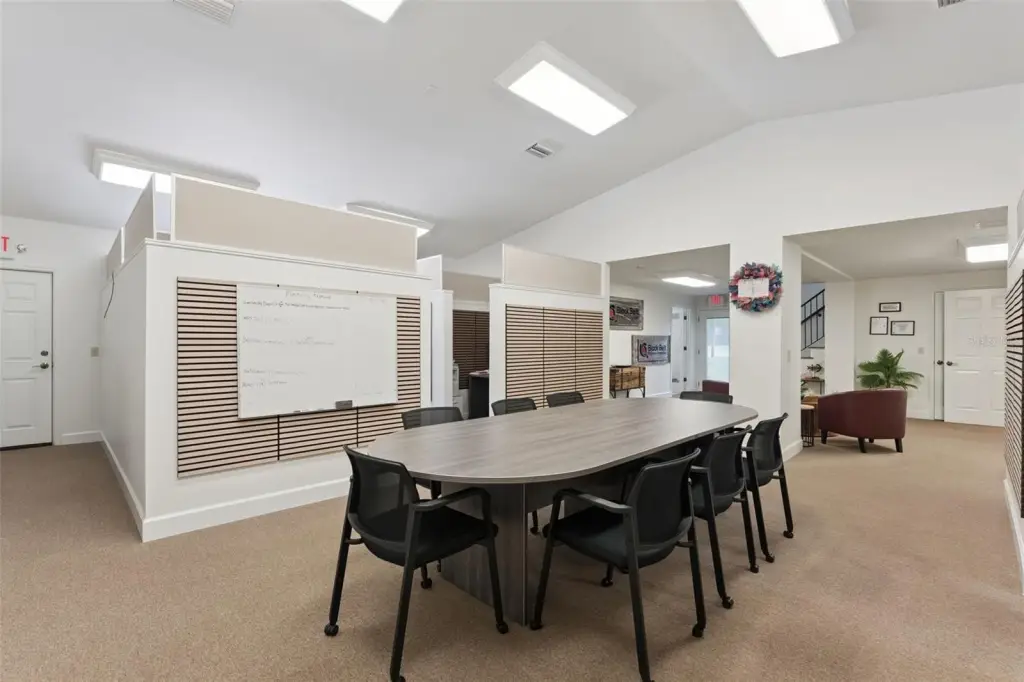
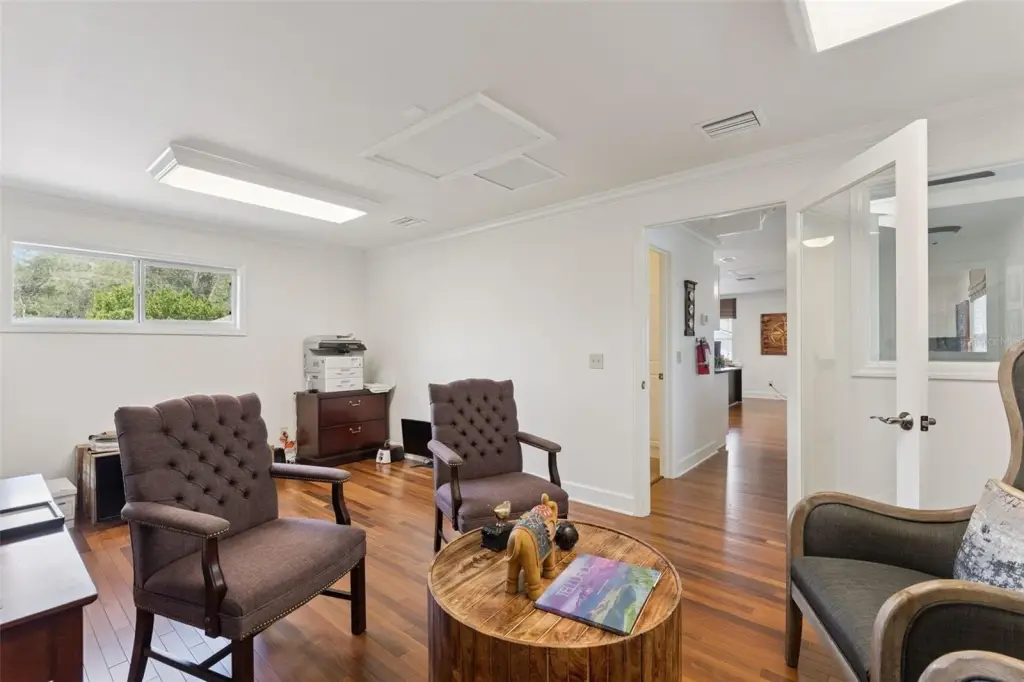
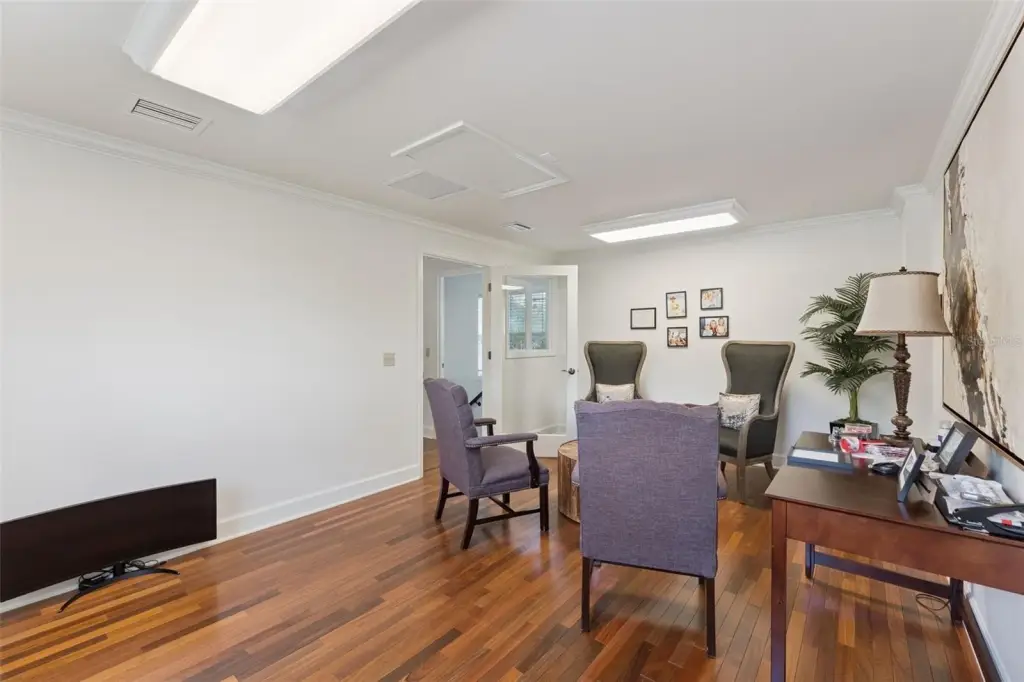
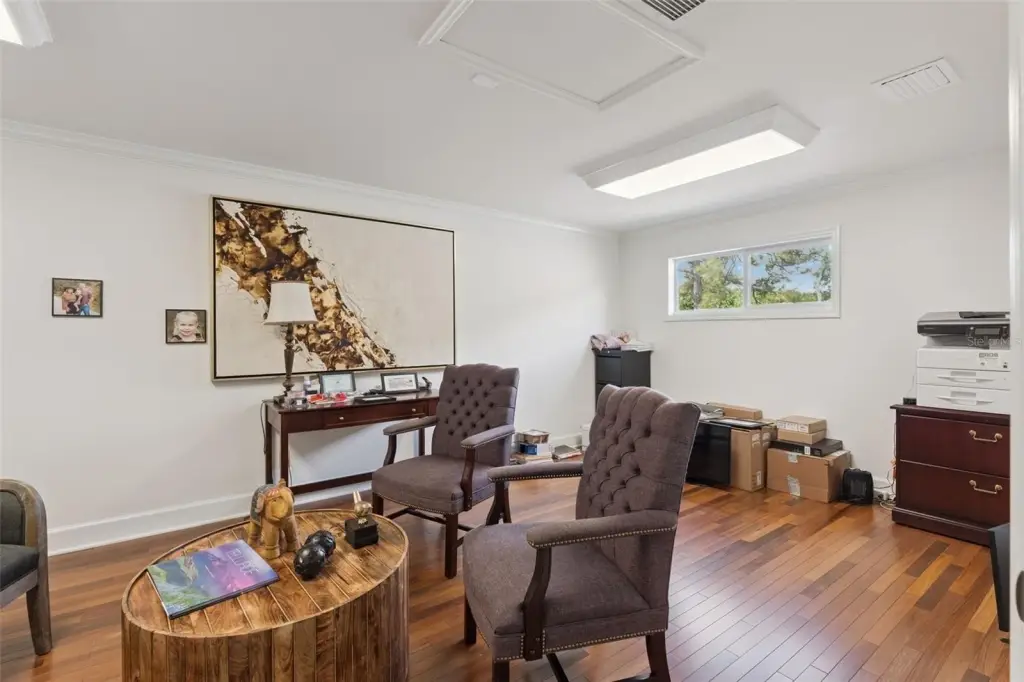
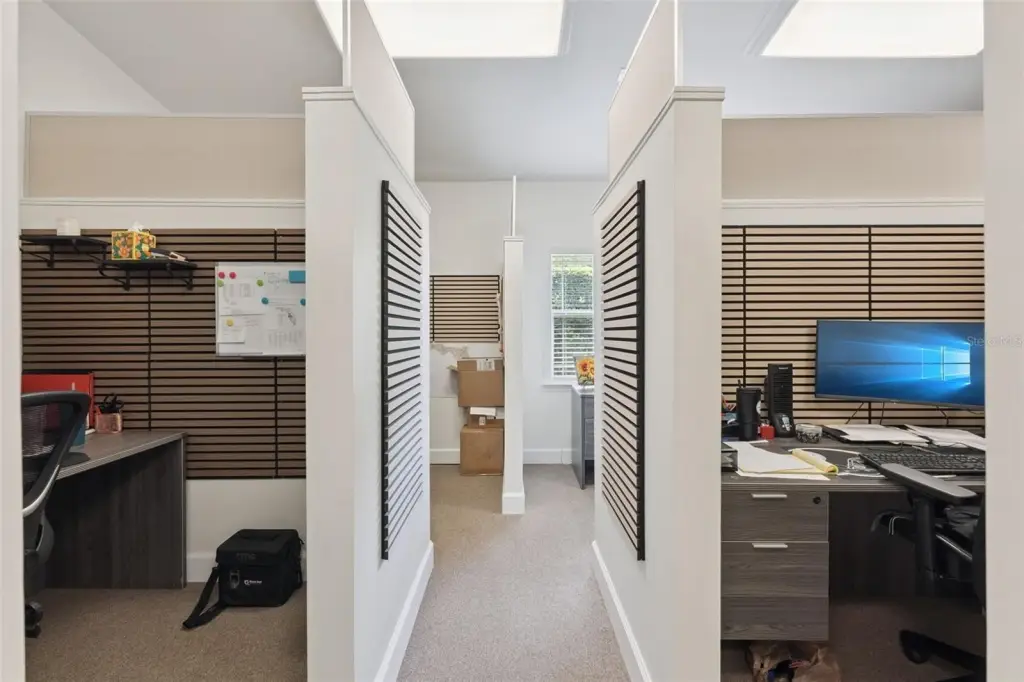
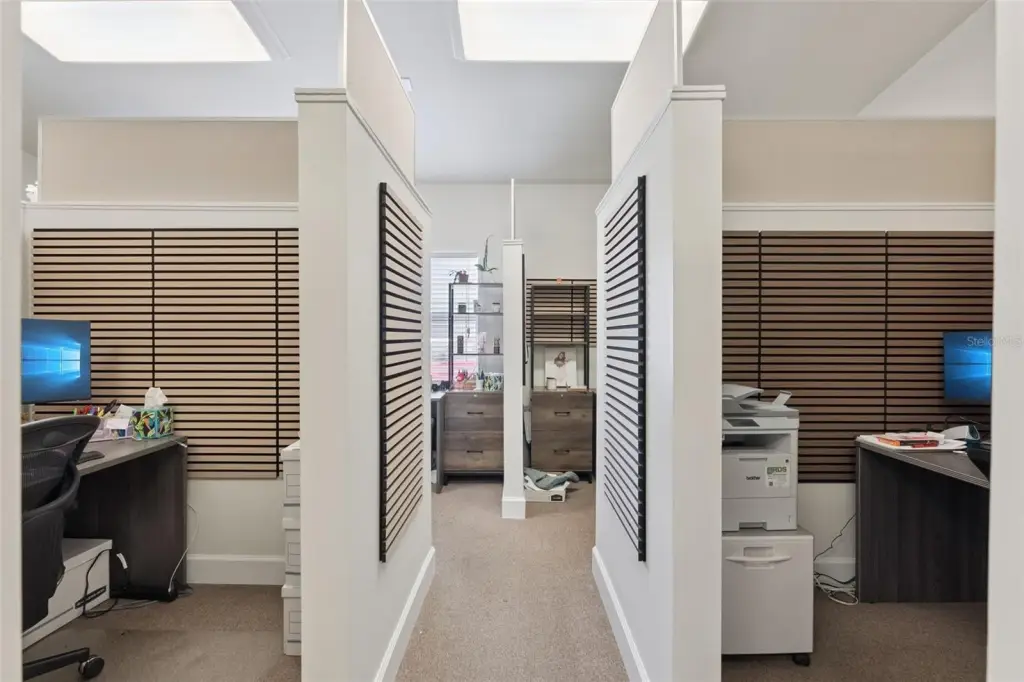
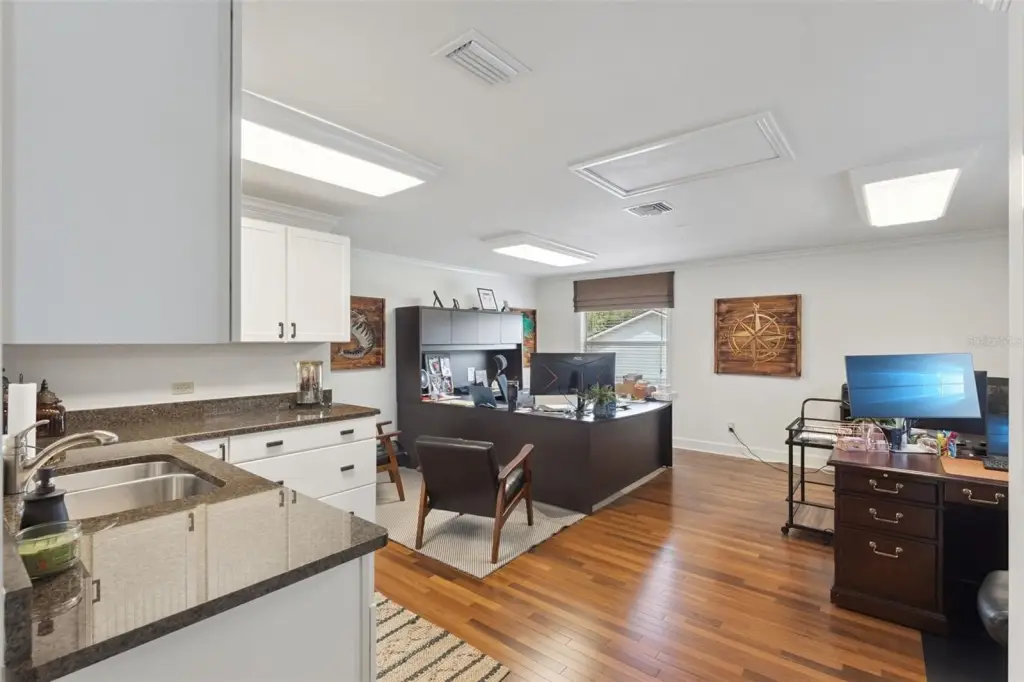
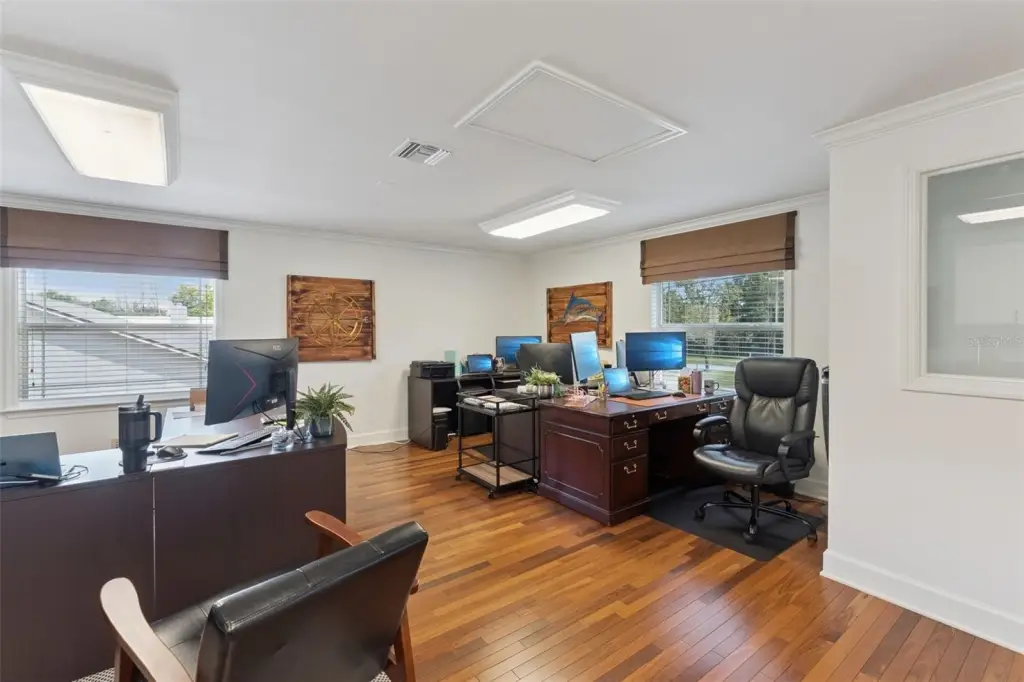
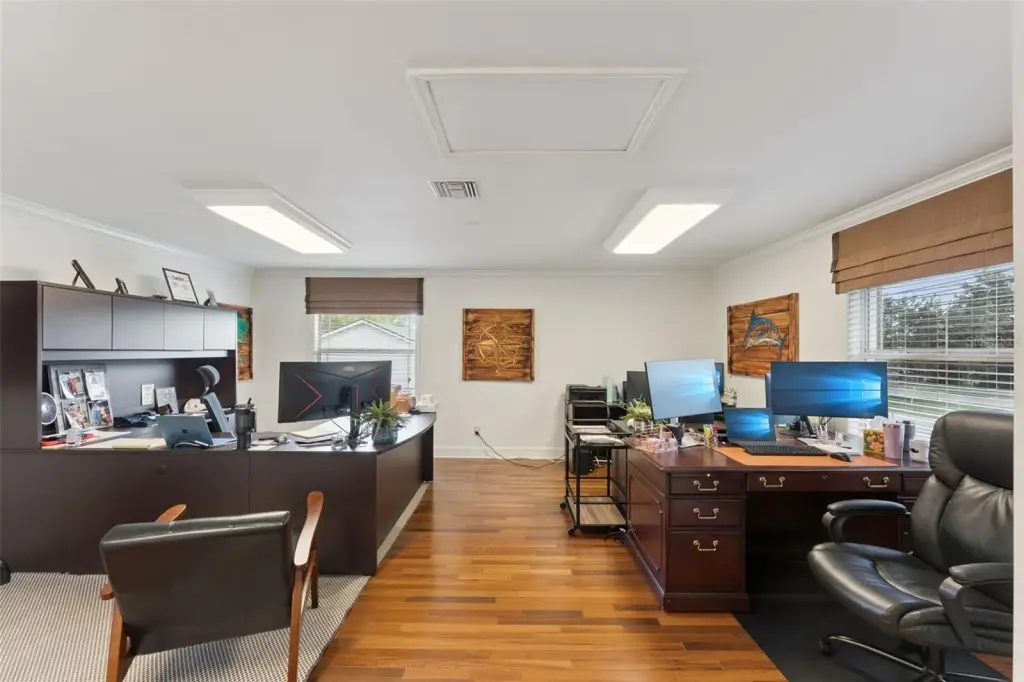
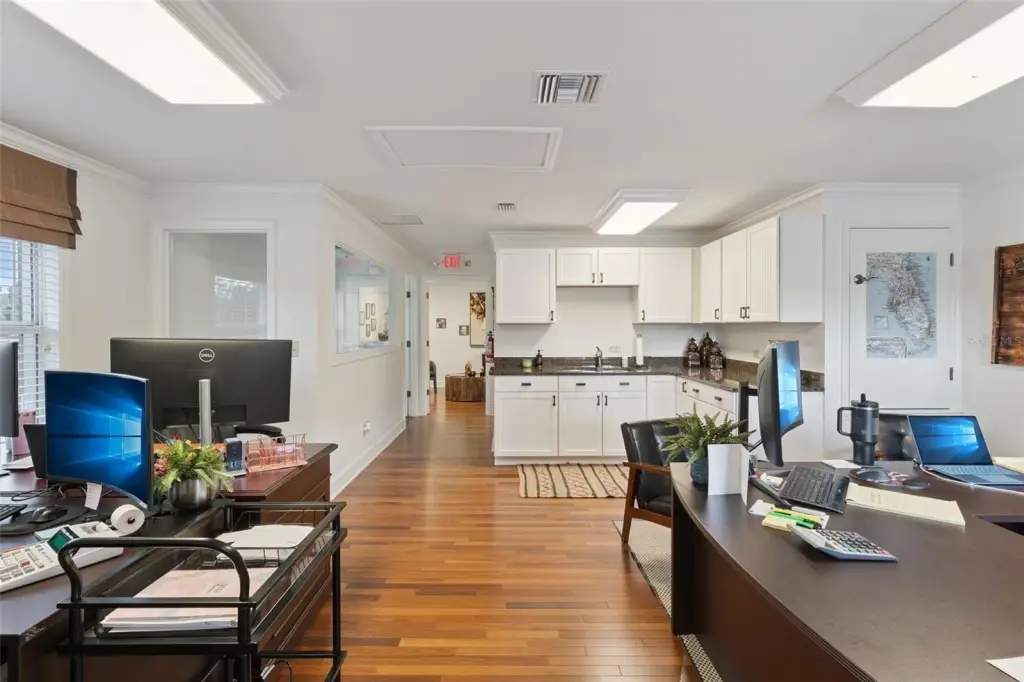
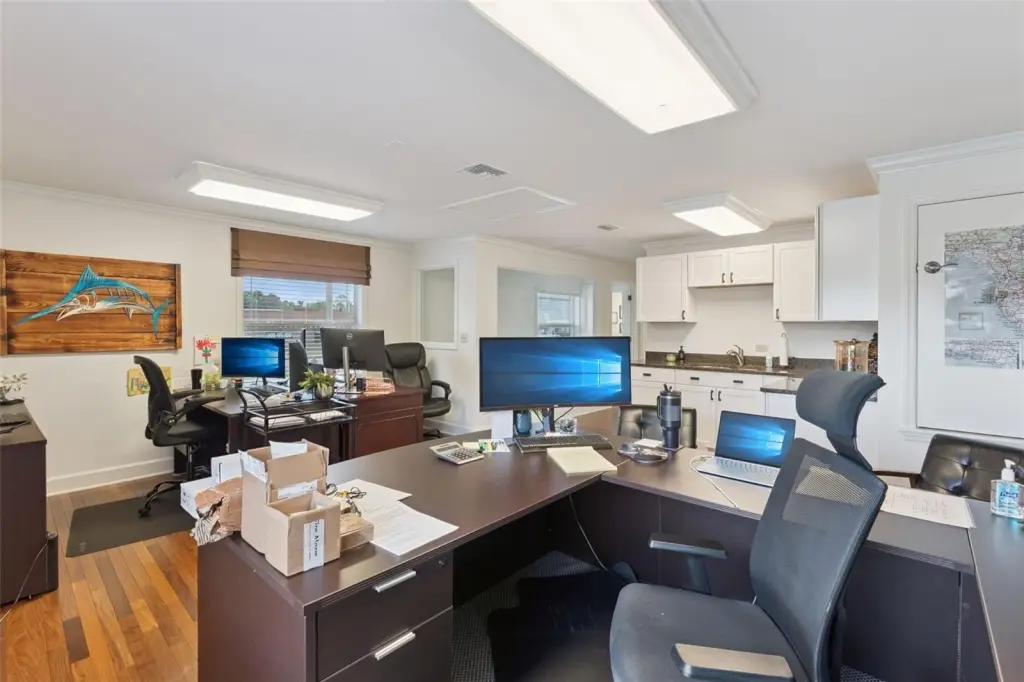
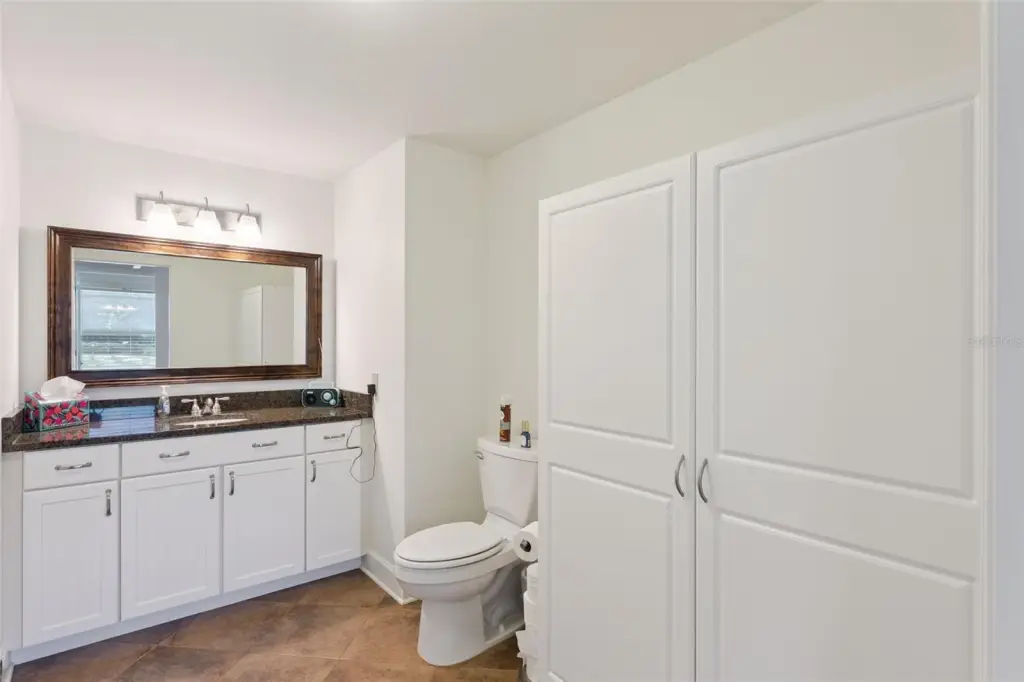
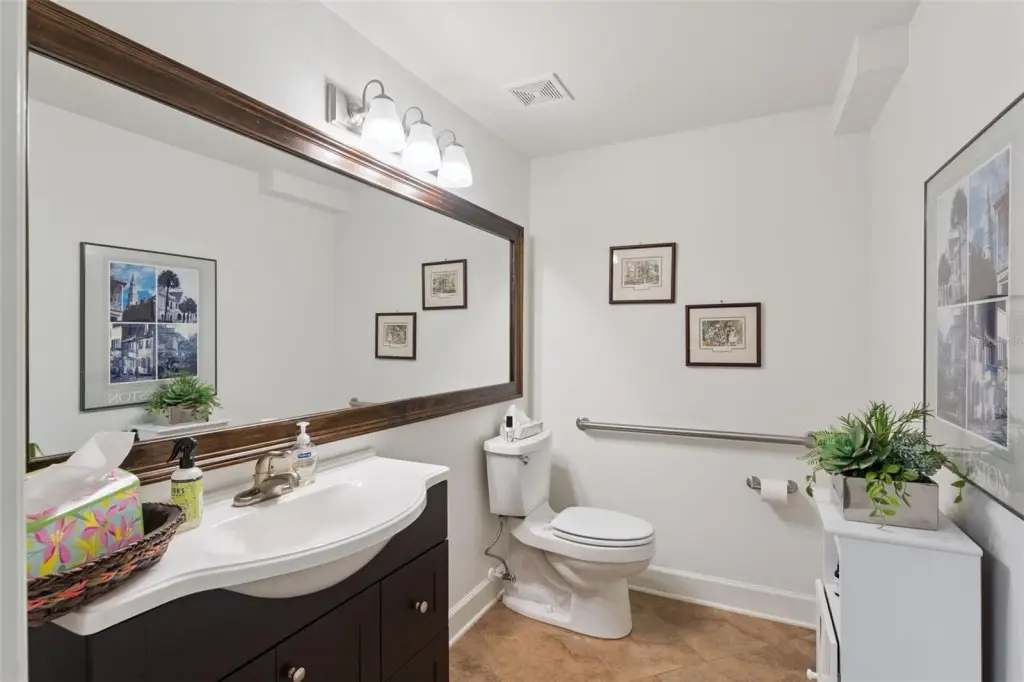
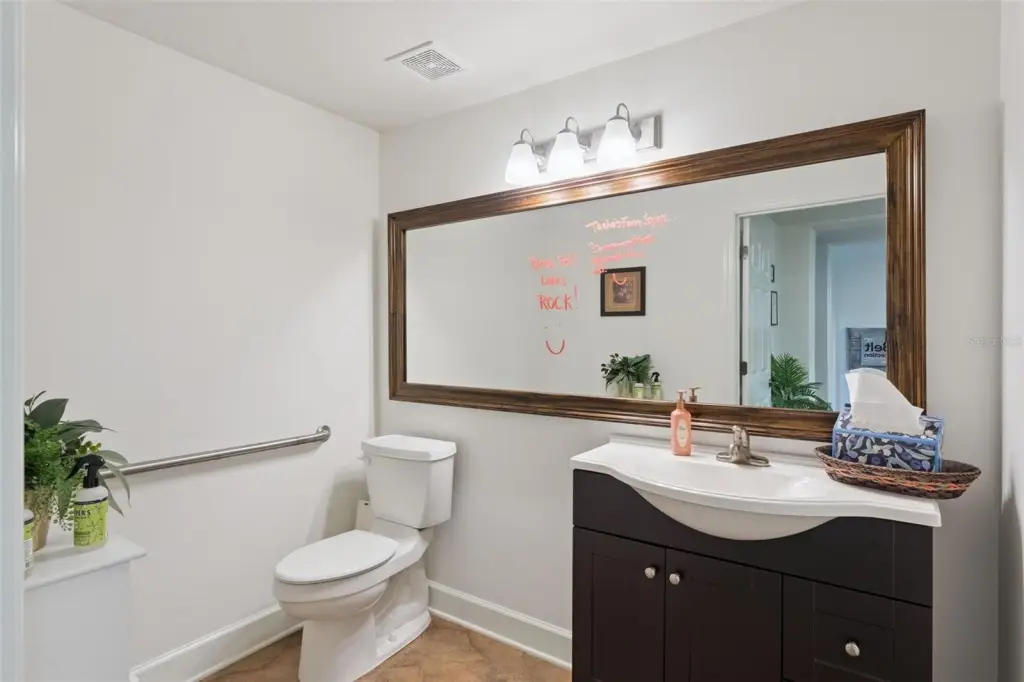
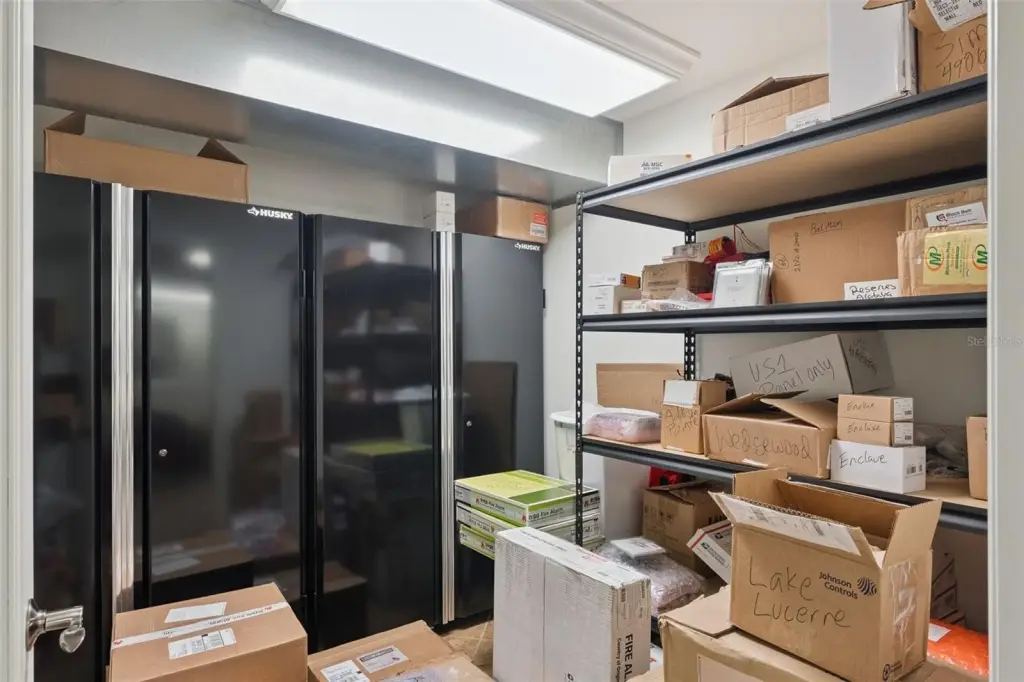
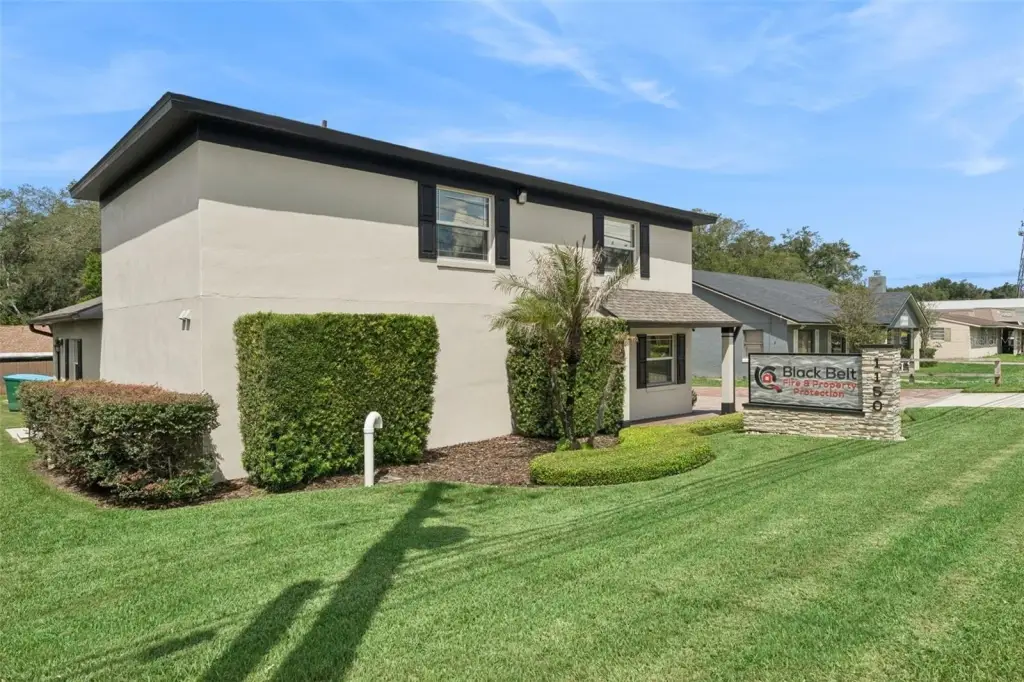
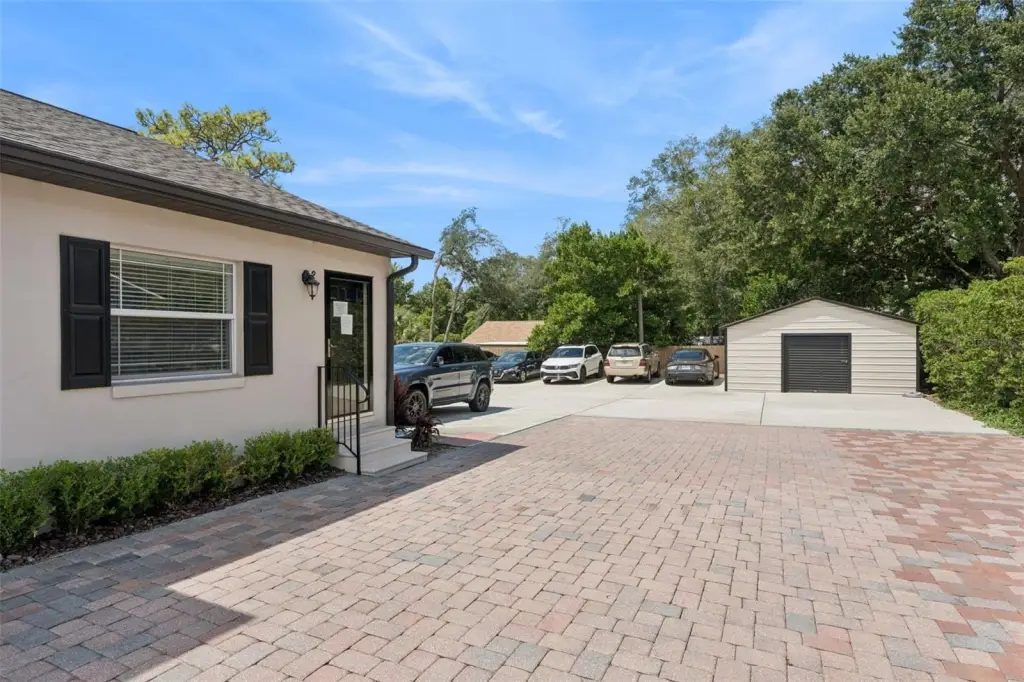
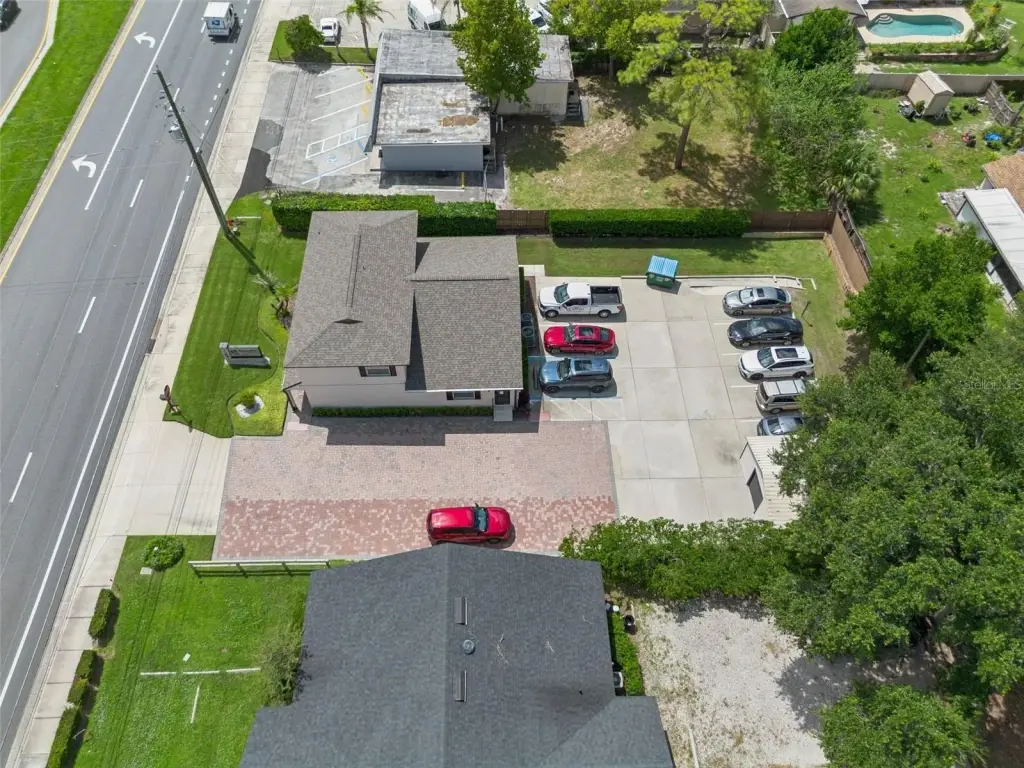
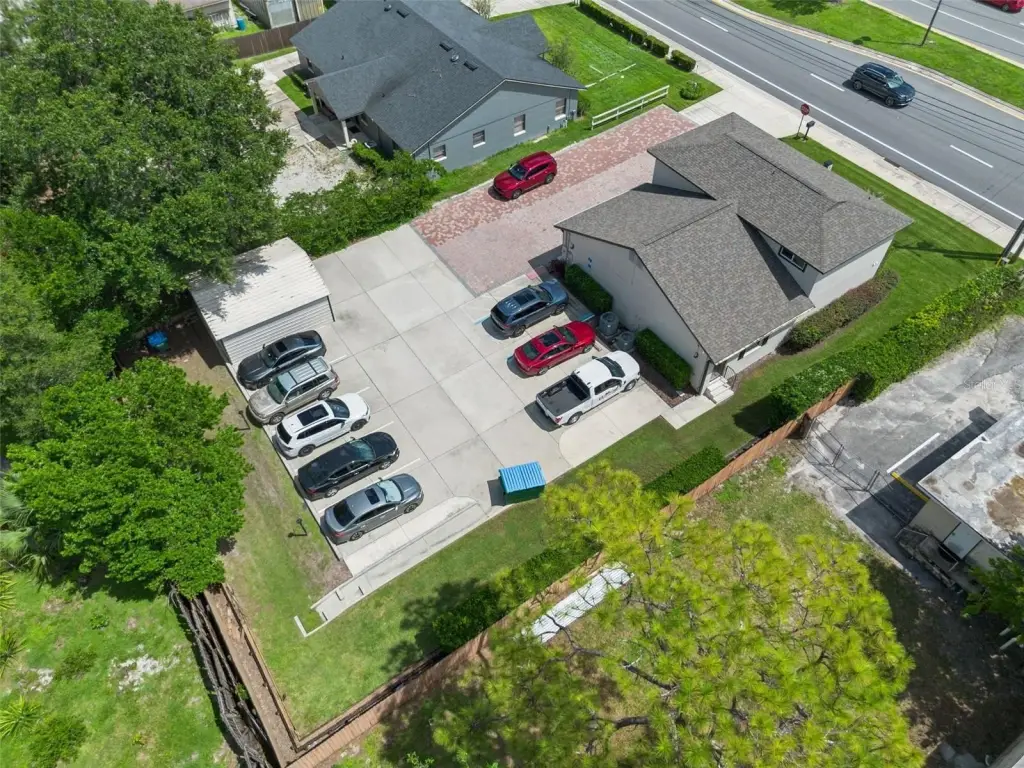
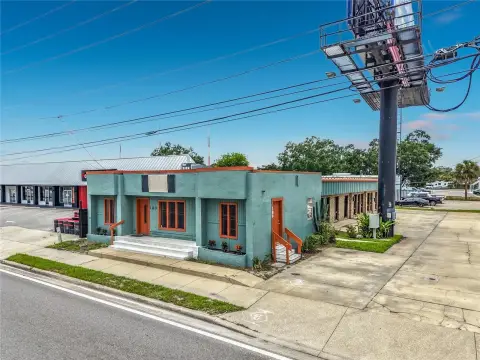
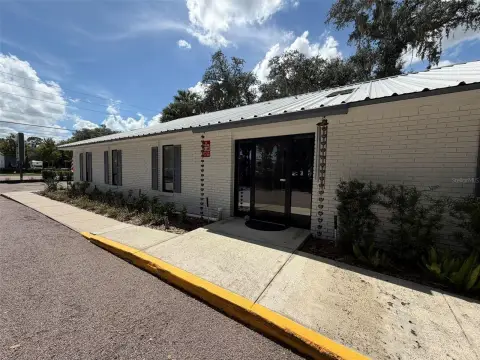
This 2,480-square-foot, two-story block building supports a live-work configuration with distinct business and residential-style areas. The ADA-compliant first floor includes eight built-in cubicles, two offices, a conference room, kitchen, two bathrooms, and a utility room. The upper level has a large office or bedroom, private bath plumbing for a shower, kitchen area, living room, and a separate entrance. Brazilian walnut flooring, crown molding, tempered interior glass, solid-core doors, and two HVAC systems serve the property. A fully enclosed storage shed adds secure space for equipment, inventory, or supplies.
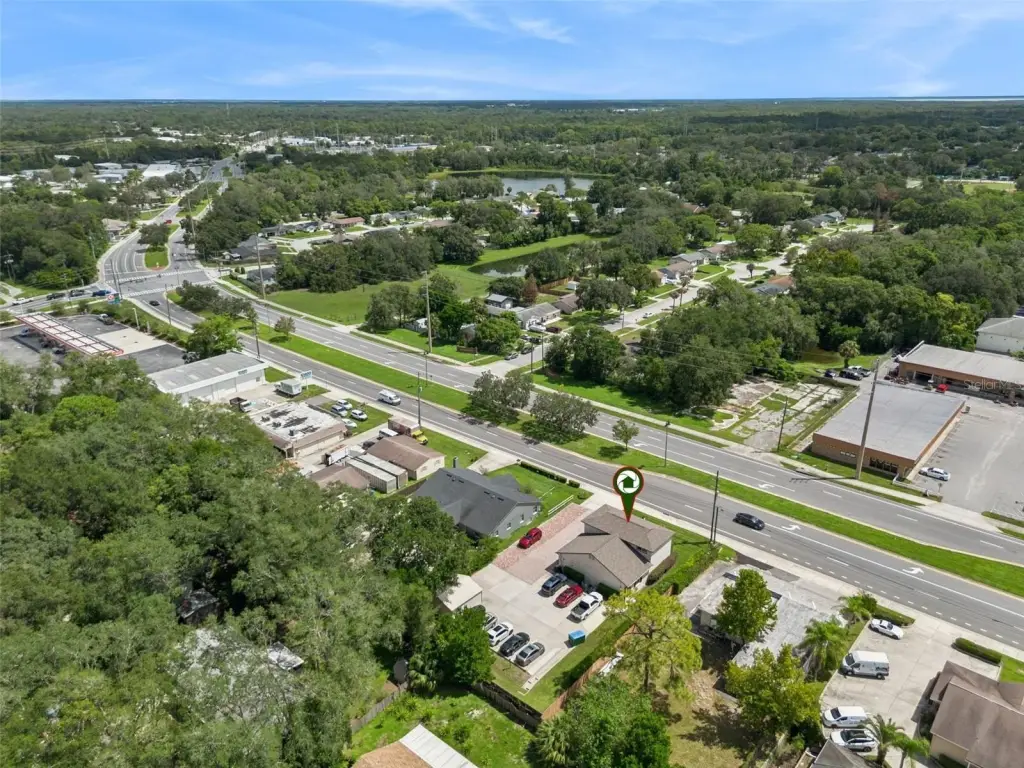
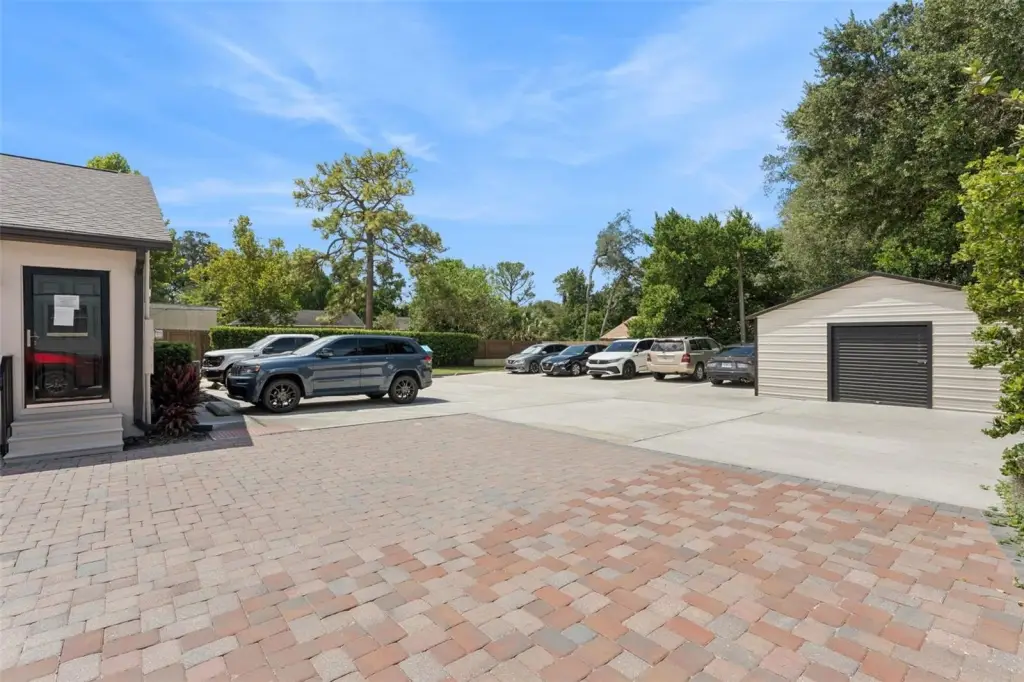
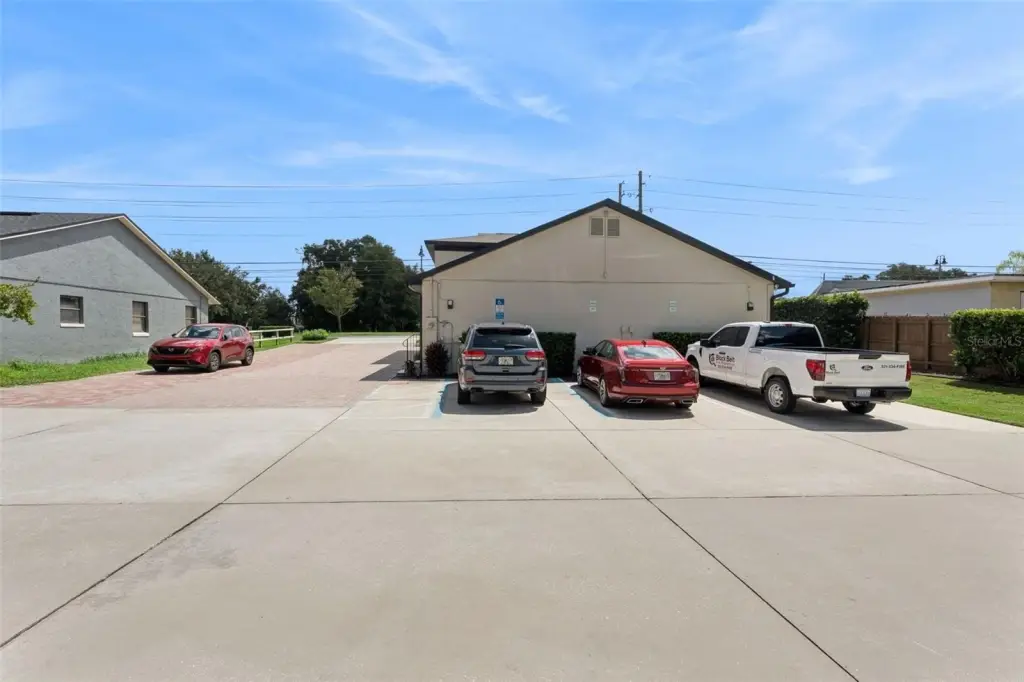
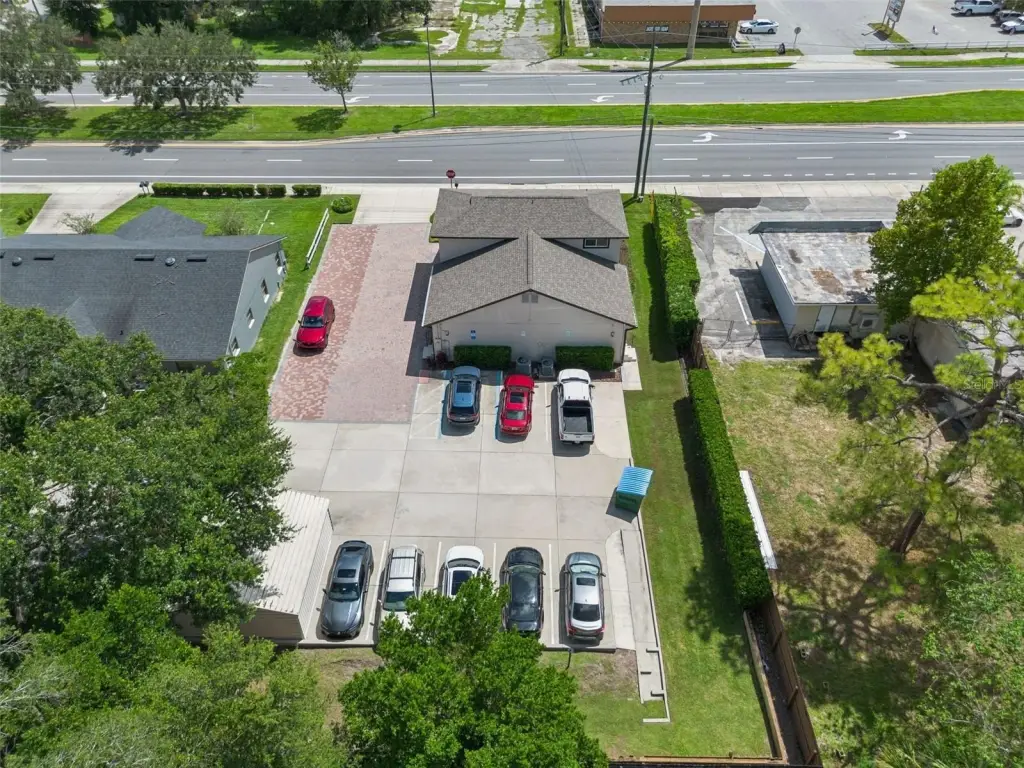
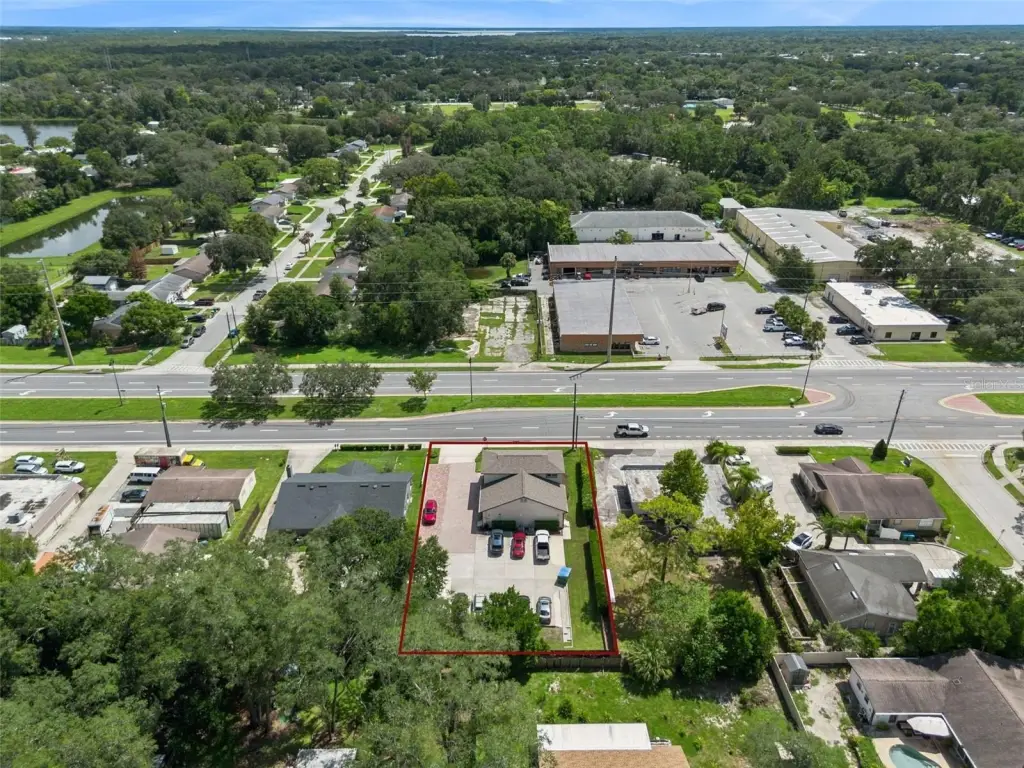
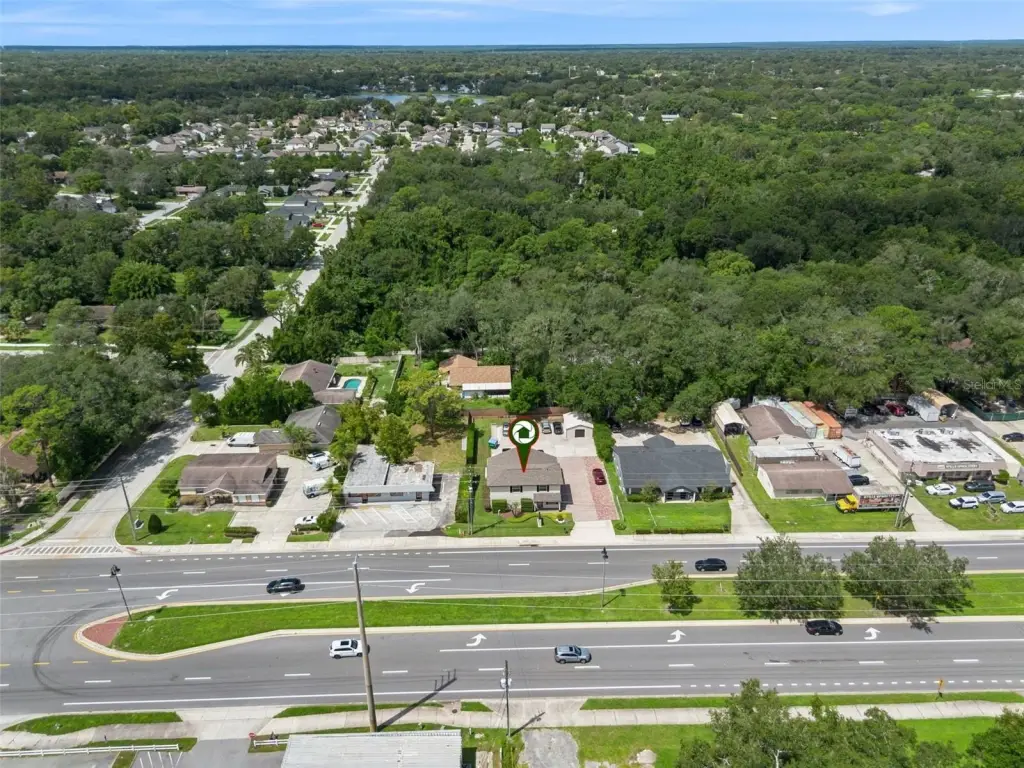
The 0.31-acre property includes 11 parking spaces and is located near Longwood’s Historic District. Improvements include a 2023 roof, 2023 exterior paint, 2023 first-floor carpet, a 2017 water heater, hurricane-rated dual-pane windows, and shatter-resistant storm doors. Public water and public sewer serve the site, and natural gas is available.
The 0.31-acre property includes 11 parking spaces and is located near Longwood’s Historic District. Improvements include a 2023 roof, 2023 exterior paint, 2023 first-floor carpet, a 2017 water heater, hurricane-rated dual-pane windows, and shatter-resistant storm doors. Public water and public sewer serve the site, and natural gas is available.
Key Highlights
- Live‑work use with 2,480 square feet across two stories
- ADA‑compliant first floor with 8 built‑in cubicles, 2 offices, and a conference room
- Upper level includes a separate entrance, office or bedroom, kitchen area, and living room
Financial Insights
Estimated NOI and Cap Rate
NOI / Yr
$37,051
Cap Rate
5.11%
Suggested Prices Based on Cap Rates
Cap Rate 5%
$741,020
$741.0K
Cap Rate 7%
$529,300
$529.3K
Cap Rate 9%
$411,678
$411.7K
Market Conditions
NOI Build-Up for 2,480 SF
Gross rent
$59.5K $24.00/SF
− Vacancy
−$10.1K −$4.08/SF
EGI
$49.4K $19.92/SF
− OpEx
−$12.4K −$4.98/SF
NOI
$37.1K $14.94/SF
Area
Seminole County, FL
Vacancy
17.00%
Lease Rate
$24.00 /SF/Yr
Expense Ratio
25.00%
Simulate Cap Rate and NOI
Suggested Prices Based on Cap Rates
Cap Rate 5%
$741,020
Cap Rate 7%
$529,300
Cap Rate 9%
$411,678
Alternative Uses
Best Use
Office B
$529.3K
$463.1K – $617.5K
NOI $37,051 @ 7.0% cap · market cap 5.11%
Second Best
Mixed Use
$467.7K
$409.2K – $545.6K
NOI $32,736 @ 7.0% cap · market cap 4.52%
Theoretical Best
Office A
$705.7K
$617.5K – $823.4K
NOI $49,402 @ 7.0% cap · market cap 6.81%
Zoning and permitted uses should be independently verified with authorities.
How Realmo checks its estimates
Property Analytics
Unlock full access to Insights
Subscribe to Realmo Intelligence
Open Analytics
Current Use
Lease Details
Yes
Utilities to site
Location Intelligence
Trade Area within ½ mile
516
Businesses Nearby
Explore this area
Business Placement
Demographics for 32750, FL
25,261
Population
10,541
Households
2.4
Avg Household Size
43
Median Age
37%
College-Educated
93%
High-School Grad
11.4 sq mi
ZIP Area
2,216
Density / Sq Mi
$85,227
Median Household Income
$48,311
Median Earnings
$1,633
Median Rent
$350,600
Median Home Value
Check the figures for this property
Cap Rate, Value Estimation, Potential NOI and more
View Realmo Analytics
Market
Vacancy Rate% for Office in South region





Frequently Asked Questions
What type of property is this?
Live-work space - Renovated standalone property combines business space with residential-style accommodations and separate second-floor access.
Where is this live-work space located?
The property is located at 1150 N RONALD REAGAN Boulevard Longwood, FL.
What is the asking price?
The asking price for this property is $725,000.
What are key features of this property?
This property features: Live‑work use with 2,480 square feet across two stories; ADA‑compliant first floor with 8 built‑in cubicles, 2 offices, and a conference room; Upper level includes a separate entrance, office or bedroom, kitchen area, and living room


