Automotive Shop with Paint
For Sale
Contact for pricing
Pending
1122 Elliott Road, Paradise, CA 95969
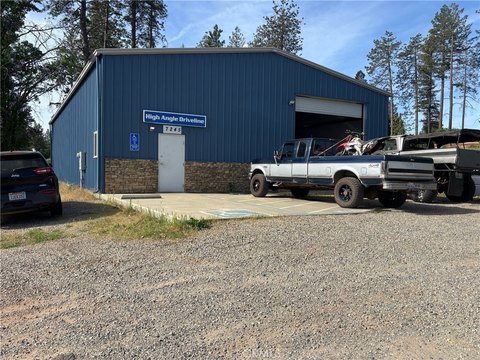
Operating automotive facility with specialized equipment, office space, and vehicle-access loading.
Property Size6,250 SF
Days on Market106
Property Features for 1122 Elliott Road
General Information
Standard status
Pending
Size
6,250 SF
Class
C
Property subtype
Industrial
Investment Type
Owner/User
Additional Details
Road Access
Yes
Amenities
swamp cooler
gas heating units
rear roll-up door
private office
break room
three restrooms
Building Details
Year Renovated
2019
Buildings
1
Stories
1
Listing Agency:
Capital Rivers Commercial
Listed By:
Carrie Welch · License #01926238
(916) 804-8046
Source:
Crexi
Added: Jun 23
Changed: Sep 28
Last Checked: Oct 5 at 6:11PM
Displayed information is deemed reliable but is not guaranteed and should be independently verified. All listing content including descriptions, pricing, images are the copyrighted material of Capital Rivers Commercial
Investment Insights
Based on property information with market context.
The property combines an established automotive shop with dedicated office and customer waiting areas. The shop measures approximately 4,700 SF, while the office and waiting area encompasses approximately 1,500 SF with a private office, break room, and three restrooms. Building improvements include a roof installed in 2018 and HVAC added in 2019. Additional features include a swamp cooler, gas heating units, 10-foot clear height, and a 9' x 12' rear roll-up door.
Included equipment and furnishings span a separate building with an AFC downdraft heated paint booth, full Cromax paint system, Breewco 360 frame rack and frame equipment, two 10-ton lifts, welders, an air compressor, heat lamps, car and air jacks, workbenches, a camera system, and office furnishings. The property fronts Elliott Road in Paradise and sits within an established commercial corridor near local businesses, residential neighborhoods, and community services.
Included equipment and furnishings span a separate building with an AFC downdraft heated paint booth, full Cromax paint system, Breewco 360 frame rack and frame equipment, two 10-ton lifts, welders, an air compressor, heat lamps, car and air jacks, workbenches, a camera system, and office furnishings. The property fronts Elliott Road in Paradise and sits within an established commercial corridor near local businesses, residential neighborhoods, and community services.
Key Highlights
- Approximately 4,700 SF automotive shop with approximately 1,500 SF office/waiting area
- Separate building with AFC downdraft heated paint booth and full Cromax paint system
- Breewco 360 frame rack, frame equipment, two 10‑ton lifts, welders, and air compressor included
Financial Insights
Estimated NOI and Cap Rate
NOI / Yr
$37,958
Cap Rate
7.23%
Suggested Prices Based on Cap Rates
Cap Rate 5%
$759,160
$759.2K
Cap Rate 7%
$542,257
$542.3K
Cap Rate 9%
$421,756
$421.8K
Market Conditions
NOI Build-Up for 6,250 SF
Gross rent
$56.3K $9.00/SF
− Vacancy
−$2.0K −$0.32/SF
EGI
$54.2K $8.68/SF
− OpEx
−$16.3K −$2.60/SF
NOI
$38.0K $6.07/SF
Area
Butte County, CA
Vacancy
3.60%
Lease Rate
$9.00 /SF/Yr
Expense Ratio
30.00%
Simulate Cap Rate and NOI
Suggested Prices Based on Cap Rates
Cap Rate 5%
$759,160
Cap Rate 7%
$542,257
Cap Rate 9%
$421,756
Alternative Uses
Best Use
Retail
$2.09M
$1.82M – $2.43M
NOI $145,987 @ 7.0% cap · market cap 27.81%
Second Best
Industrial
$542.3K
$474.5K – $632.6K
NOI $37,958 @ 7.0% cap · market cap 7.23%
Theoretical Best
Office A
$2.90M
$2.54M – $3.39M
NOI $203,346 @ 7.0% cap · market cap 38.73%
Zoning and permitted uses should be independently verified with authorities.
Property Analytics
Unlock full access to Insights
Subscribe to Realmo Intelligence
Open Analytics
Current Use
Lease Details
Yes
Paved road access
Location Intelligence
Trade Area within ½ mile
483
Businesses Nearby
21k
Monthly Visits Nearby
Well-served
Demand for This Use
Explore this area
Business Placement
Foot Traffic Nearby
Shops & Services 54%
Dining 43%
Apparel 3%
Taco Bell
Dining
9,071 visits/mo
0.4 miles
ARCO
Shops & Services
5,365 visits/mo
0.1 miles
AMPM
Shops & Services
4,399 visits/mo
0.1 miles
Napa Auto Parts
Shops & Services
919 visits/mo
0.1 miles
Clarks
Apparel
638 visits/mo
0.4 miles
Demographics for 95969, CA
5,710
Population
3,908
Households
1.5
Avg Household Size
55
Median Age
30%
College-Educated
95%
High-School Grad
50.7 sq mi
ZIP Area
113
Density / Sq Mi
$72,250
Median Household Income
$47,969
Median Earnings
$1,244
Median Rent
$419,900
Median Home Value
Check the figures for this property
Cap Rate, Value Estimation, Potential NOI and more
View Realmo Analytics
Market
Vacancy Rate% for Retail in West region

Questions? Ask Rey
Realmo’s AI knows this listing — price, zoning, demand, history. Ask anything.



Similar Off Market Nearby
- Craig Drebert's Automotive — 635 Pearson Rd, Paradise, CA 95969
- Gee's Window Tinting and Detail — 5836 Clark Rd, Paradise, CA 95969
- Reno's Brakes — 1305 nunneley rd, paradise, ca 95969
- Paradise Auto Body & Frame — 1122 Elliott Rd, Paradise, CA 95969
- Import Auto — 6057 Clark Rd, Paradise, CA 95969
Frequently Asked Questions
What type of property is this?
Auto shop - Operating automotive facility with specialized equipment, office space, and vehicle-access loading.
Where is this auto shop located?
The property is located at 1122 Elliott Road Paradise, CA.
What is the asking price?
The asking price for this property is $525,000.
What are key features of this property?
This property features: Approximately 4,700 SF automotive shop with approximately 1,500 SF office/waiting area; Separate building with AFC downdraft heated paint booth and full Cromax paint system; Breewco 360 frame rack, frame equipment, two 10‑ton lifts, welders, and air compressor included



