Flexible Shop and Office
For Sale
$3,100,000
1111 & 1027 S 7th Street, Grand Junction, CO 81501
CommercialSale, Grand Junction, CO
Property Size15,563 SF
Lot Size1.52 Acres
Price / SF$199.19
Days on Market190
Property Features for 1111 & 1027 S 7th Street
General Information
Property type
Commercial Sale
Property subtype
Other
Zoning description
Spec purpose
Lot features
Corner Lot
Directions
drive east on Riverside Parkway to S 7th Street, turn north. Properties are on the NW corner.
Subdivision
Grand Junction City
Standard status
Active
Lot size
1.52 Acres
Taxes and HOA fees
Tax Annual Amount
24356
Listing Agency:
VENTURE GROUP
(970) 892-2200
Listed By:
Theresa Englbrecht · License #FA100006764
(970) 201-1849
Added: Mar 31
Changed: Oct 5
Last Checked: Oct 6 at 1:06PM
MLS# 20261423
Copyright © 2026 Grand Junction Area Association of Realtors. All rights reserved. All information provided by the listing agent/broker is deemed reliable but is not guaranteed and should be independently verified.
Investment Insights
Based on property information with market context.
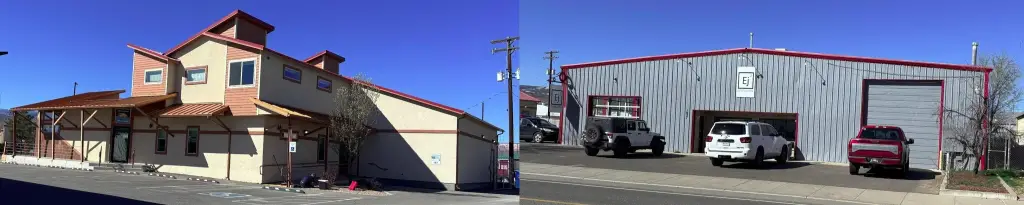
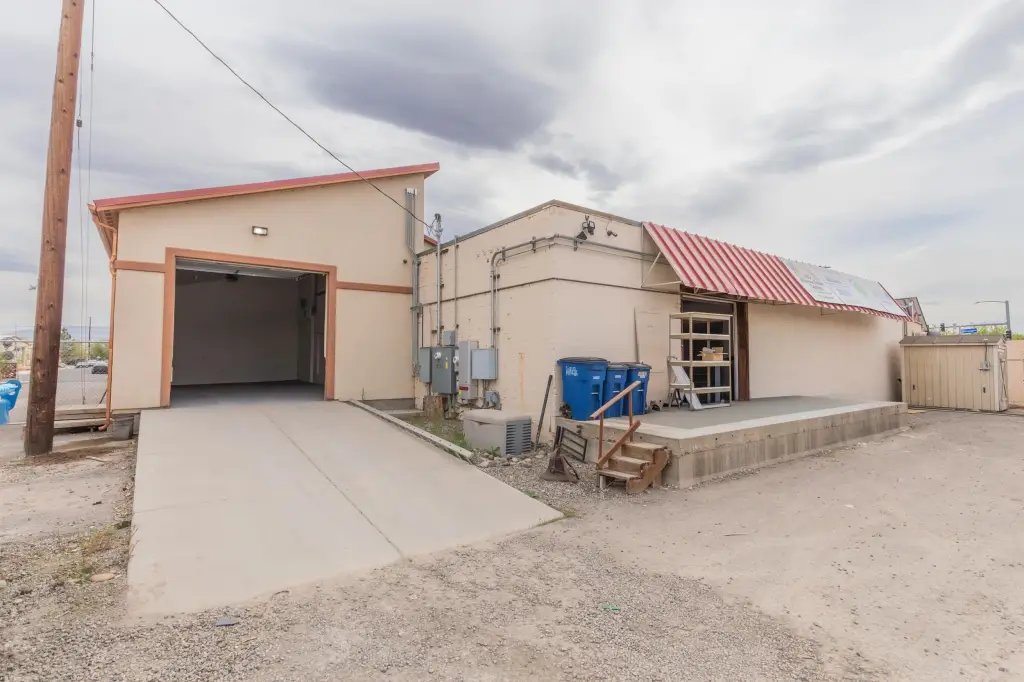
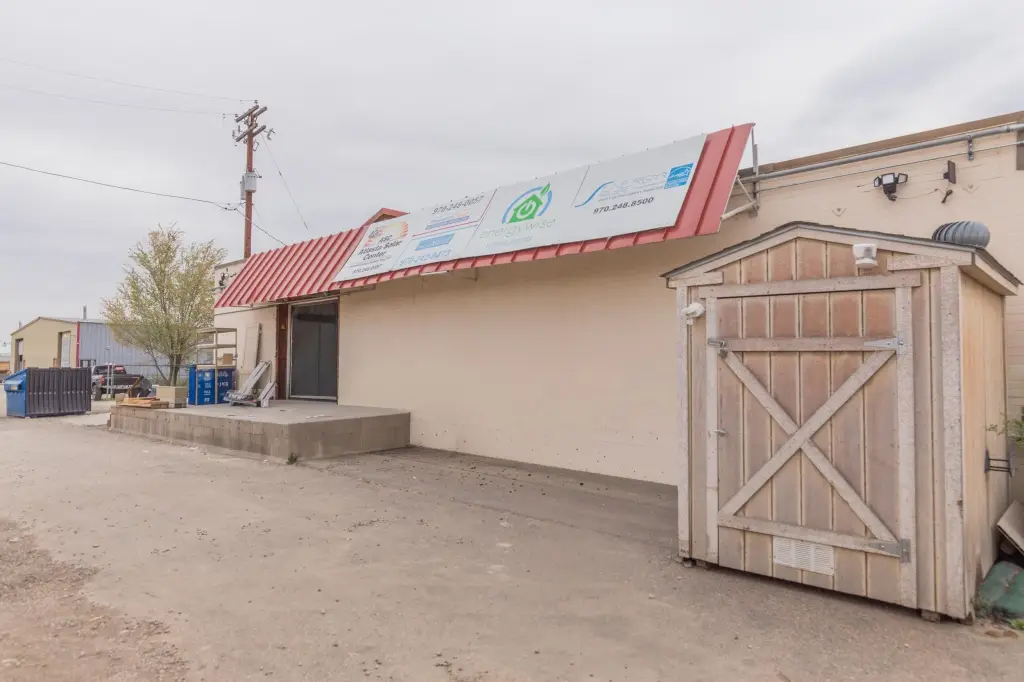
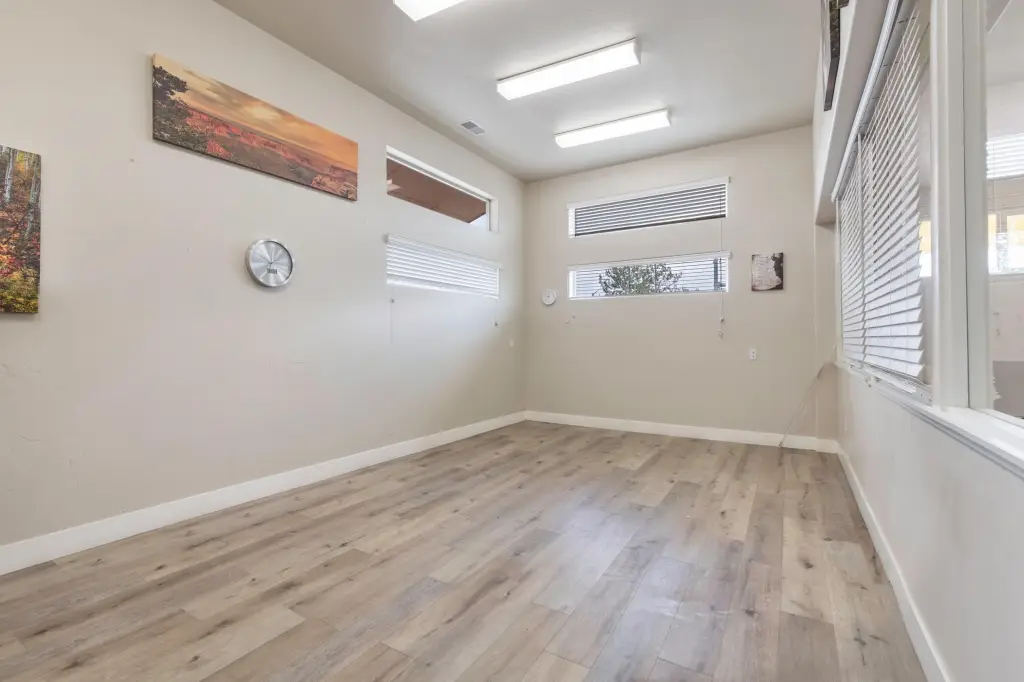
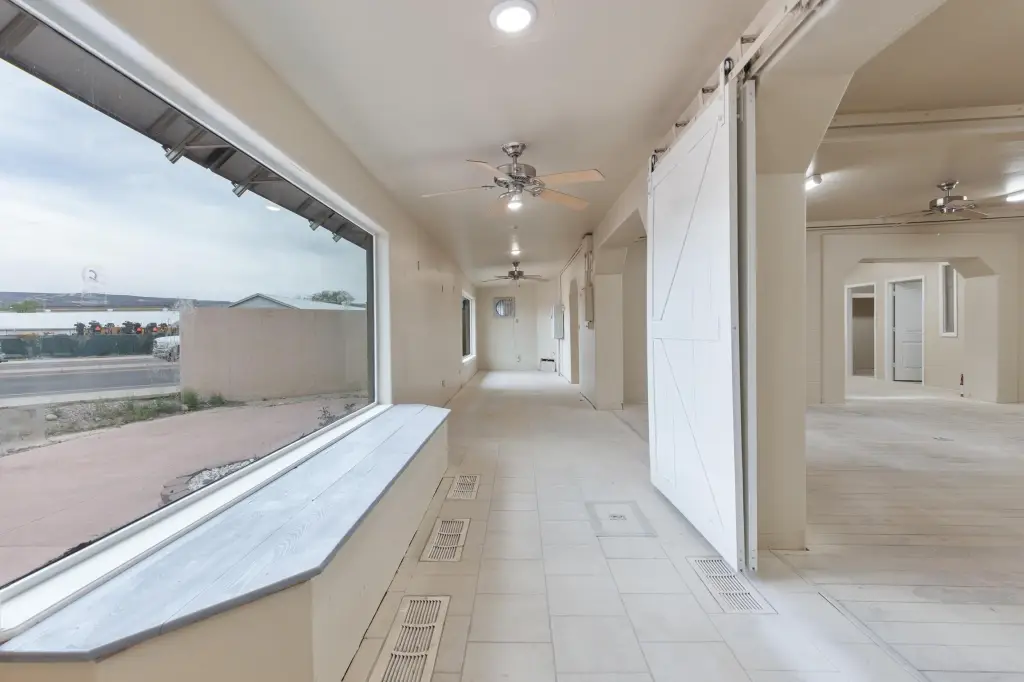
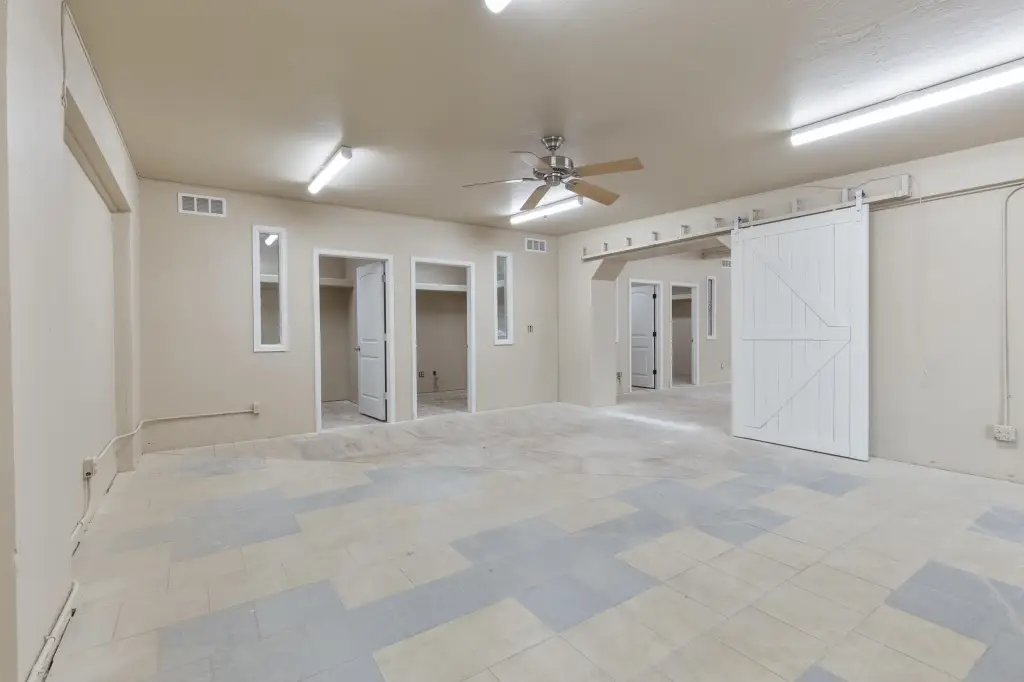
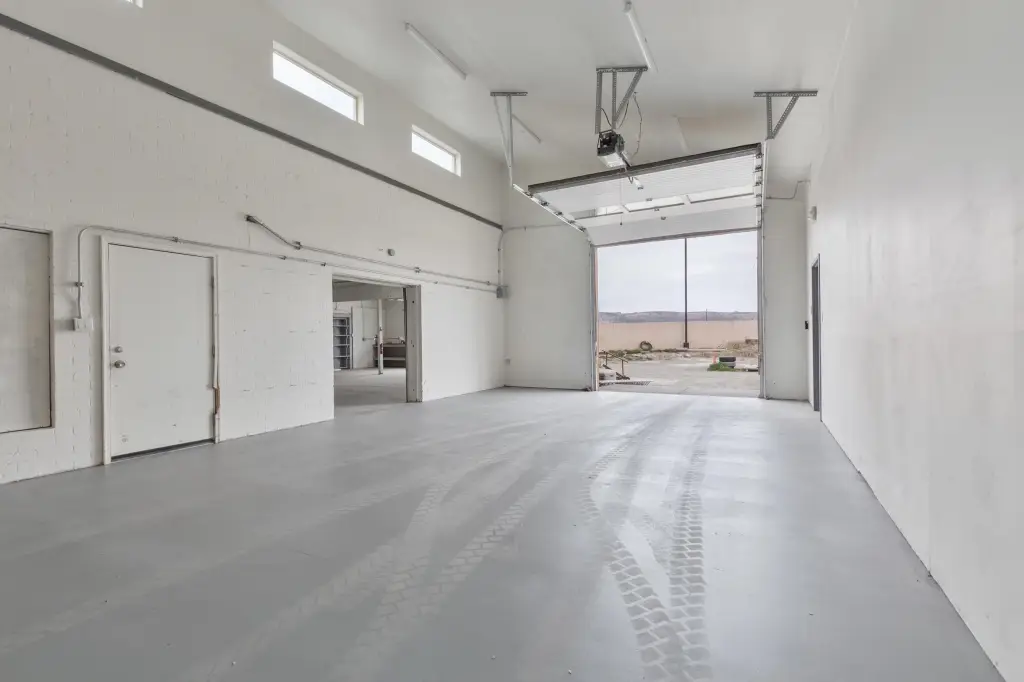
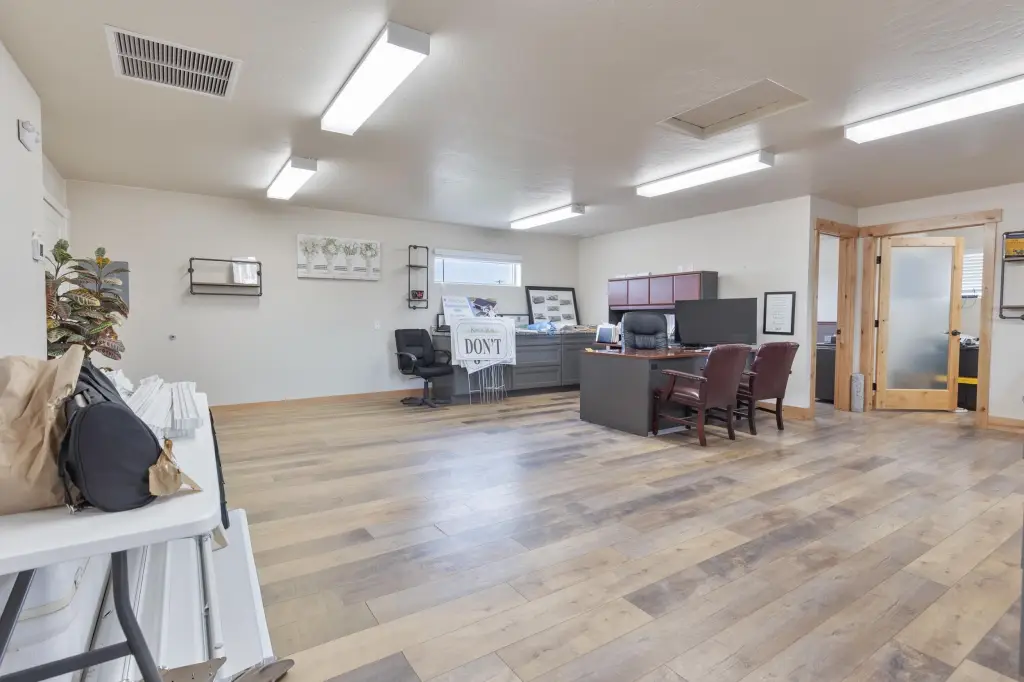
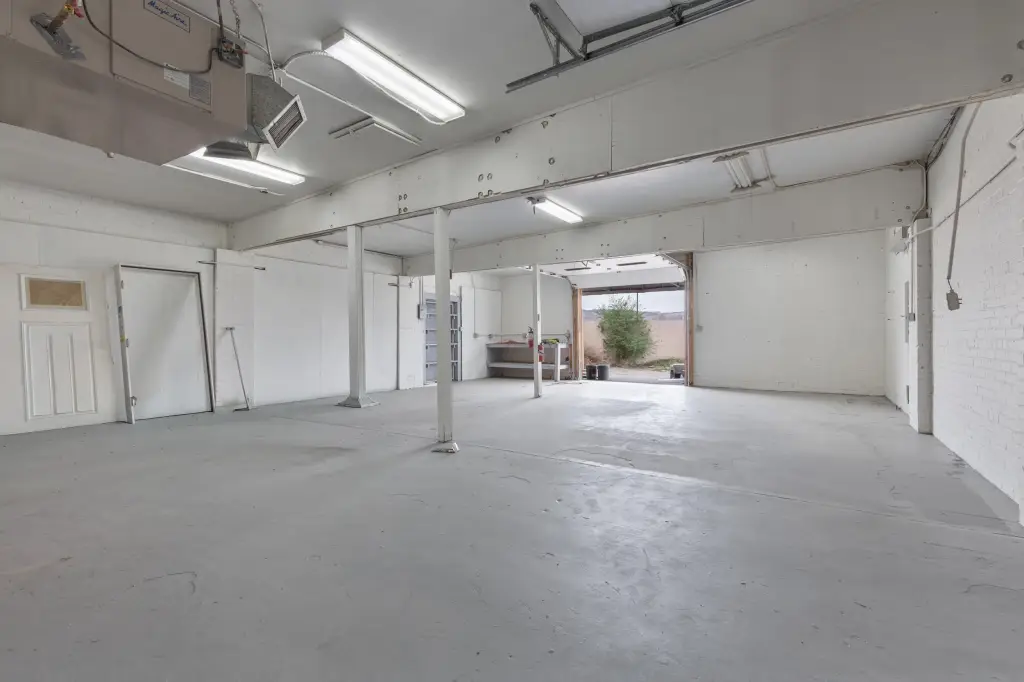
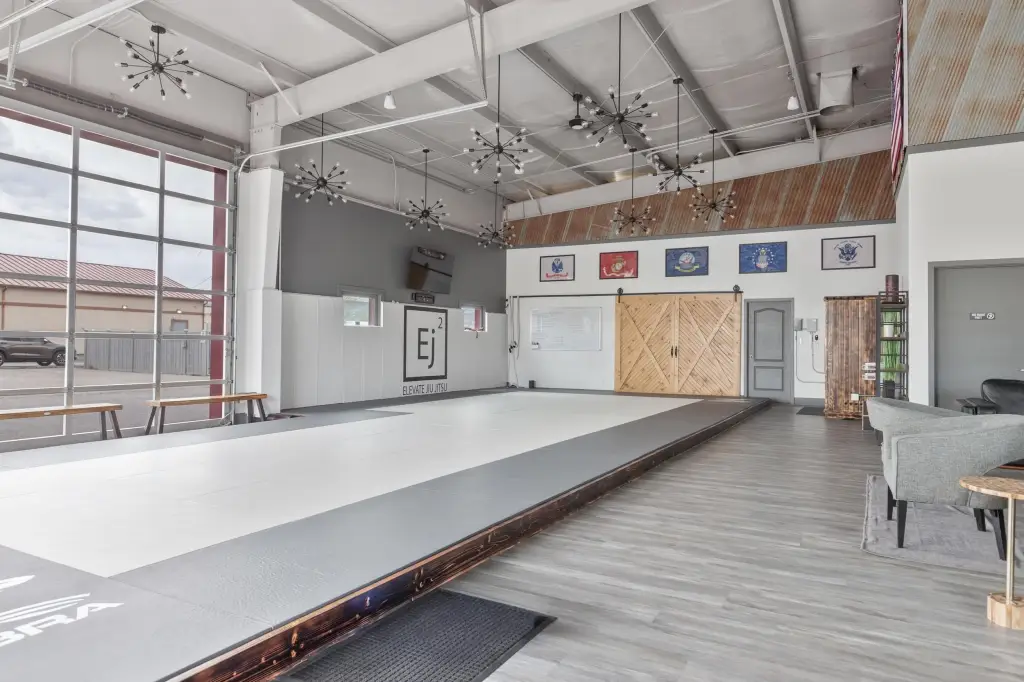
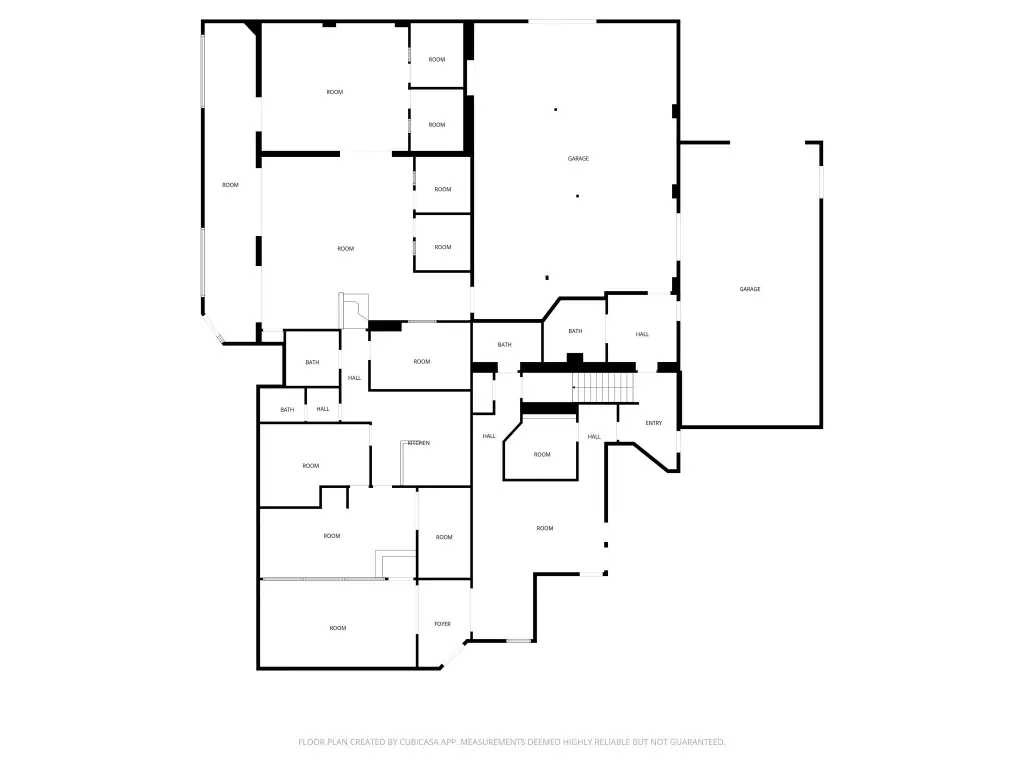
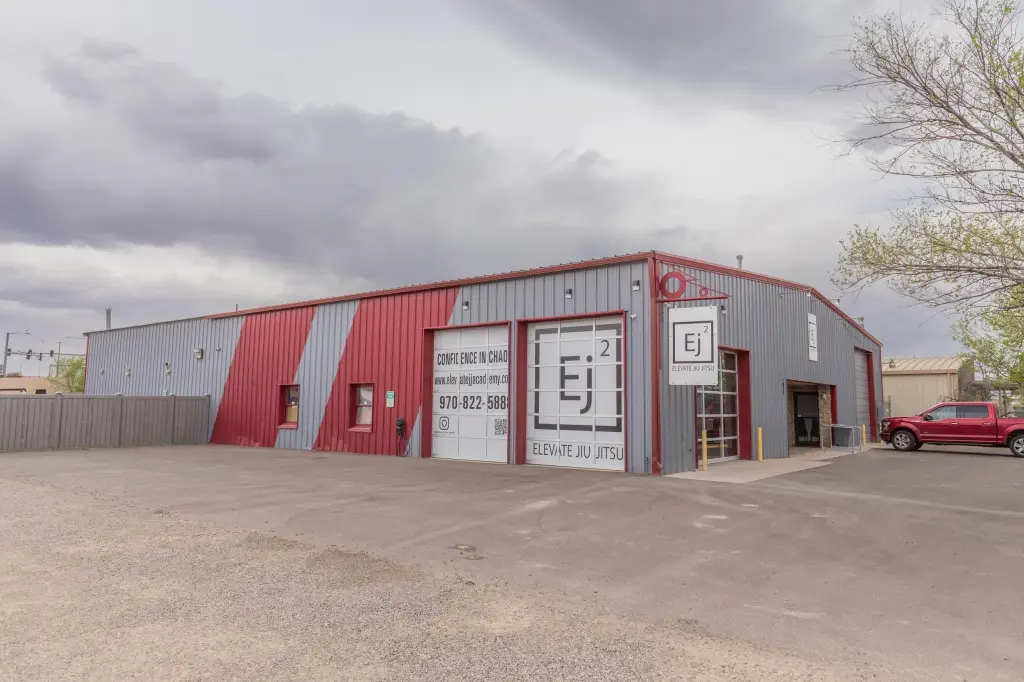
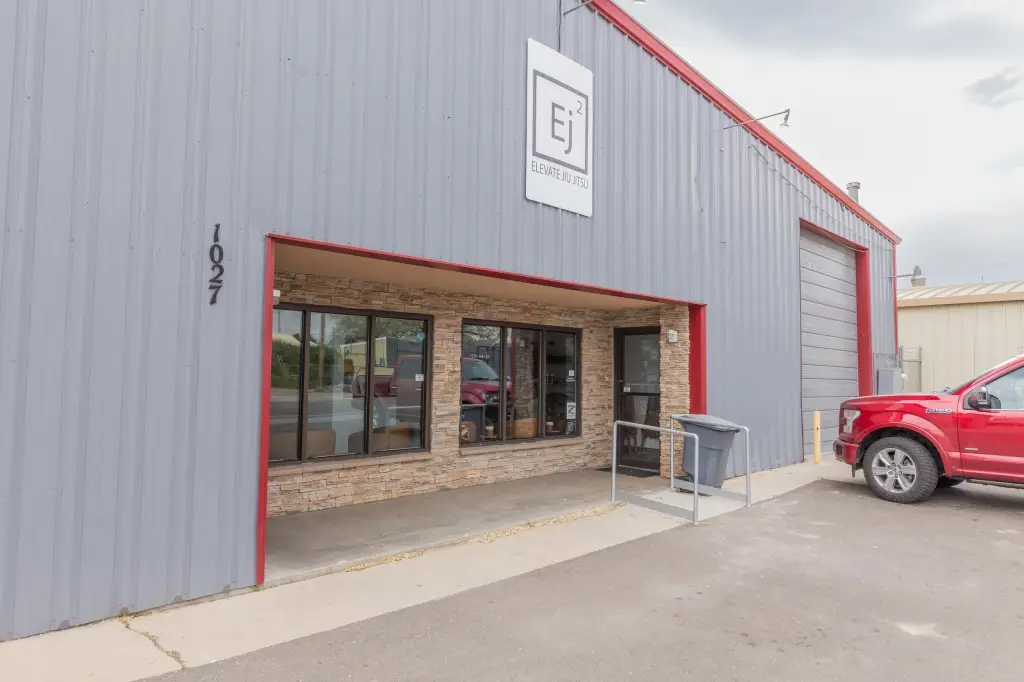
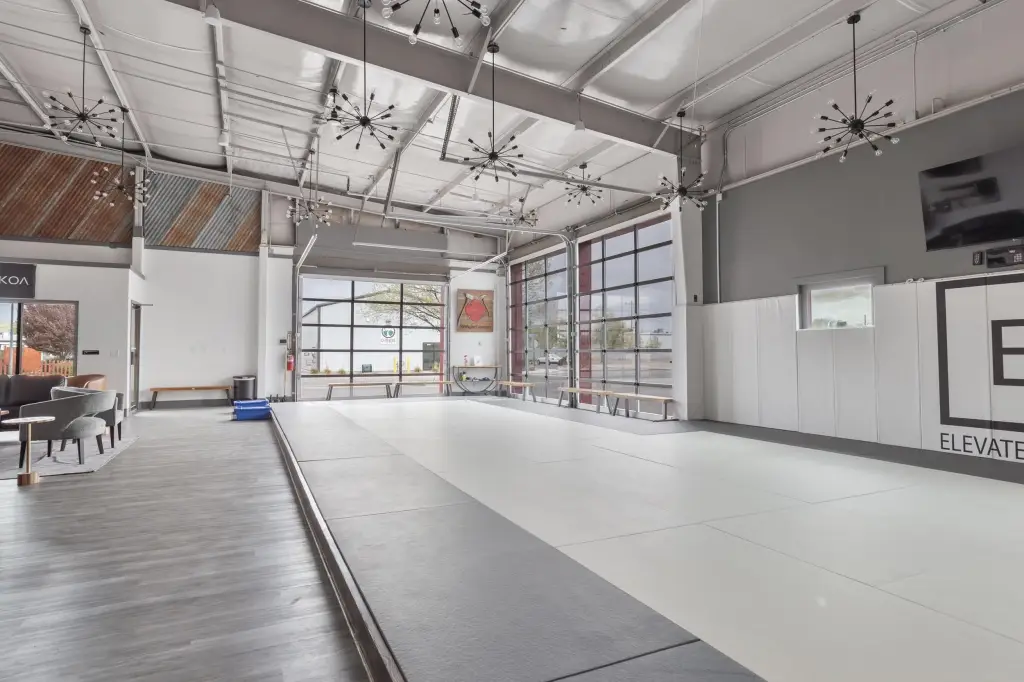
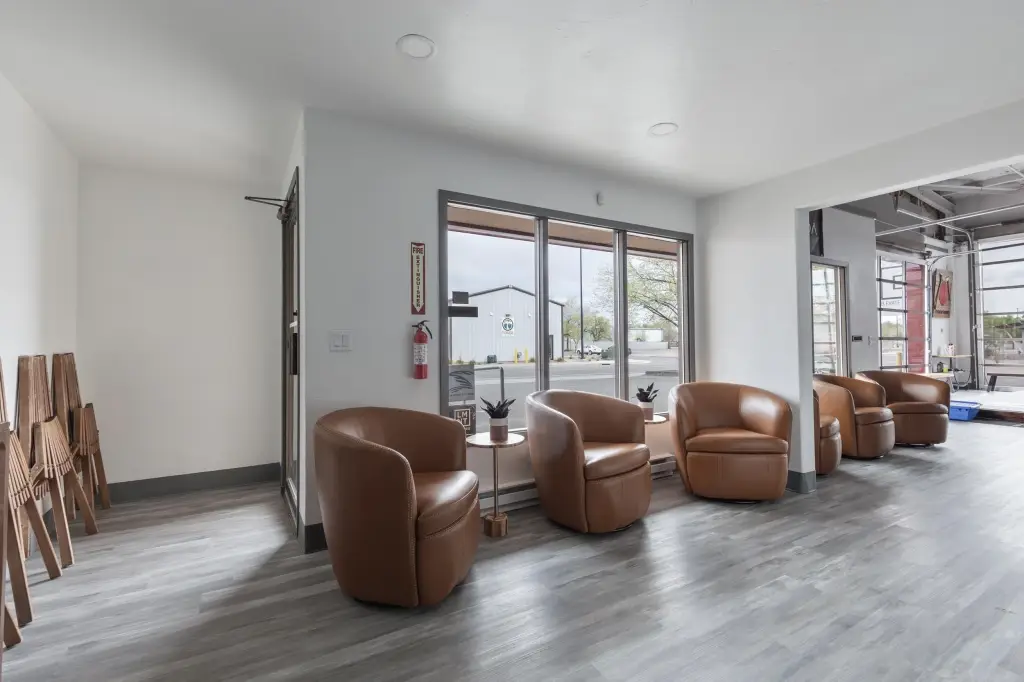
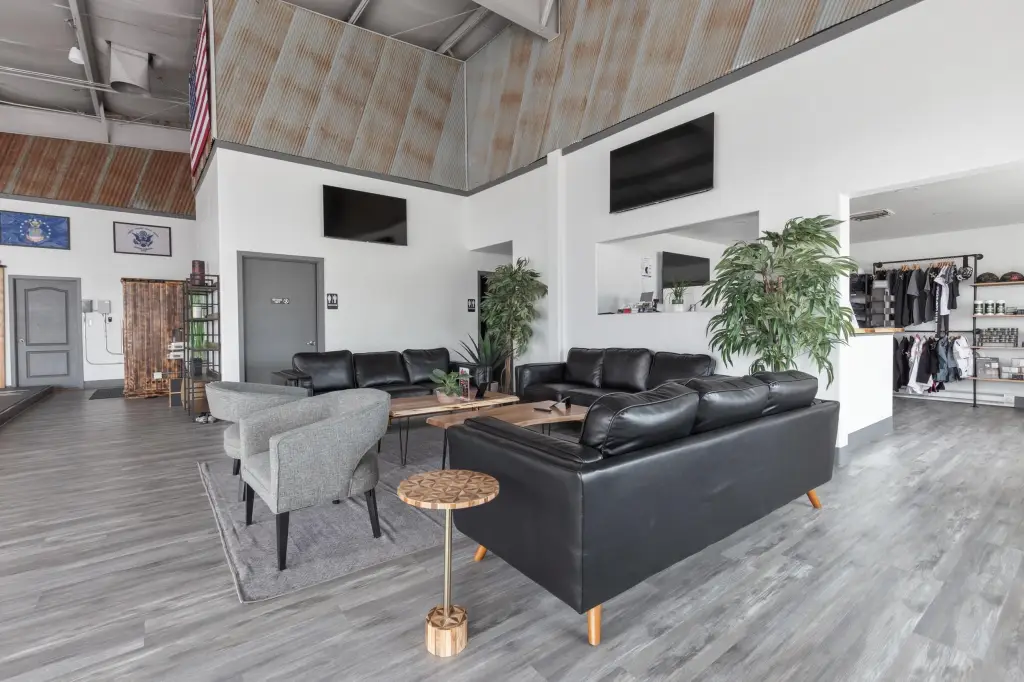
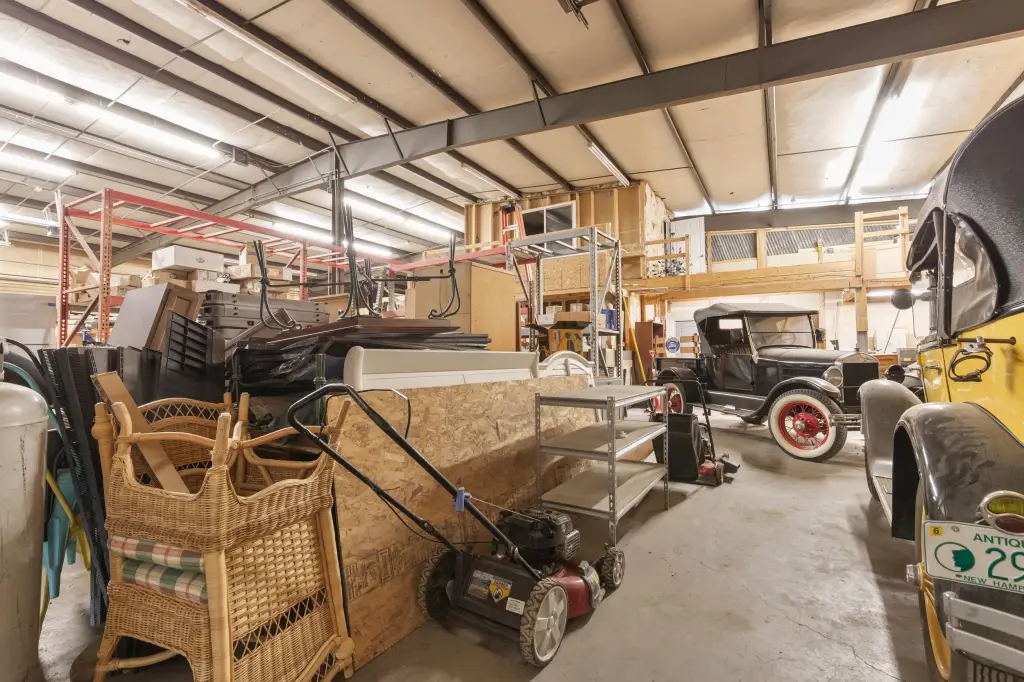
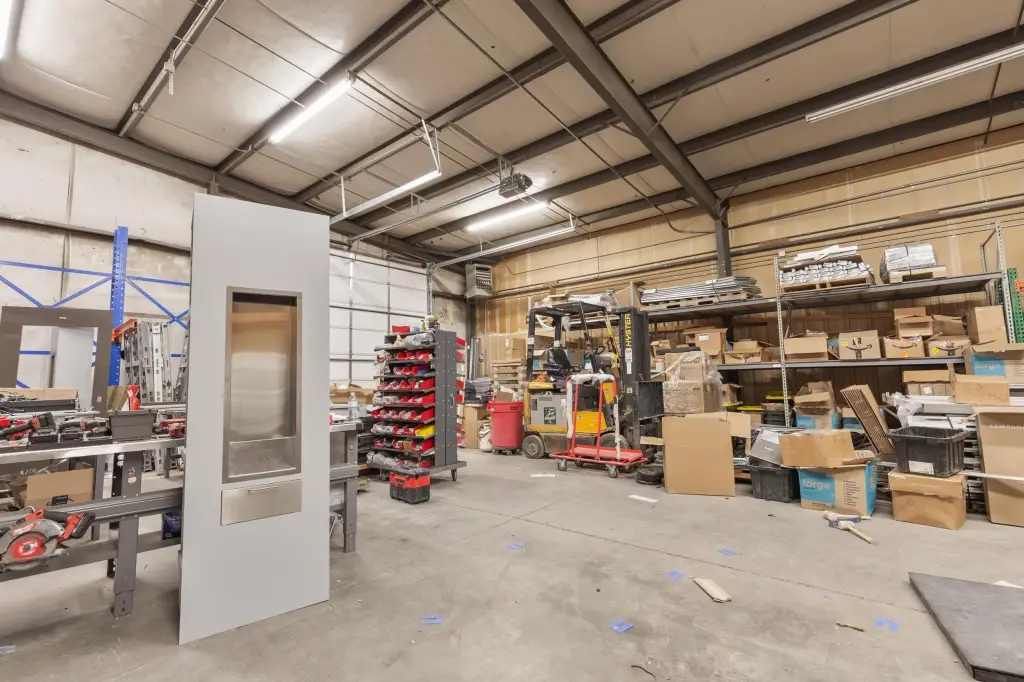
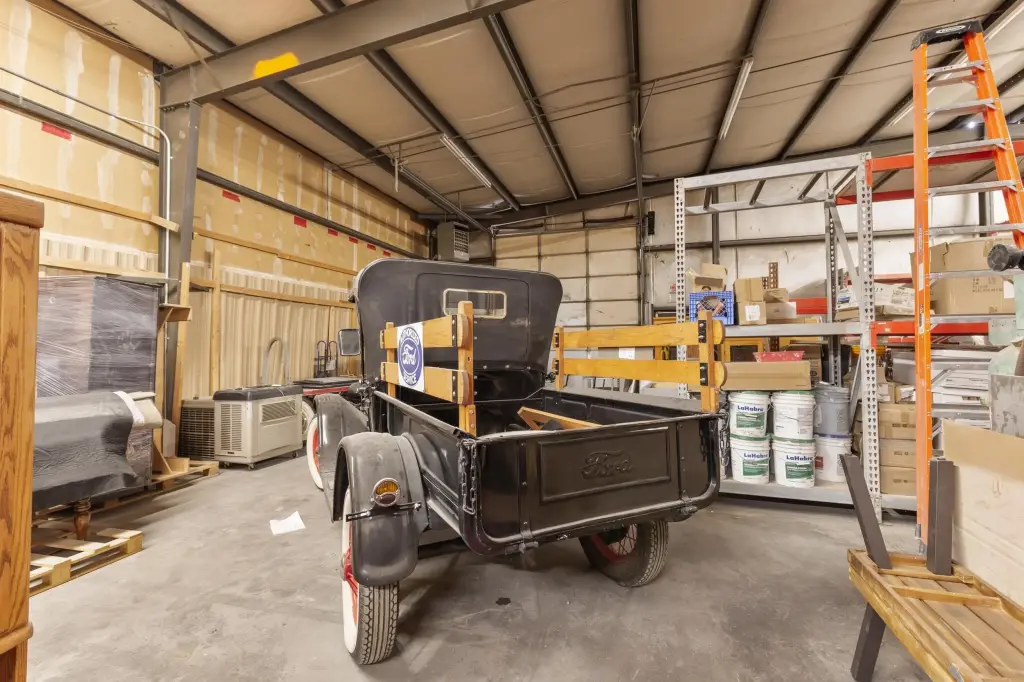
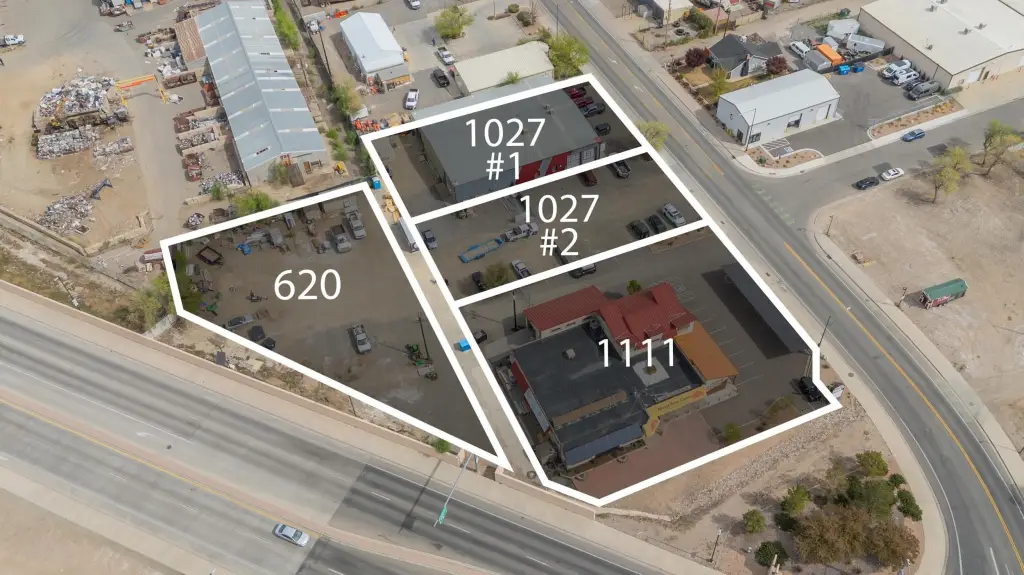
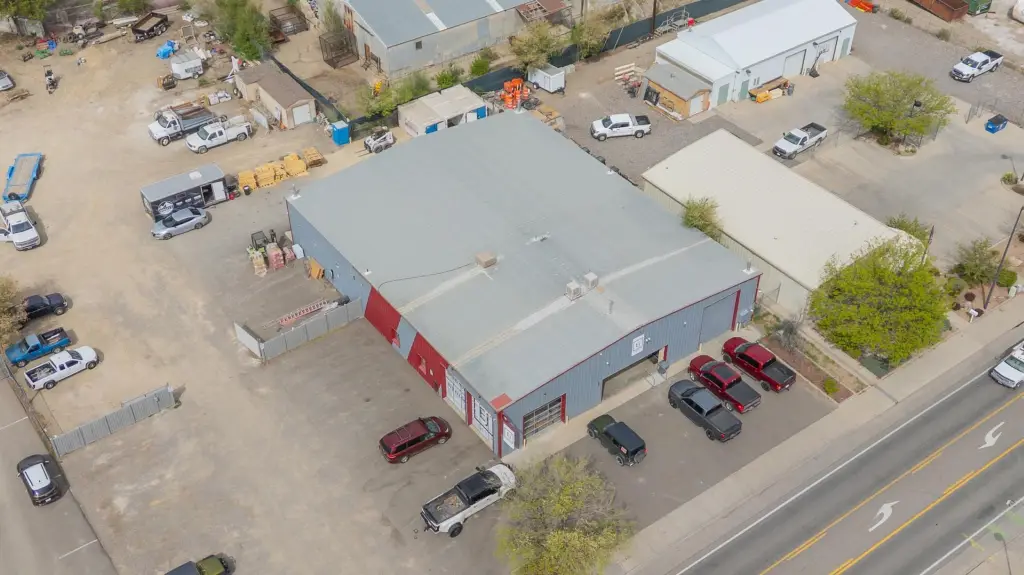
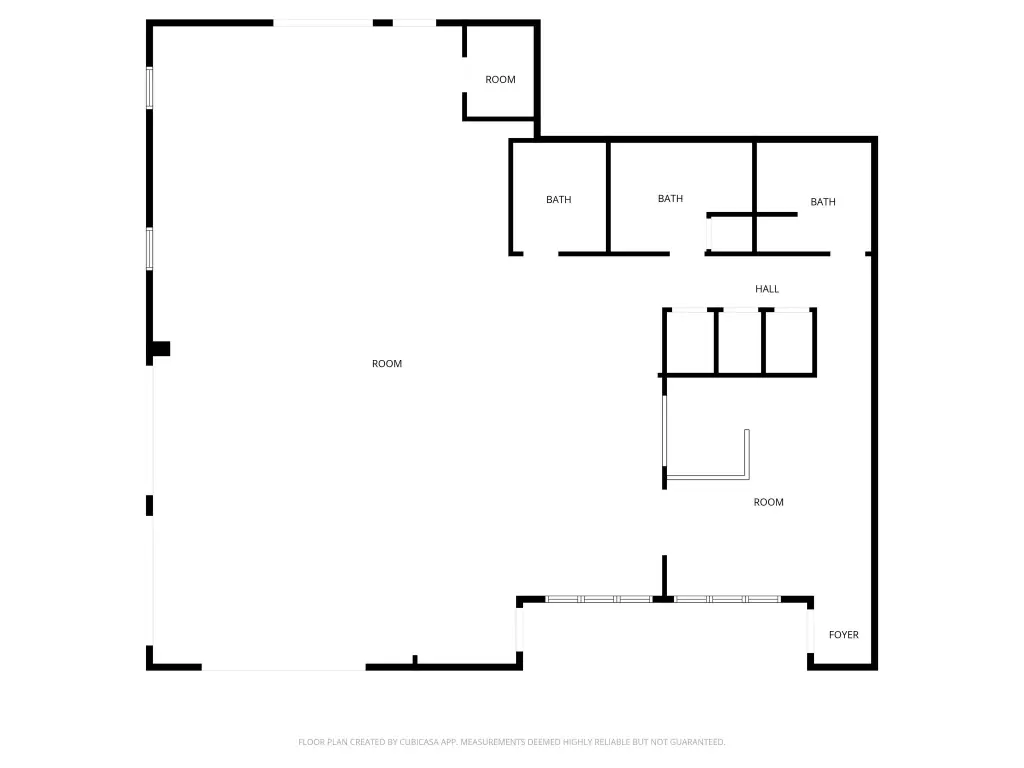
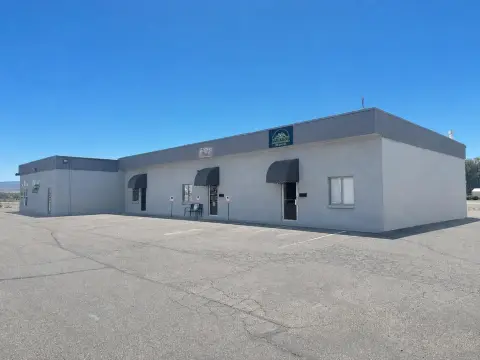
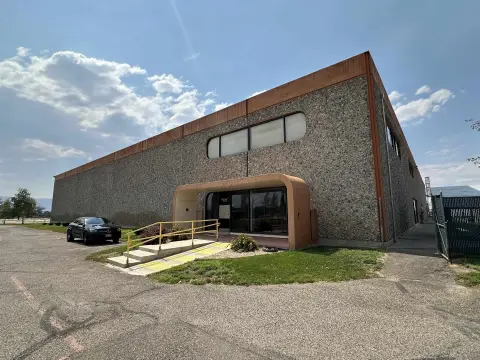
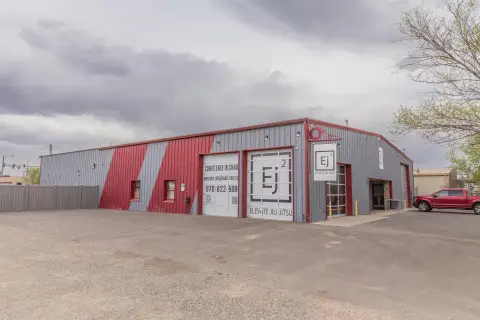
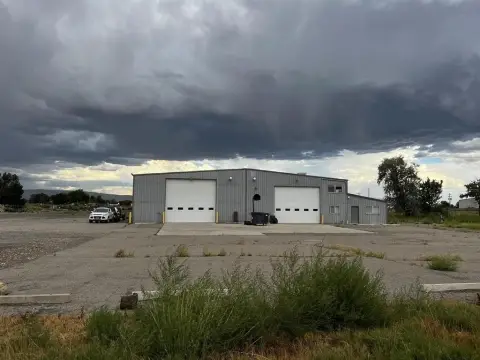
This flexible commercial offering combines three adjoining properties along South 7th Street. The 1027 S. 7th Street building contains 7,890 square feet, primarily configured for shop and warehouse use, with 2,905 square feet occupied by a jujitsu gym and approximately 5,000 square feet available for expansion. The property includes two parcels totaling 0.60 acres and may accommodate showroom, display, operational, or small garage-bay functions based on the stated layout.
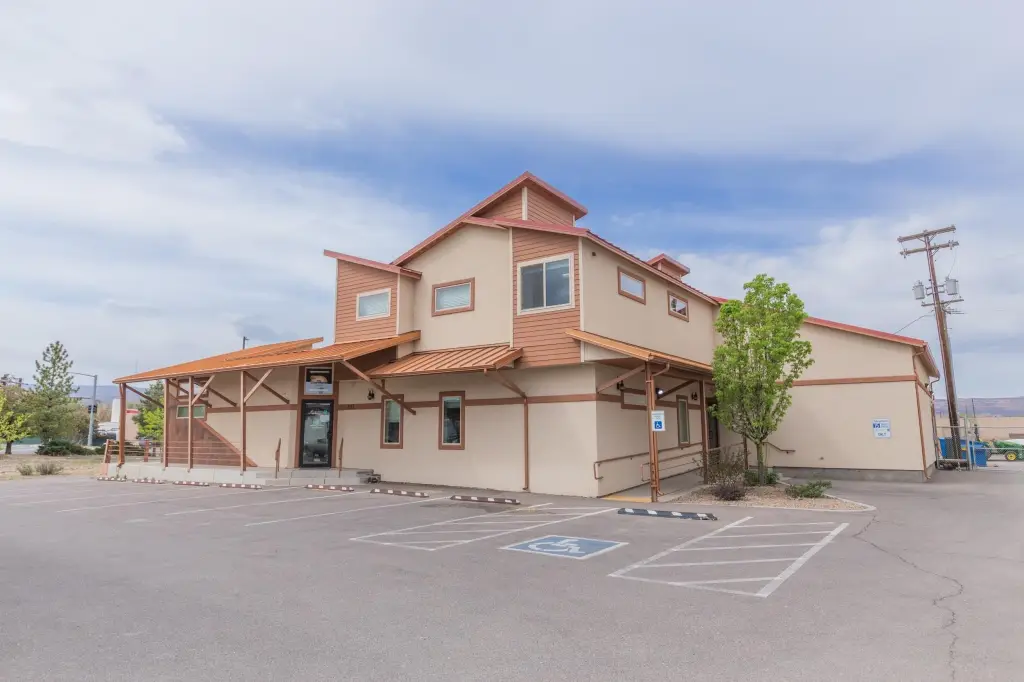
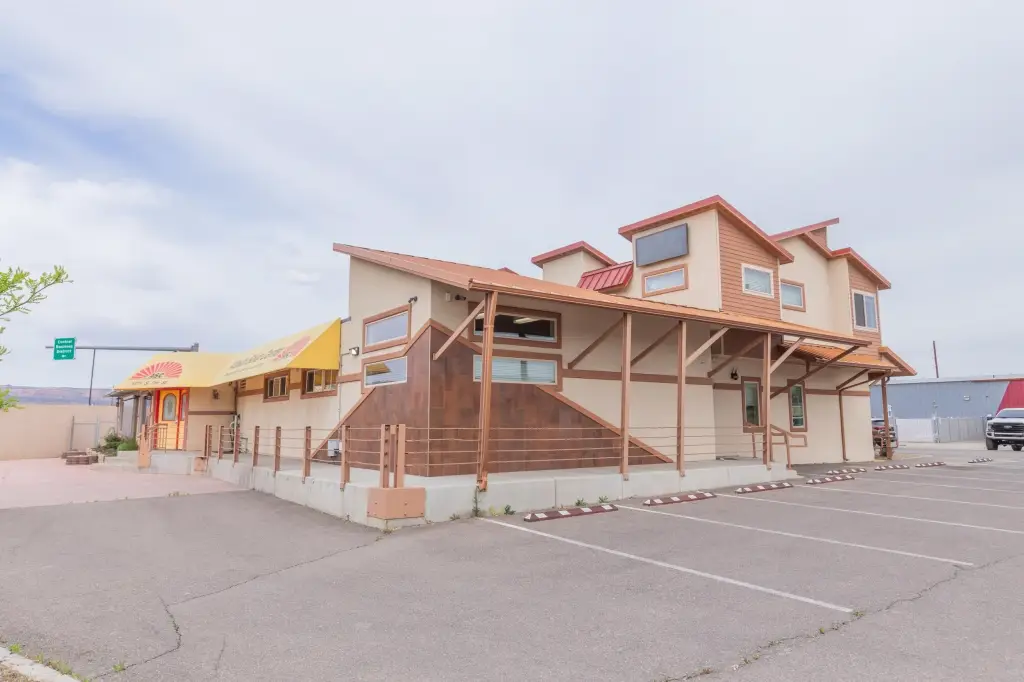
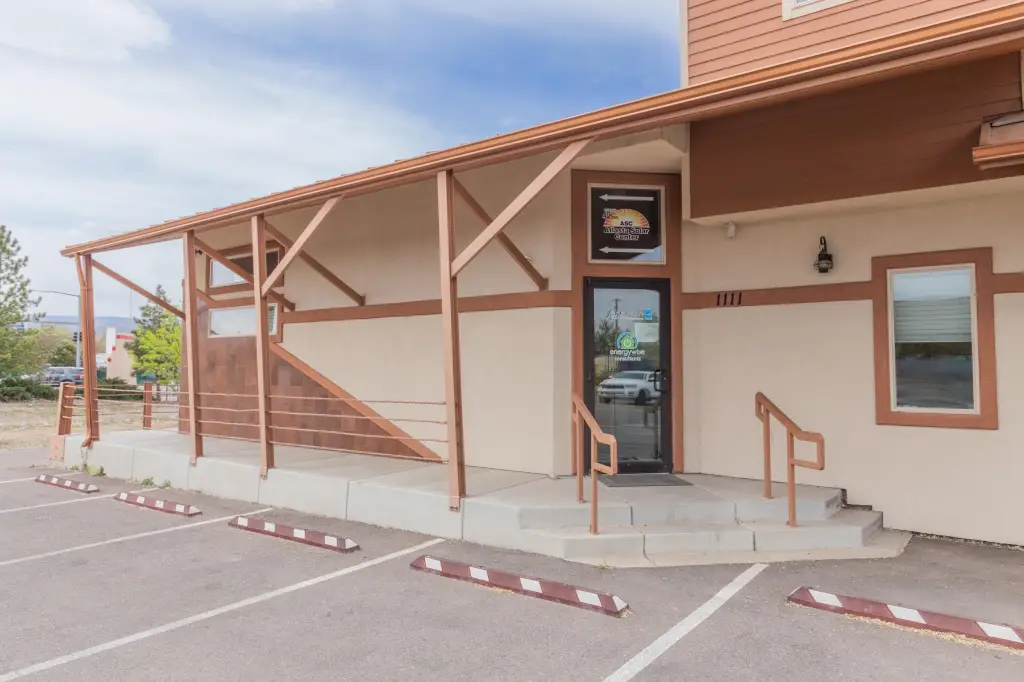
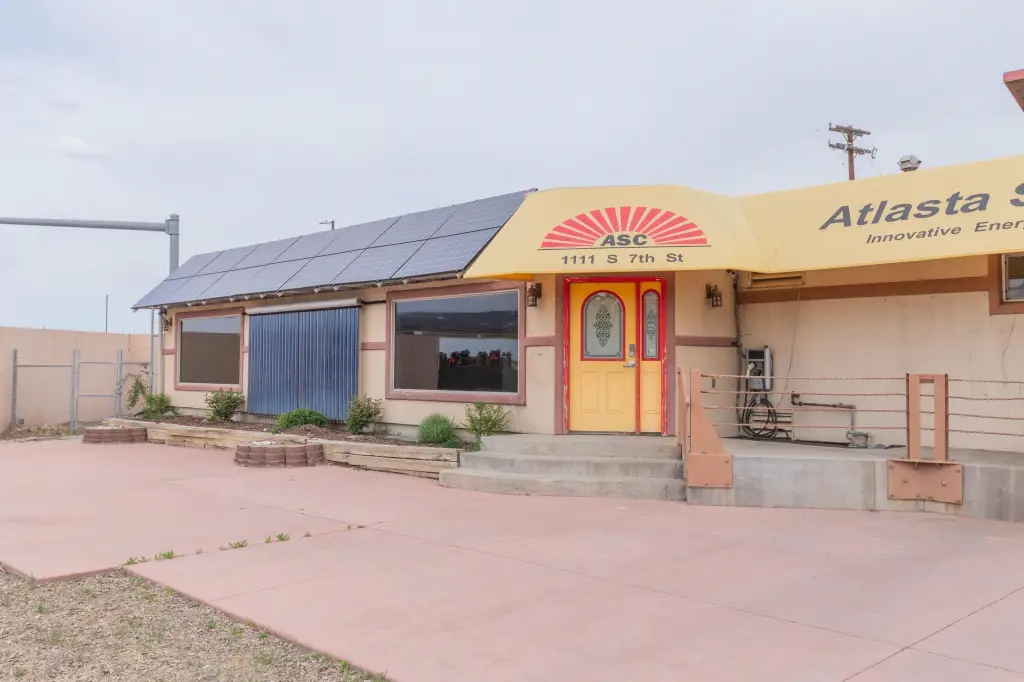
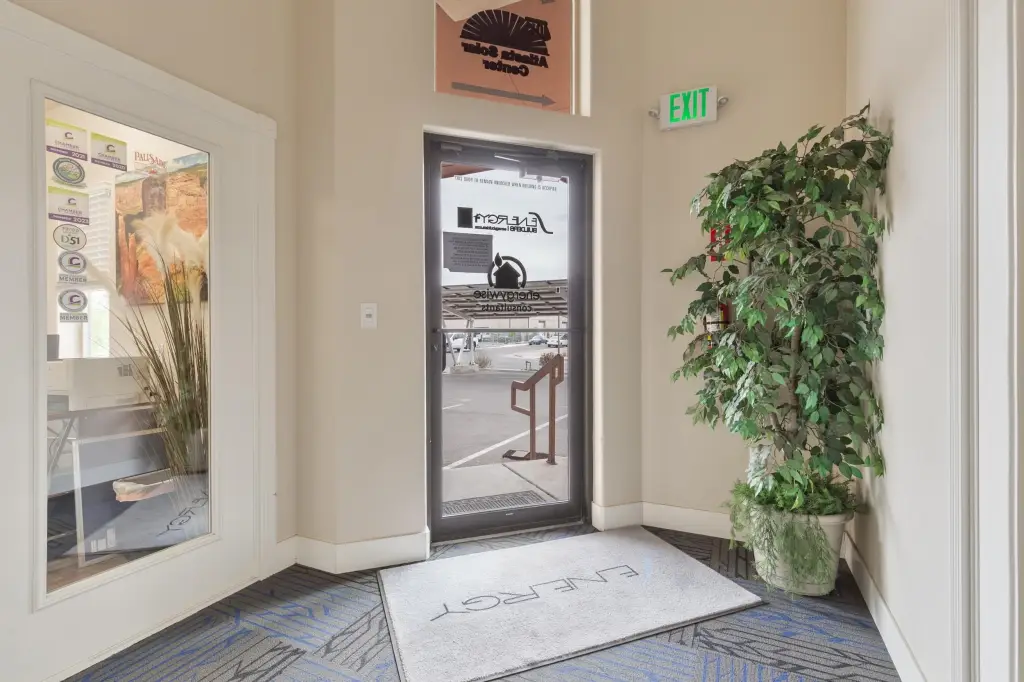
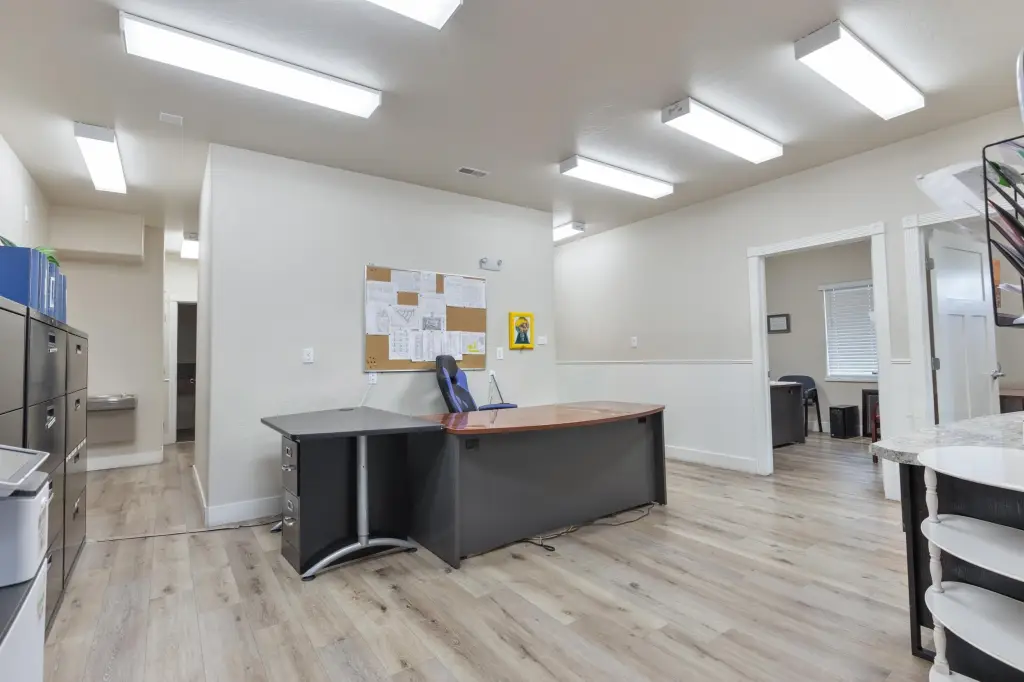
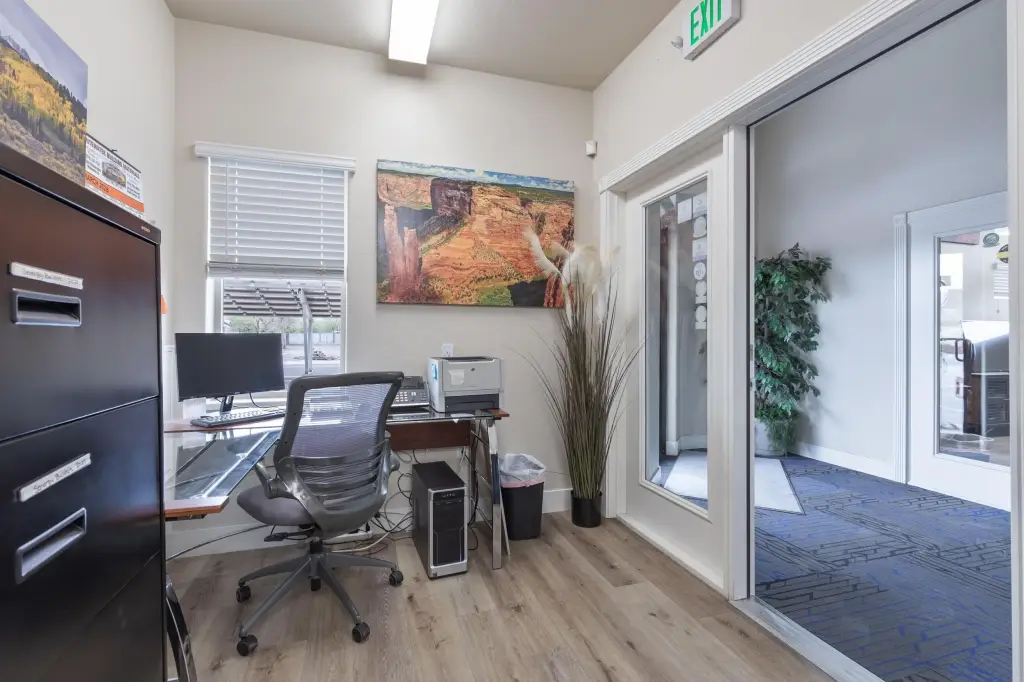
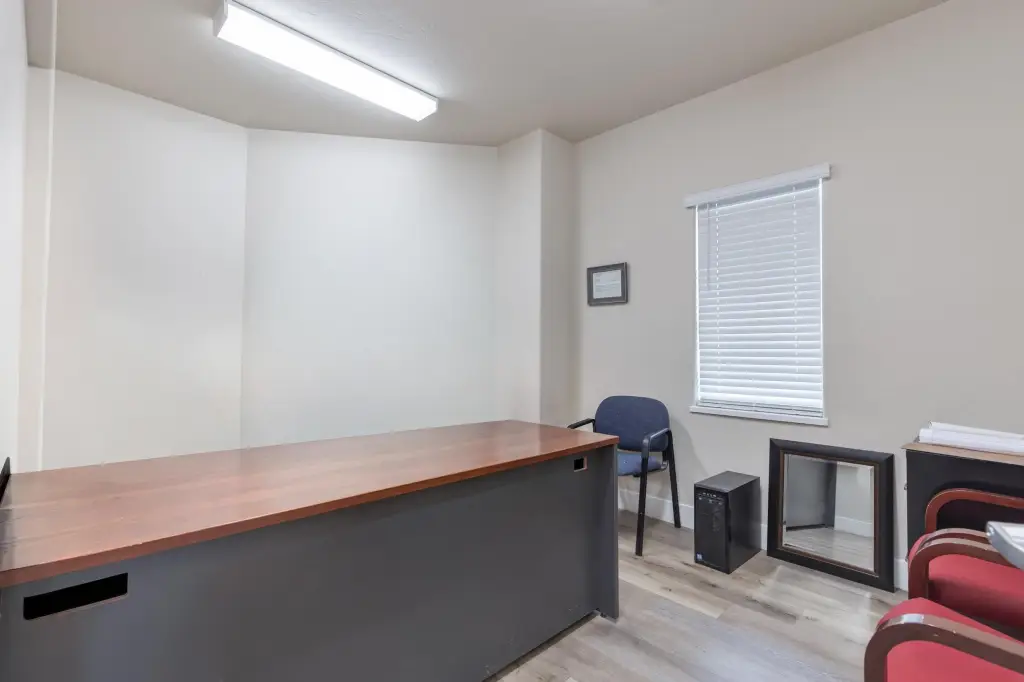
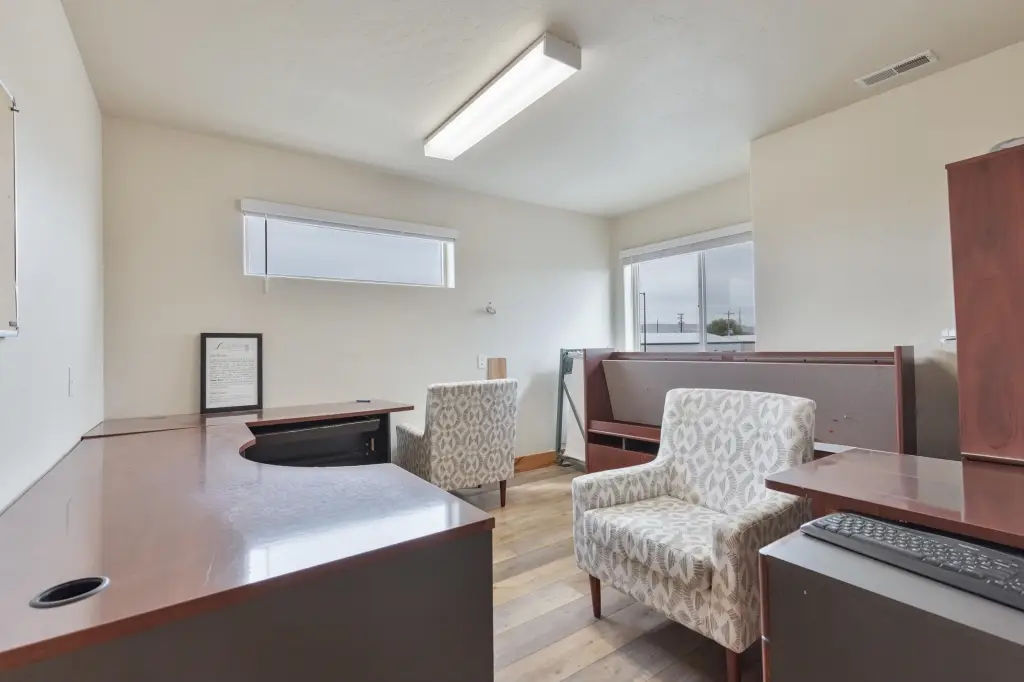
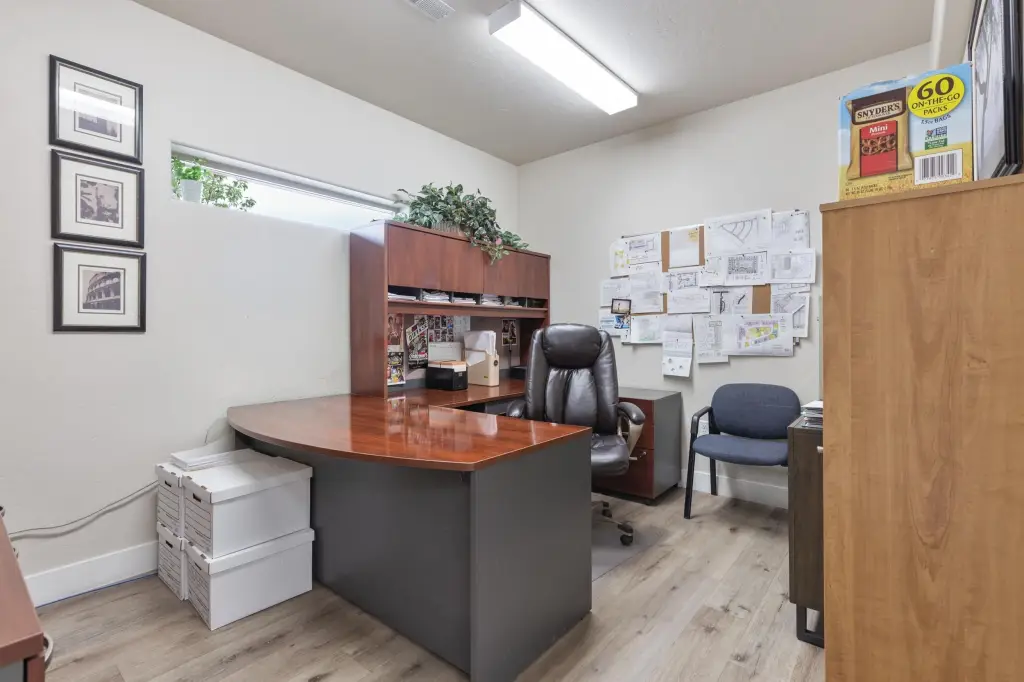
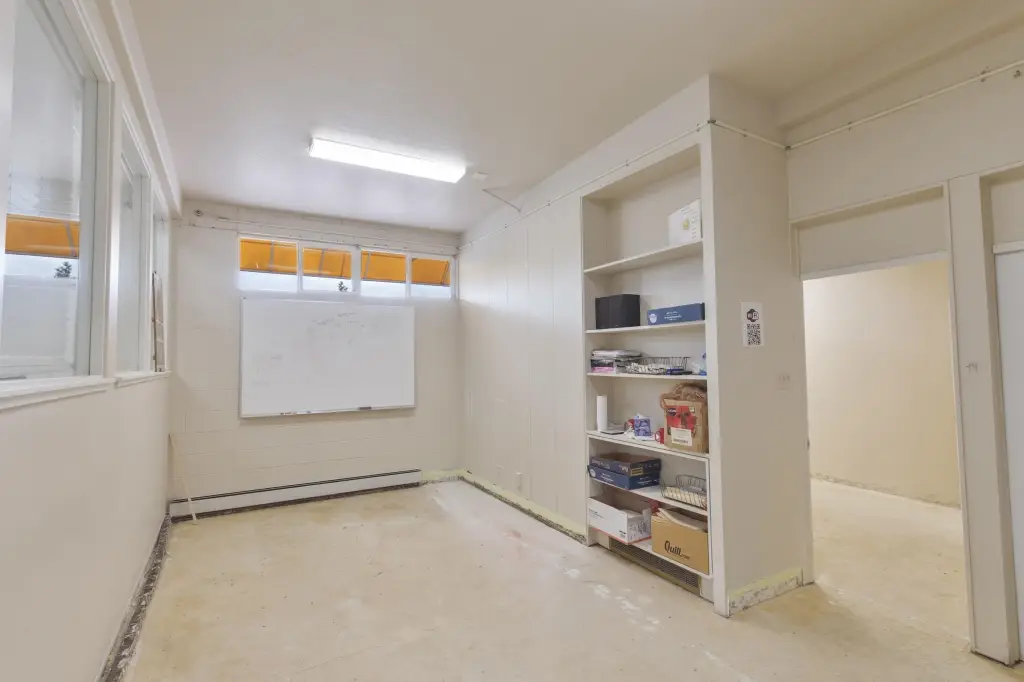
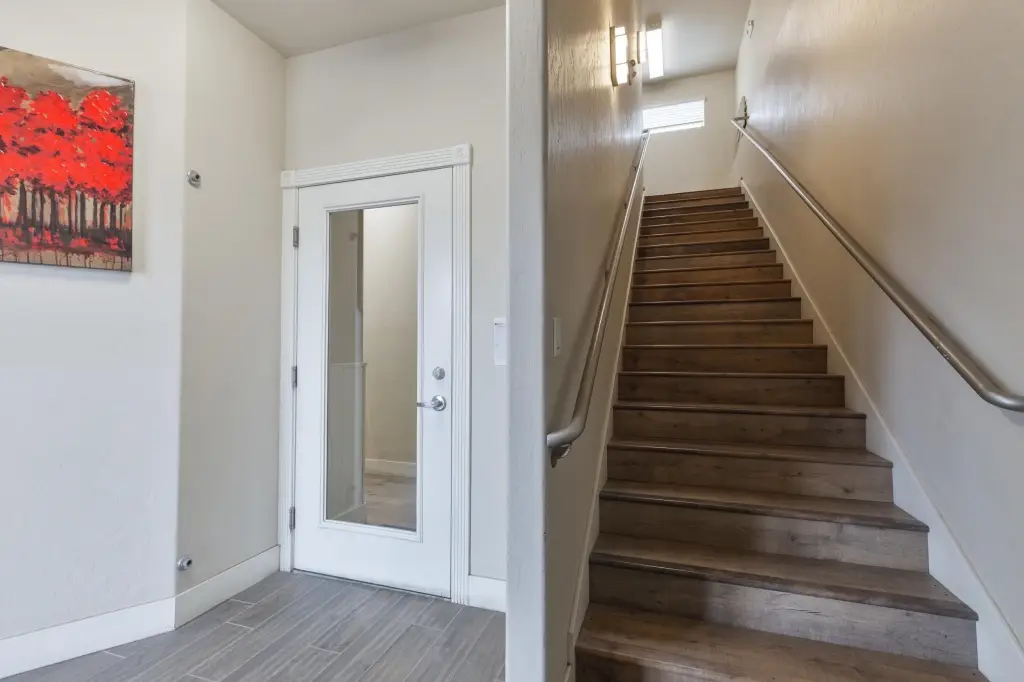
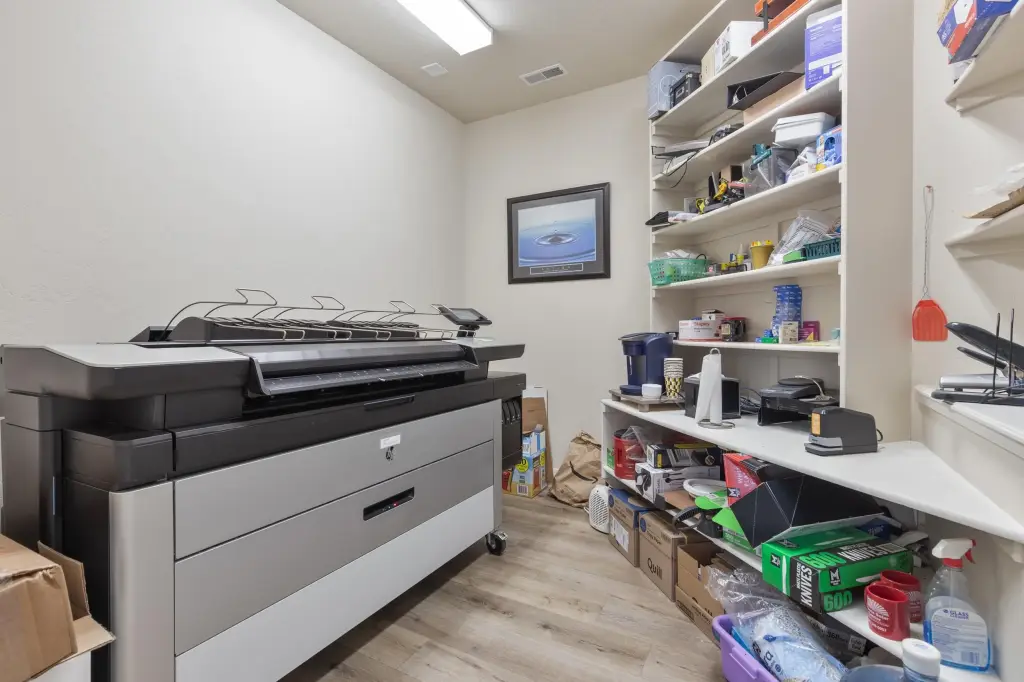
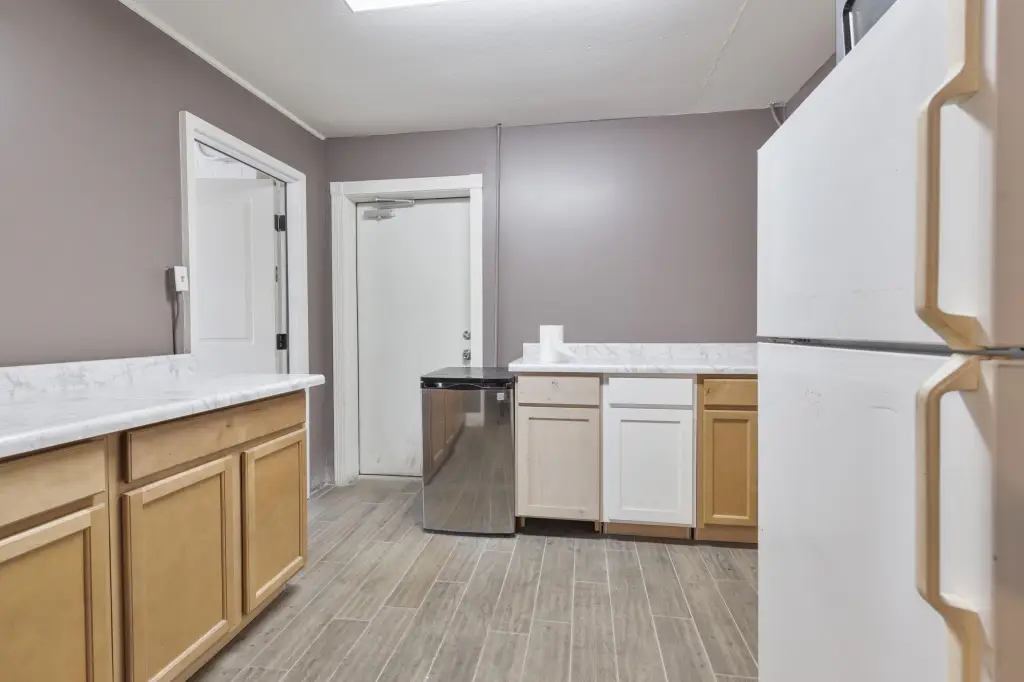
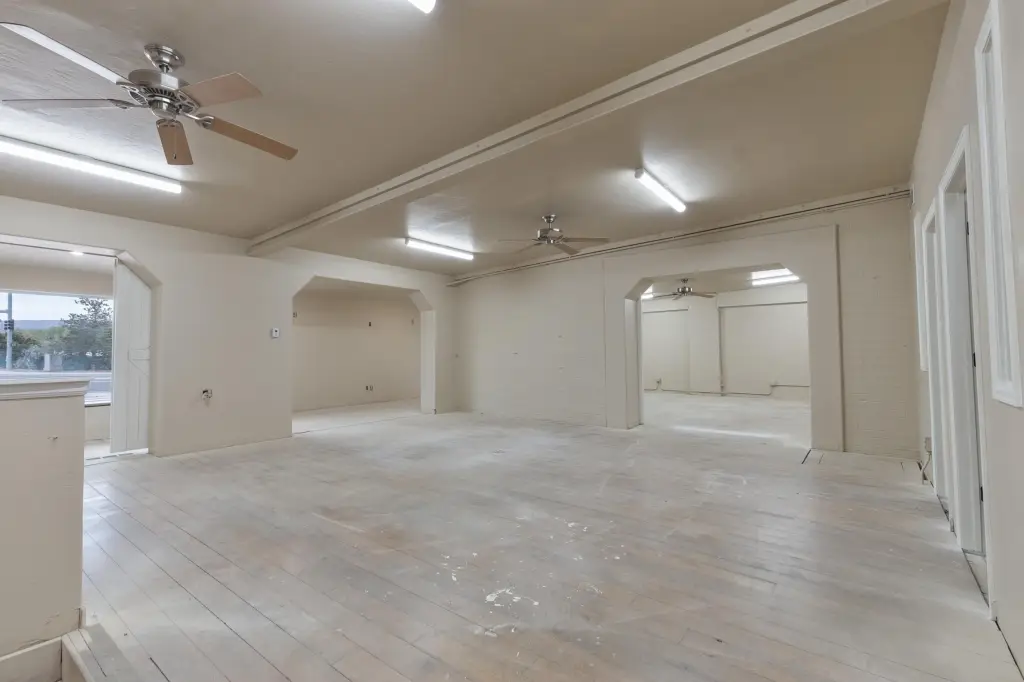
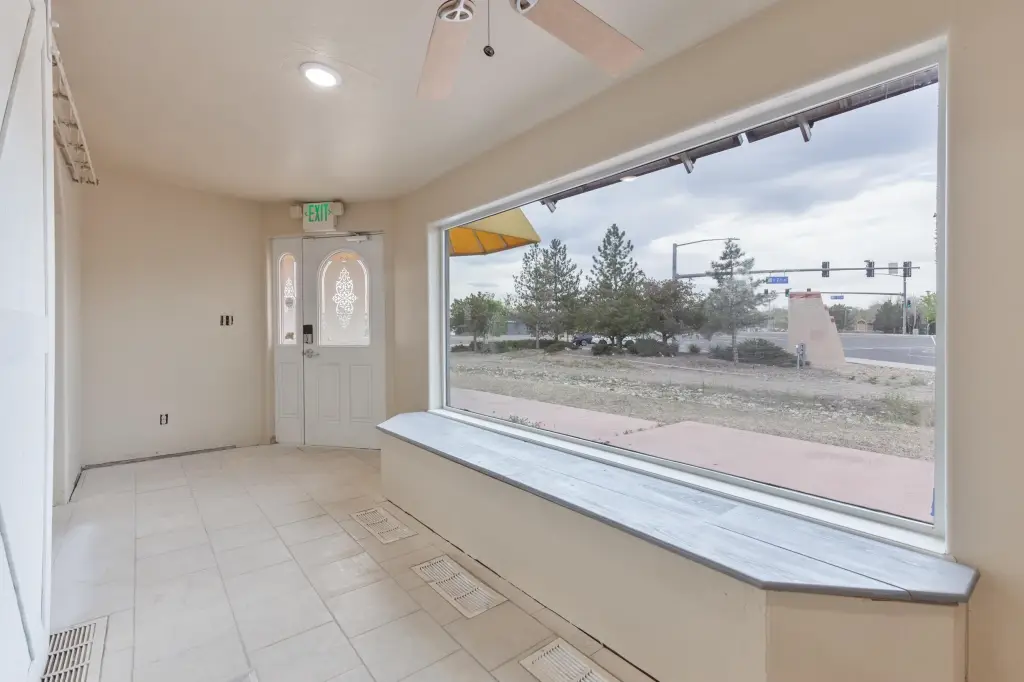
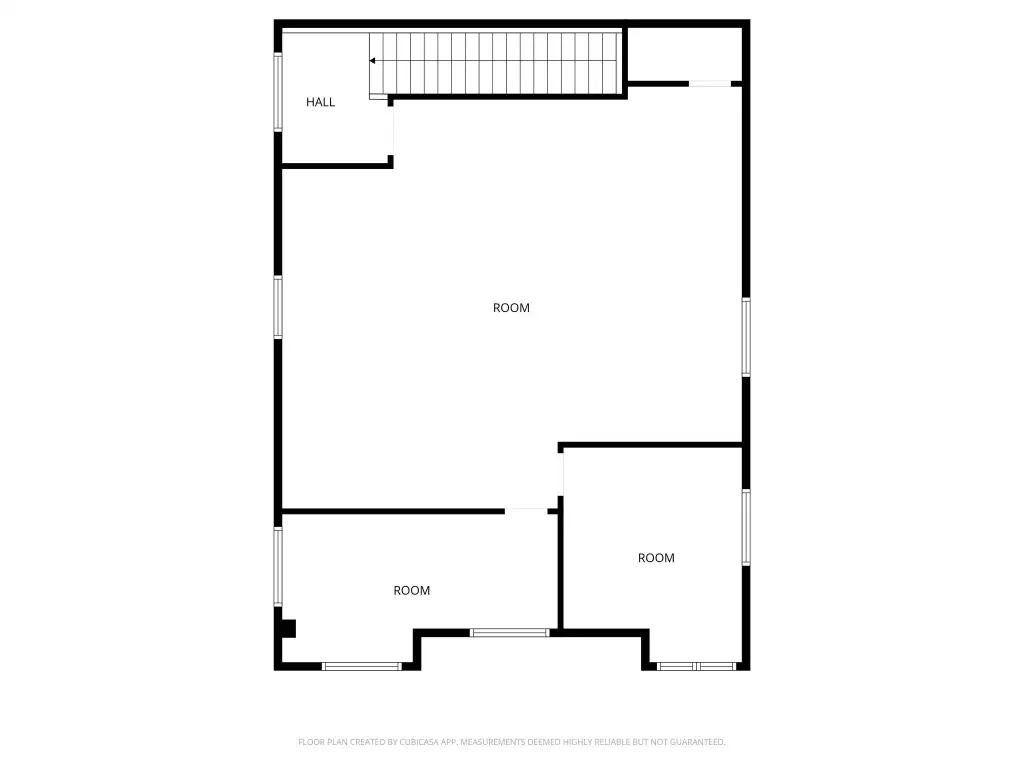
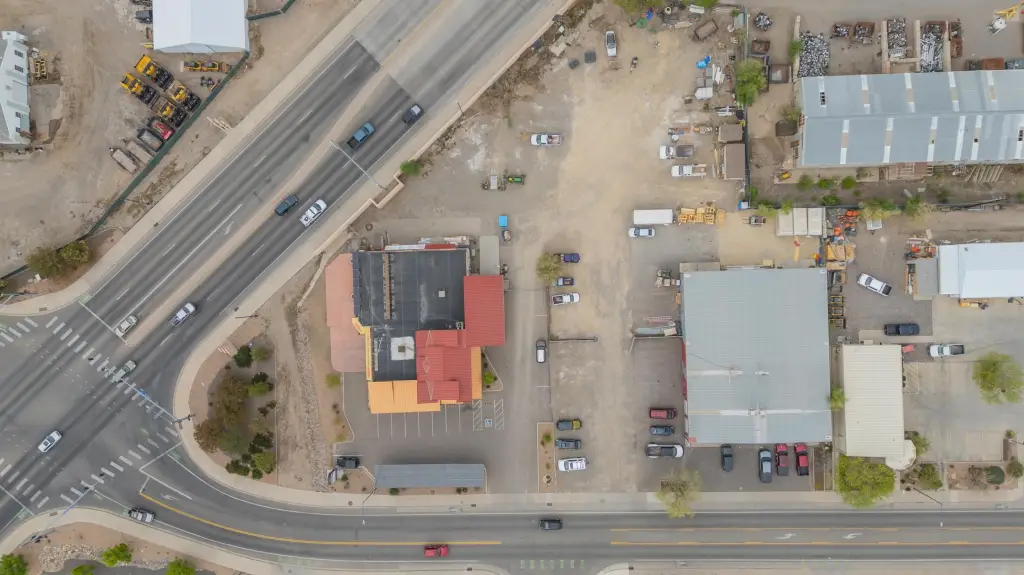
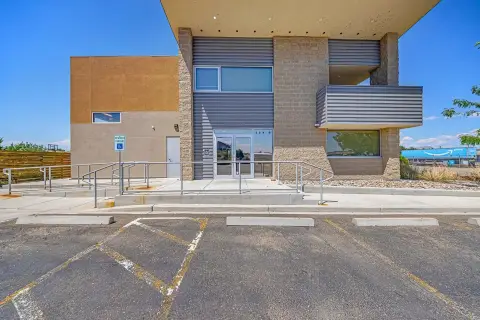
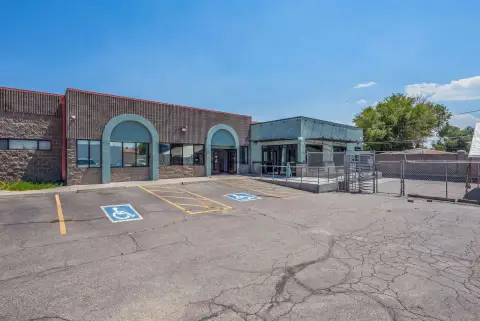
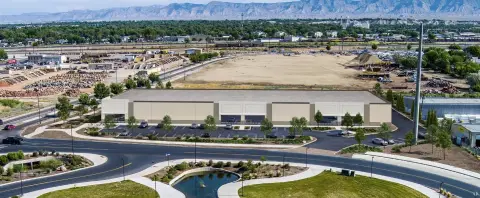
At 1111 S. 7th Street, a 7,673-square-foot light industrial and office building sits on a 0.48-acre lot. Constructed in 1958 and remodeled several times, the two-story structure includes 10 offices. The adjoining 620 Nolan parcel adds 0.44 acres of fenced storage or parking area, bringing those two lots to 0.92 acres. The properties are positioned north of Riverside Parkway and the Las Colonias development, within a corridor described as undergoing infrastructure and commercial redevelopment.
At 1111 S. 7th Street, a 7,673-square-foot light industrial and office building sits on a 0.48-acre lot. Constructed in 1958 and remodeled several times, the two-story structure includes 10 offices. The adjoining 620 Nolan parcel adds 0.44 acres of fenced storage or parking area, bringing those two lots to 0.92 acres. The properties are positioned north of Riverside Parkway and the Las Colonias development, within a corridor described as undergoing infrastructure and commercial redevelopment.
Key Highlights
- 7,890‑square‑foot shop and warehouse building at 1027 S. 7th Street
- 2,905 square feet occupied by a jujitsu gym, with approximately 5,000 square feet for expansion
- 7,673‑square‑foot, two‑story light industrial and office building at 1111 S. 7th Street
Financial Insights
Estimated NOI and Cap Rate
NOI / Yr
$162,376
Cap Rate
5.24%
Suggested Prices Based on Cap Rates
Cap Rate 5%
$3,247,520
$3.2M
Cap Rate 7%
$2,319,657
$2.3M
Cap Rate 9%
$1,804,178
$1.8M
Market Conditions
NOI Build-Up for 15,563 SF
Gross rent
$270.8K $17.40/SF
− Vacancy
−$21.0K −$1.35/SF
EGI
$249.8K $16.05/SF
− OpEx
−$87.4K −$5.62/SF
NOI
$162.4K $10.43/SF
Area
Mesa County, CO
Vacancy
7.75%
Lease Rate
$17.40 /SF/Yr
Expense Ratio
35.00%
Simulate Cap Rate and NOI
Suggested Prices Based on Cap Rates
Cap Rate 5%
$3,247,520
Cap Rate 7%
$2,319,657
Cap Rate 9%
$1,804,178
Alternative Uses
Best Use
Flex RnD
$2.32M
$2.03M – $2.71M
NOI $162,376 @ 7.0% cap · market cap 5.24%
Second Best
Office B
$2.10M
$1.84M – $2.45M
NOI $147,070 @ 7.0% cap · market cap 4.74%
Theoretical Best
Healthcare Medical
$29.53M
$25.84M – $34.46M
NOI $2,067,389 @ 7.0% cap · market cap 66.69%
Zoning and permitted uses should be independently verified with authorities.
Property Analytics
Unlock full access to Insights
Subscribe to Realmo Intelligence
Open Analytics
Current Use
Lease Details
Yes
Fenced yard
Yes
Paved road access
Location Intelligence
Trade Area within ½ mile
1,050
Businesses Nearby
Balanced
Demand for This Use
Explore this area
Business Placement
Demographics for 81501, CO
23,935
Population
11,524
Households
2.1
Avg Household Size
33
Median Age
27%
College-Educated
90%
High-School Grad
8.7 sq mi
ZIP Area
2,751
Density / Sq Mi
$48,500
Median Household Income
$32,160
Median Earnings
$974
Median Rent
$283,300
Median Home Value
Check the figures for this property
Cap Rate, Value Estimation, Potential NOI and more
View Realmo Analytics
Market
Vacancy Rate% for Office in West region

Questions? Ask Rey
Realmo’s AI knows this listing — price, zoning, demand, history. Ask anything.
Similar Off Market Nearby
- Colorado Q — 449 Main St, Grand Junction, CO 81501
Frequently Asked Questions
What type of property is this?
Flex space - Combined commercial offering with warehouse, office, gym, and fenced storage components across adjoining parcels.
Where is this flex space located?
The property is located at 1111 & 1027 S 7th Street Grand Junction, CO.
What is the asking price?
The asking price for this property is $3,100,000.
What are key features of this property?
This property features: 7,890‑square‑foot shop and warehouse building at 1027 S. 7th Street; 2,905 square feet occupied by a jujitsu gym, with approximately 5,000 square feet for expansion; 7,673‑square‑foot, two‑story light industrial and office building at 1111 S. 7th Street



