Tenant-Occupied
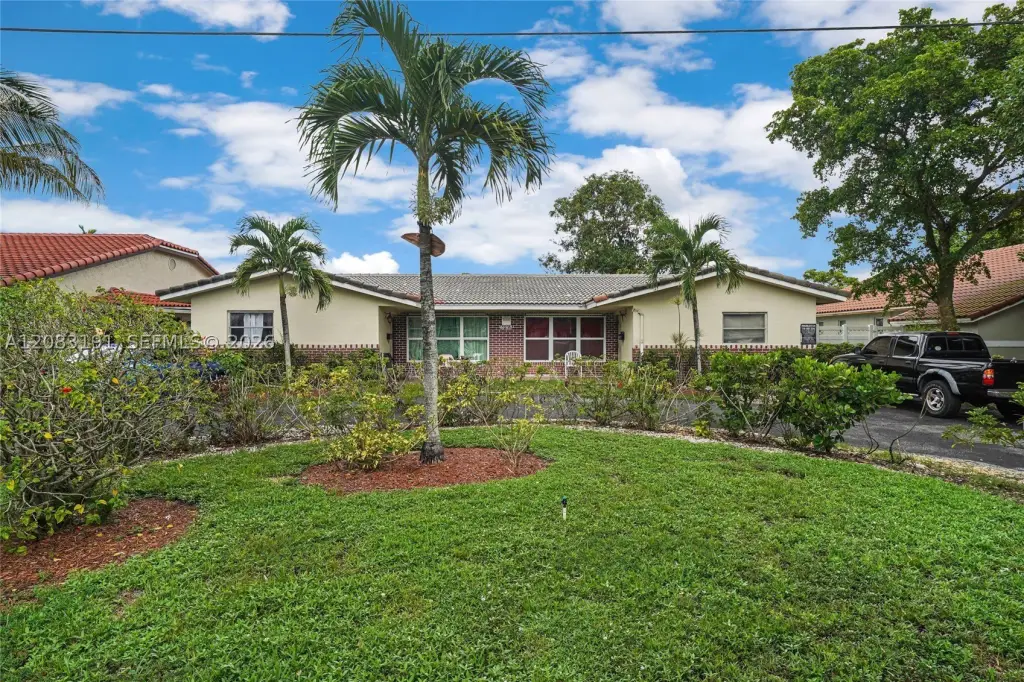
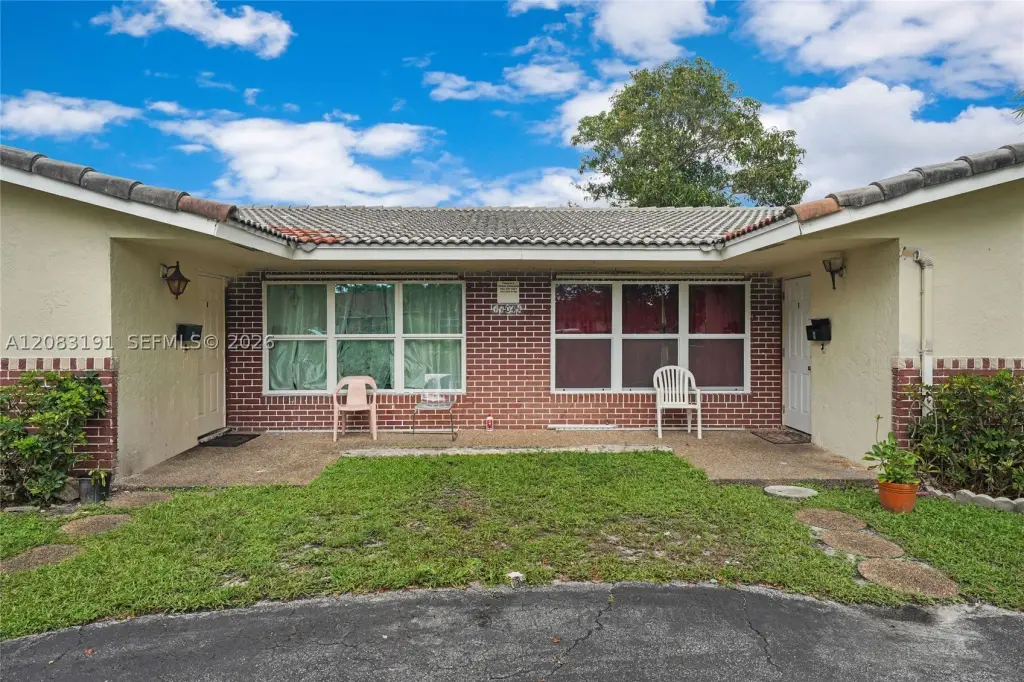
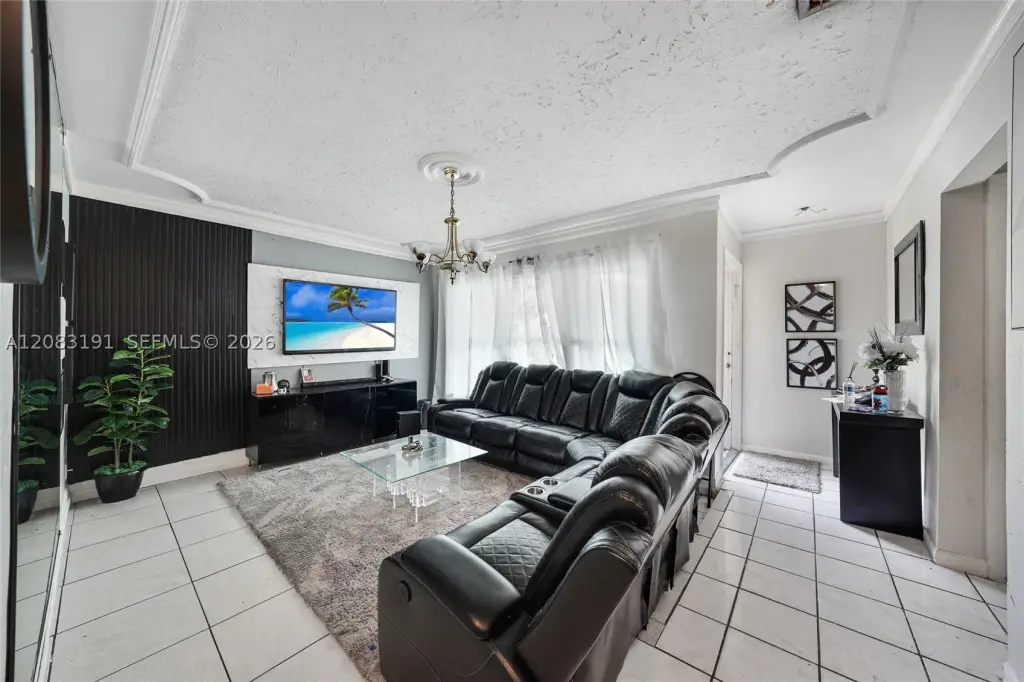
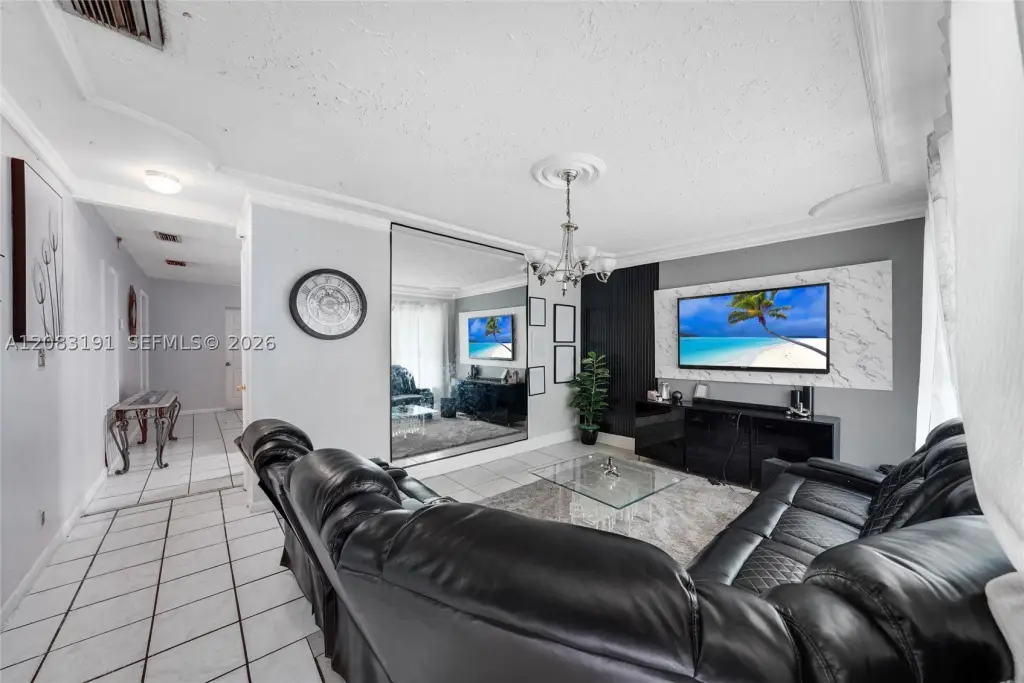
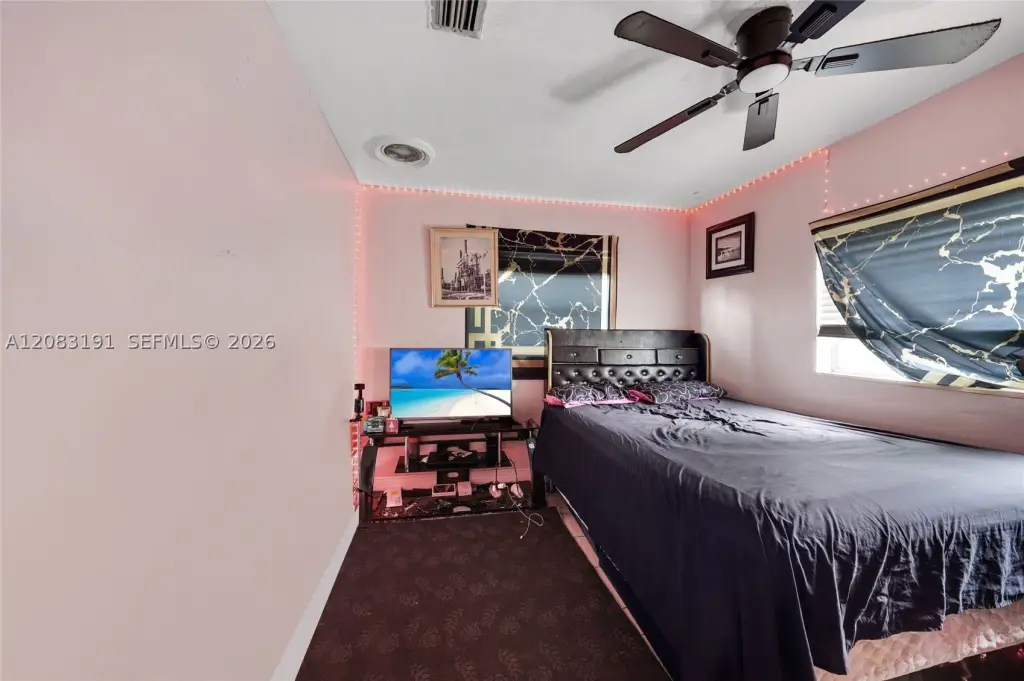
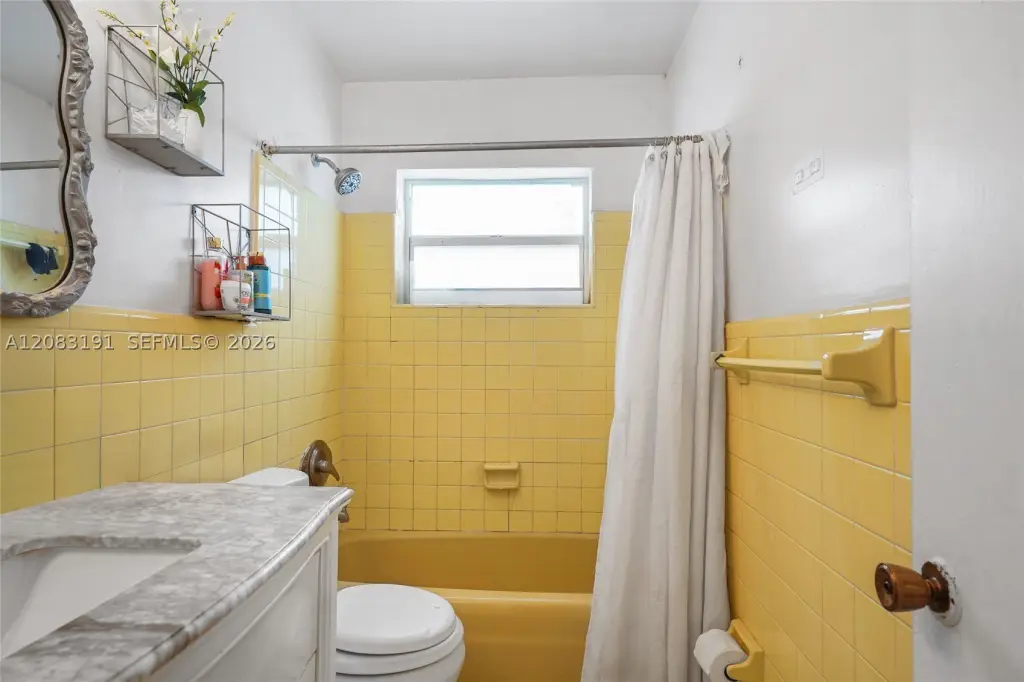
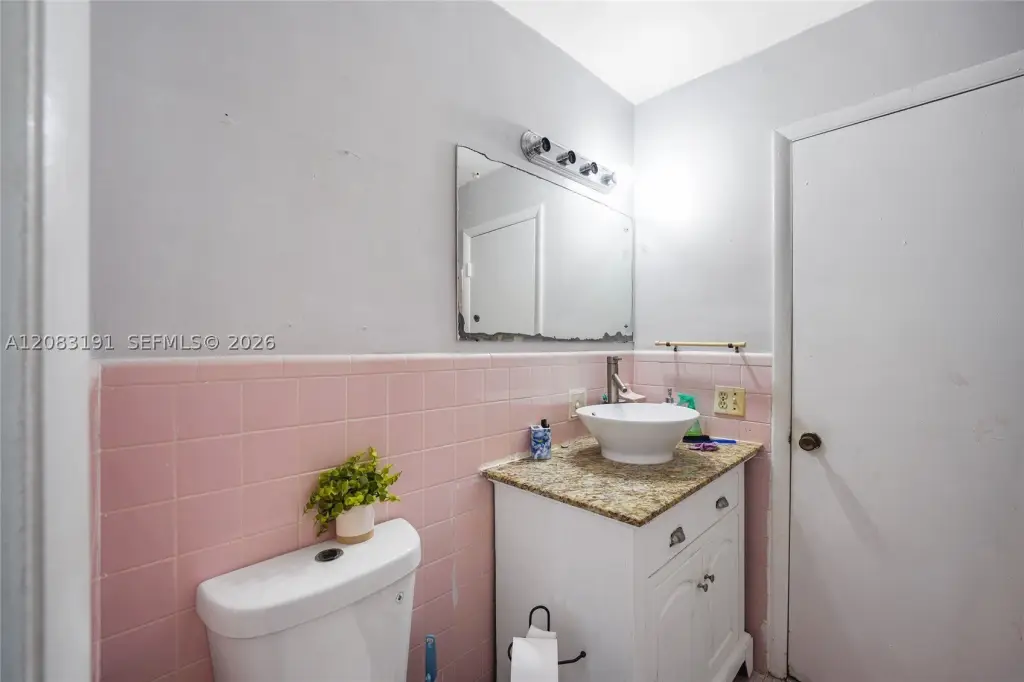
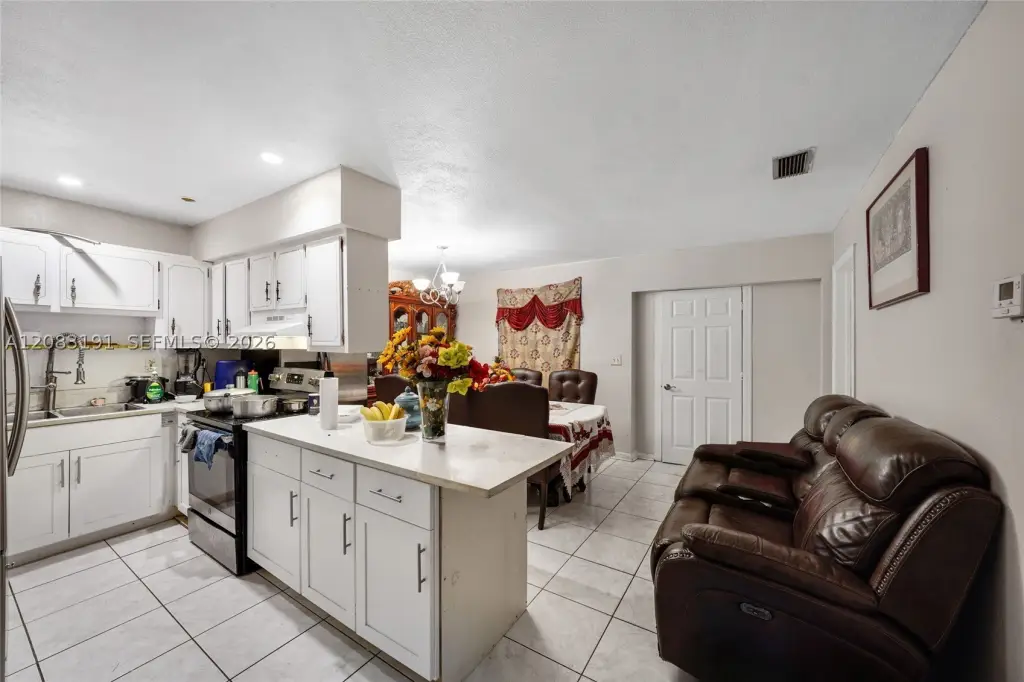
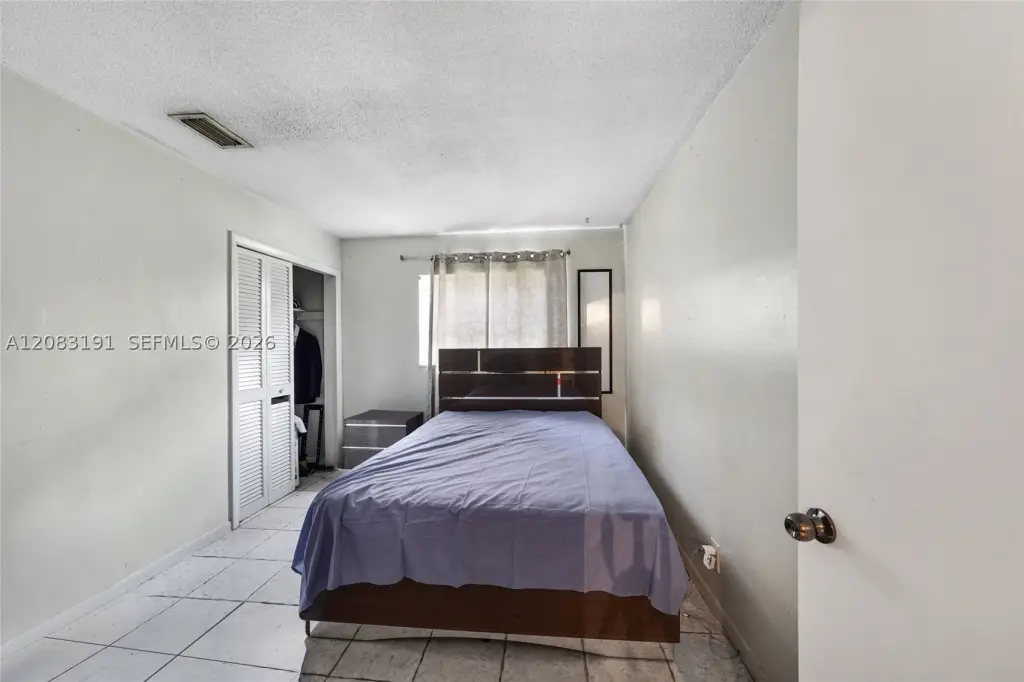
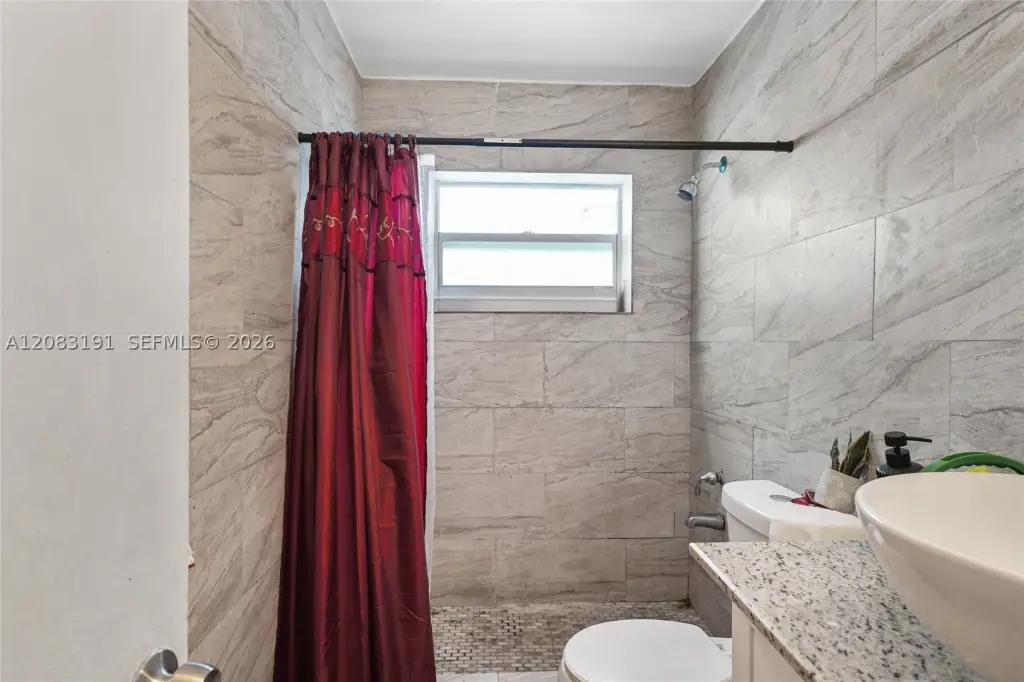
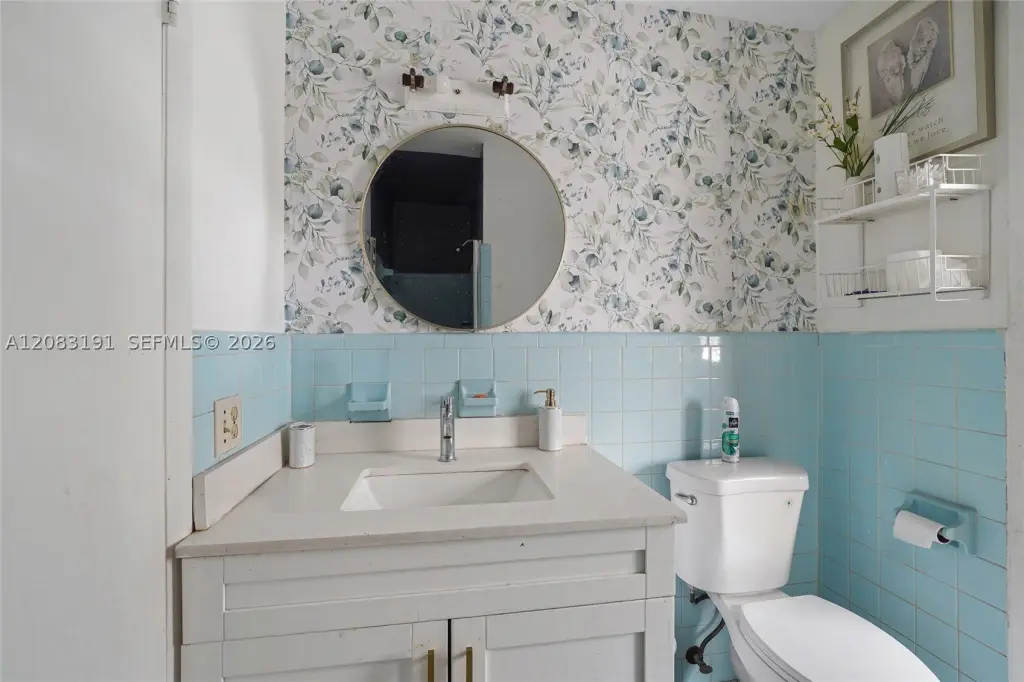
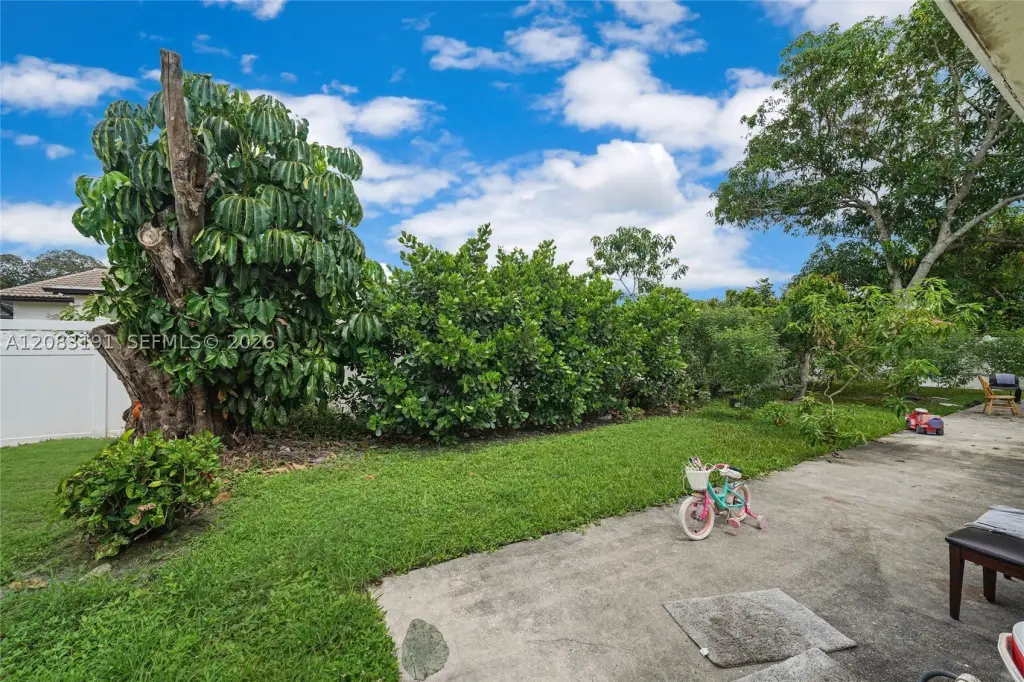
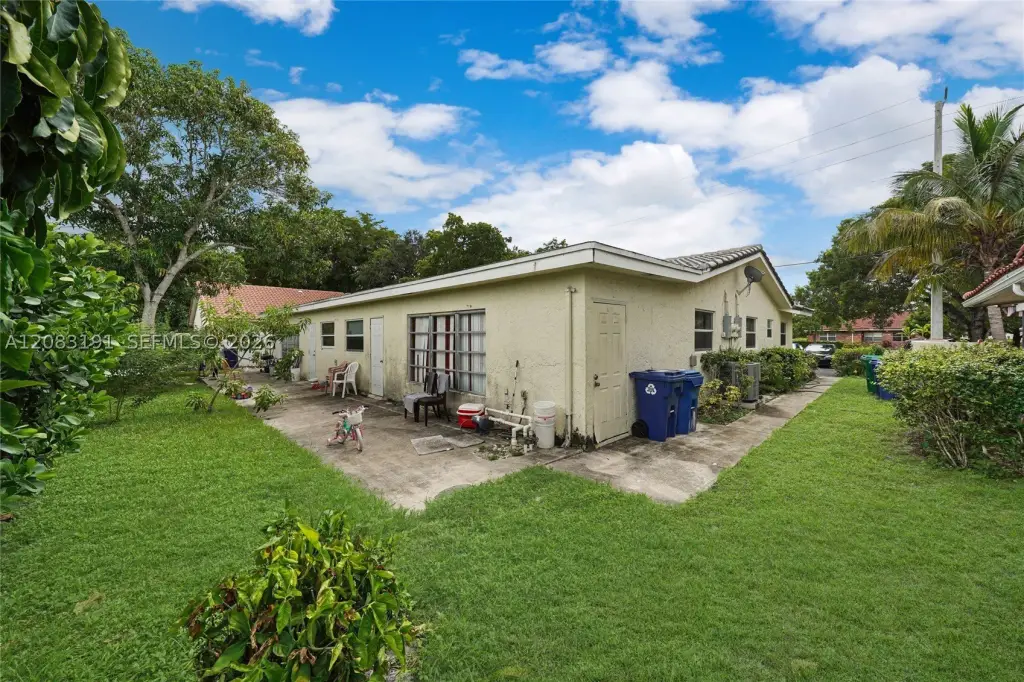
For Sale
$765,000
11041 NW 39th St, Coral Springs, FL 33065
Residential Income, Coral Springs, FL
Property Size2,829 SF
Price / SF$270.41
Days on Market47
Property Features for 11041 NW 39th St
General Information
Property type
Residential Multi Family
Property subtype
Duplex
Zoning description
RD-8
Bedrooms
8
Full bathrooms
4
Rooms
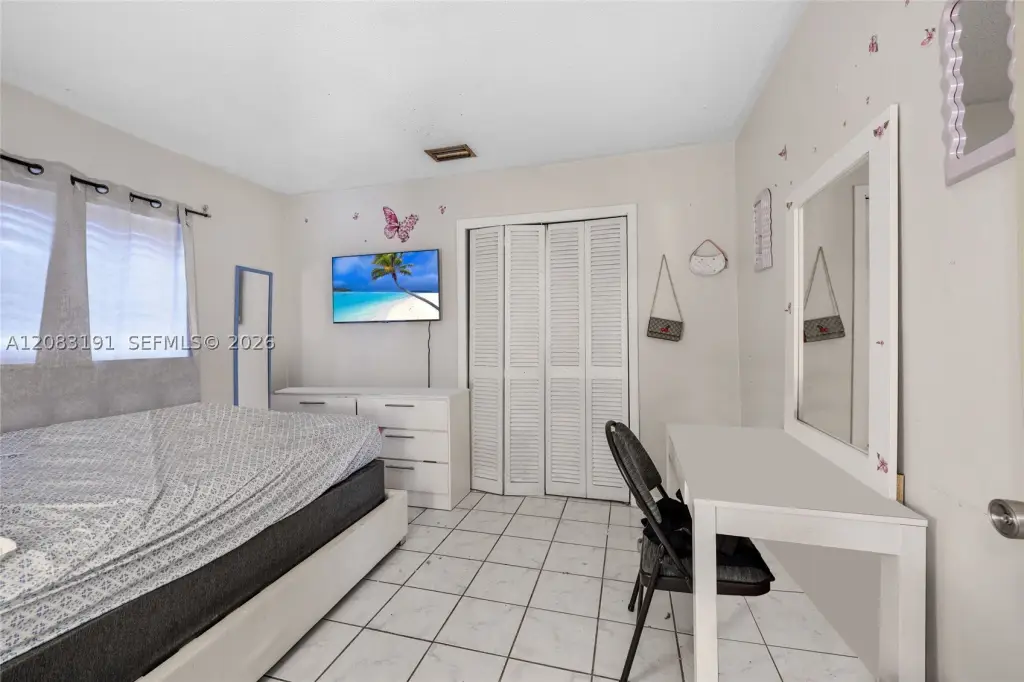
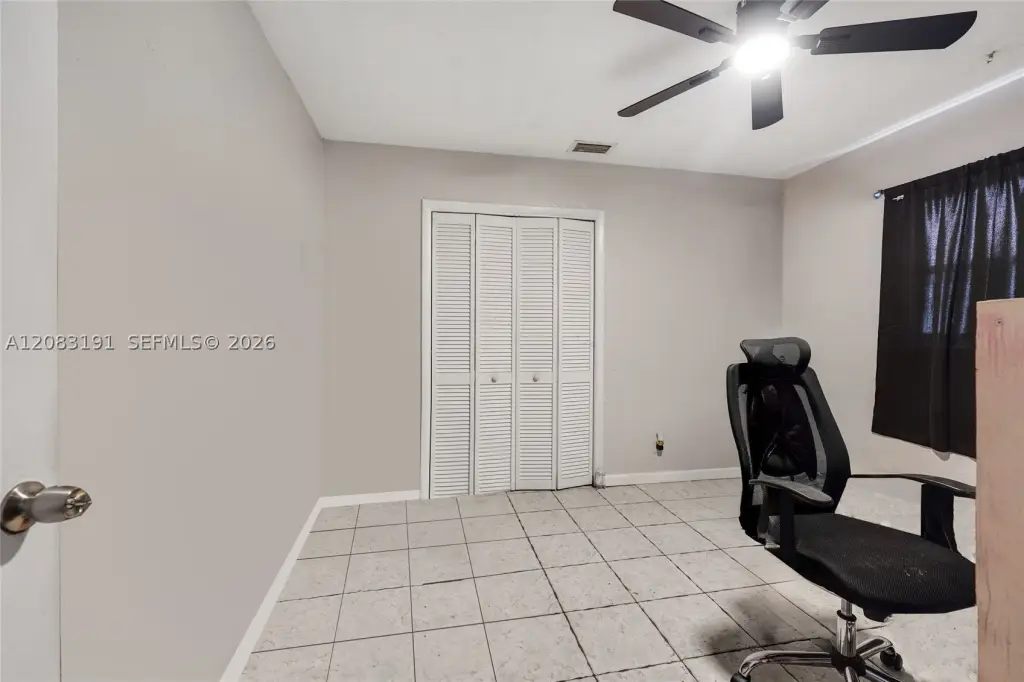
Bedroom 3, Bathroom 1, Bedroom 5, Bathroom 3, Bedroom 7, Bedroom 4, Bedroom 6, Bathroom 4, Bathroom 2, Bedroom 1, Bedroom 8, Bedroom 2
Parking
4
Subdivision
GLENWOOD SUBDIVISION
Lot features
< 1/4 Acre
Directions
From the Sawgrass Expressway (SR 869), take the Sample Road exit and head east on Sample Road. Turn left (north) on Coral Ridge Drive and go about 0.4 miles. Turn right (east) on NW 39th Street and go about 0.5 miles. The property is on the left.
Standard status
Active
APN
484117024350
Size
2,829 SF
Taxes and HOA fees
Tax Year
2025
Tax Description
GLENWOOD SUBDIVISION 69-33 B LOT 18 BLK S
Tax Annual Amount
12157
Legal Description
GLENWOOD SUBDIVISION 69-33 B LOT 18 BLK S
Utilities
Utilities
Cable Available
Sewer type
Public Sewer
Heating system
Electric (Heating), Central
Cooling system
Central Air, Electric, Ceiling Fan(s)
Building Details
Year built
1972
Floors in Building
1
Flooring type
Tile
Building materials
Block
Roof type
Barrel
Listing Agency:
Stratwell, LLC
(305) 403-6430
Listed By:
Eddie Blanco · License #0658938
(305) 403-6446
Added: Sep 3
Changed: Oct 16
Last Checked: Oct 19 at 4:06AM
MLS# A12083191
Copyright © 2026 Miami REALTORS®. All rights reserved. All information provided by the listing agent/broker is deemed reliable but is not guaranteed and should be independently verified.

Ask AI about this property
Review the available facts, identify missing information and prepare questions for the agent.
Investment Insights
Based on property information with market context.
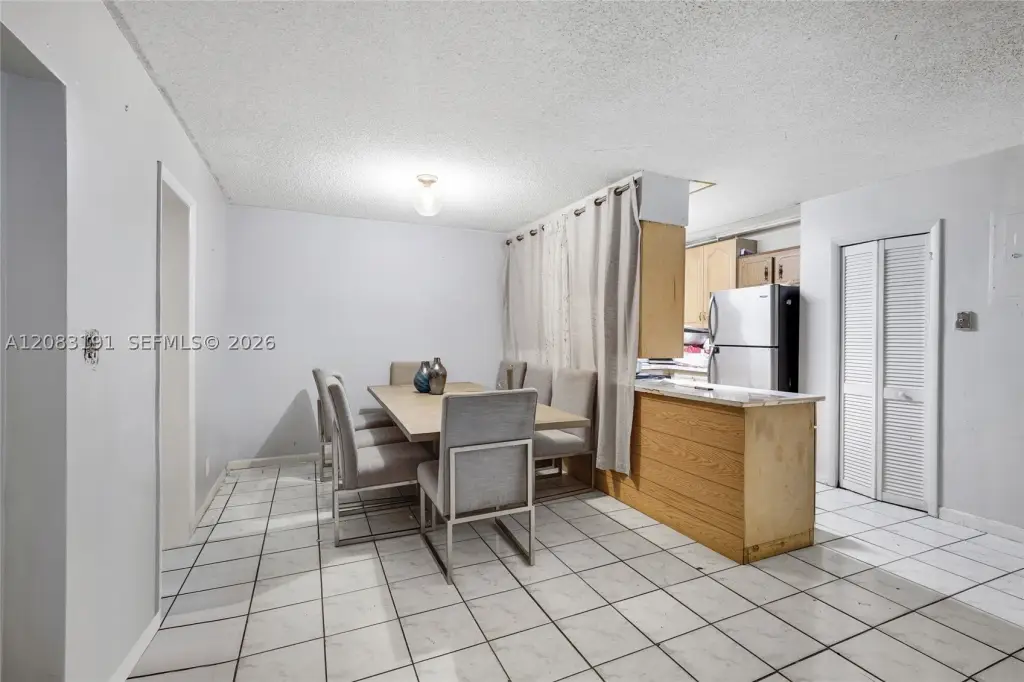
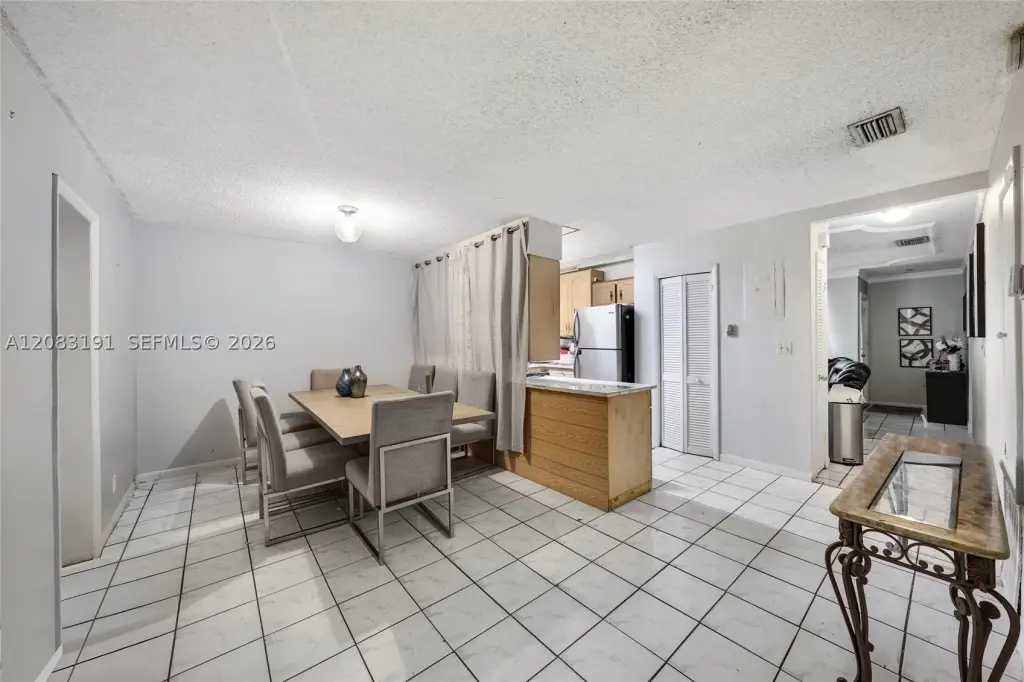
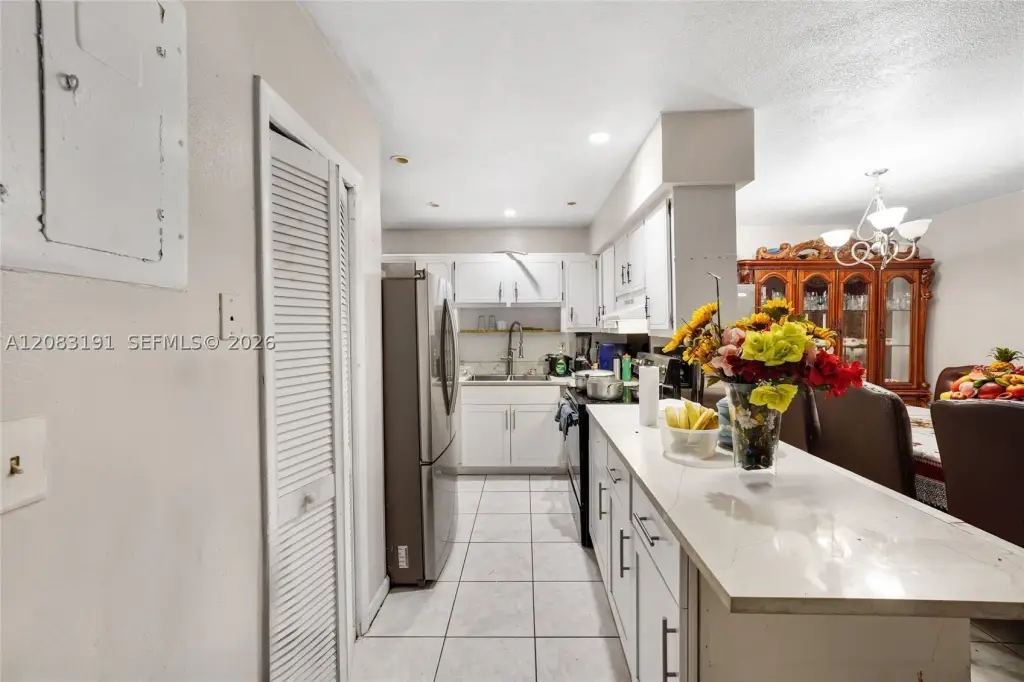
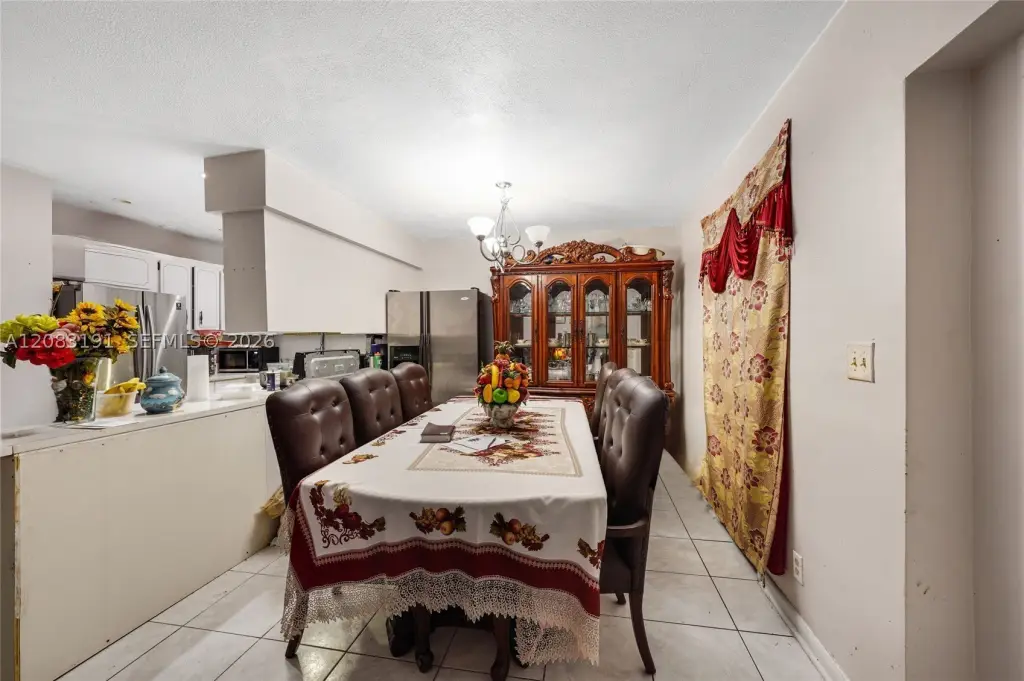
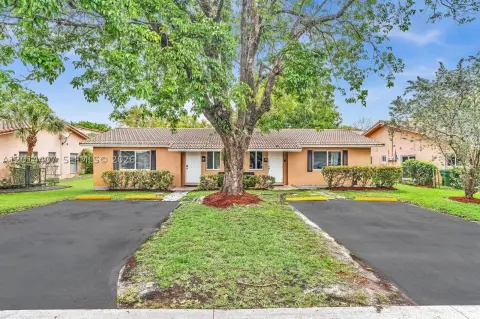
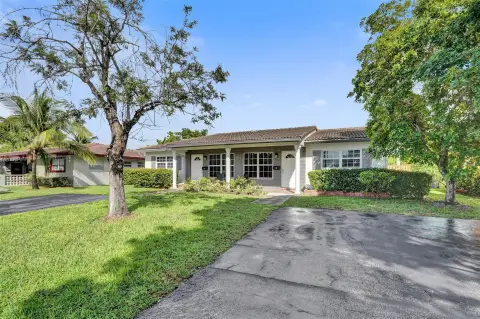
This 2,829-square-foot duplex contains two 4-bedroom, 2-bath units and was built in 1972 with block construction. Both residences are currently occupied under month-to-month Section 8 leases. Interior features include tile flooring, stainless steel appliances, central heating and cooling, and ceiling fans. A circular driveway serves the property, while separate electric meters support independent utility billing.
The property is connected to public sewer and has cable availability. Each unit offers a four-bedroom, two-bathroom layout suited to residential rental use or an owner-occupant arrangement. The existing configuration provides two separate living spaces within one duplex asset.
The property is connected to public sewer and has cable availability. Each unit offers a four-bedroom, two-bathroom layout suited to residential rental use or an owner-occupant arrangement. The existing configuration provides two separate living spaces within one duplex asset.
Key Highlights
- Two‑unit duplex with 2,829 square feet total
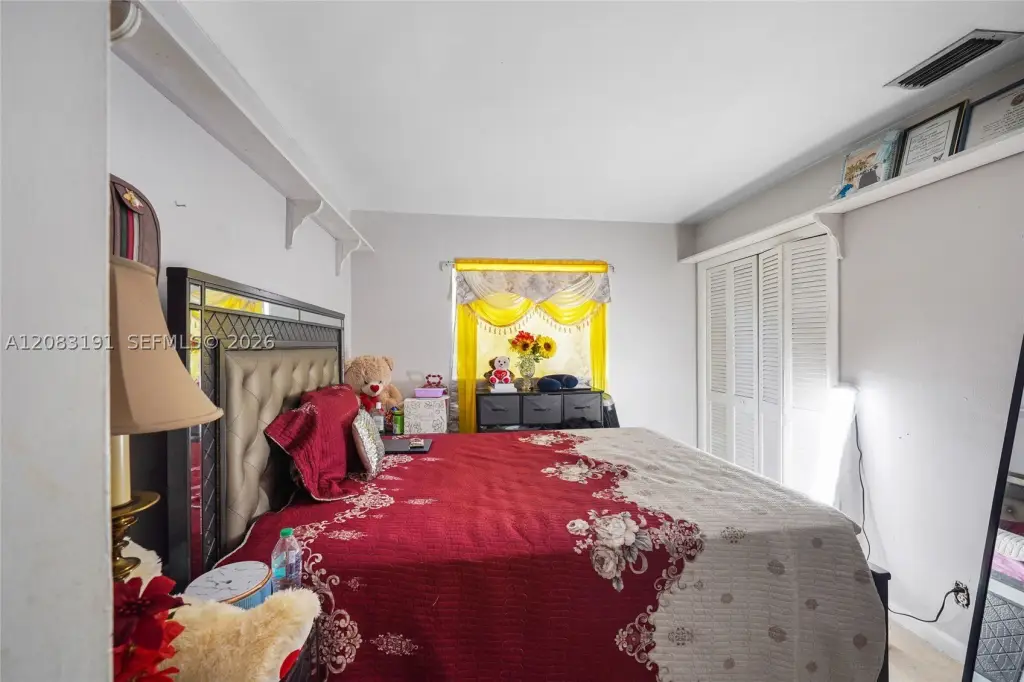
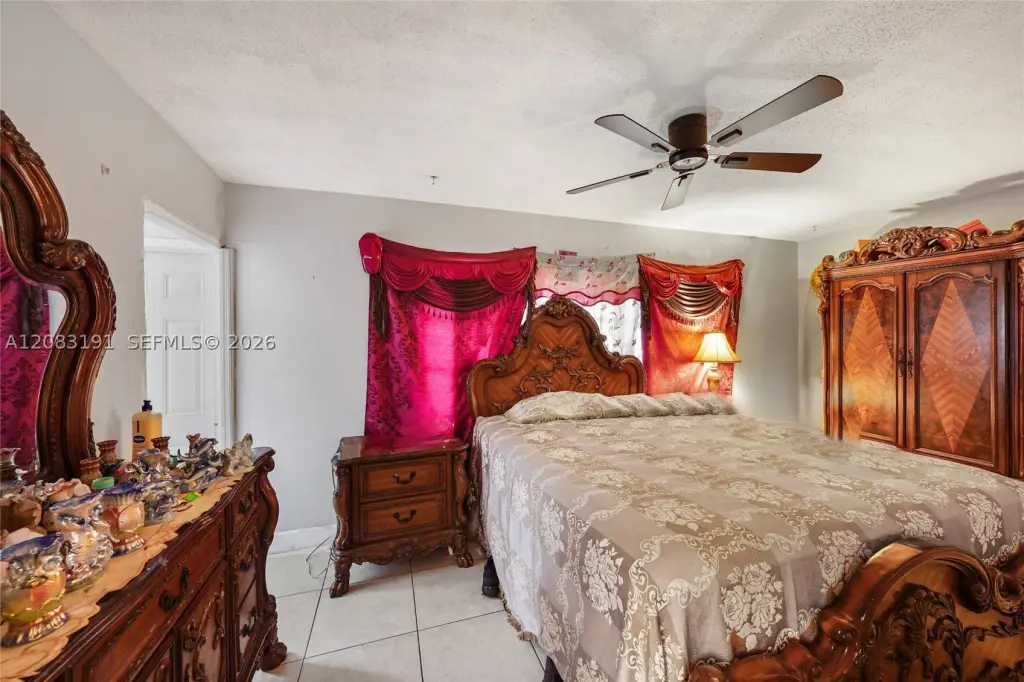
- Each unit includes 4 bedrooms and 2 bathrooms
- Both units are tenant occupied under month‑to‑month Section 8 leases
Financial Insights
Estimated NOI and Cap Rate
NOI / Yr
$48,910
Cap Rate
6.39%
Suggested Prices Based on Cap Rates
Cap Rate 5%
$978,200
$978.2K
Cap Rate 7%
$698,714
$698.7K
Cap Rate 9%
$543,444
$543.4K
Market Conditions
NOI Build-Up for 2,829 SF
Gross rent
$73.0K $25.80/SF
− Vacancy
−$3.1K −$1.10/SF
EGI
$69.9K $24.70/SF
− OpEx
−$21.0K −$7.41/SF
NOI
$48.9K $17.29/SF
Area
Coral Springs, FL
Vacancy
4.27%
Lease Rate
$25.80 /SF/Yr
Expense Ratio
30.00%
Simulate Cap Rate and NOI
Suggested Prices Based on Cap Rates
Cap Rate 5%
$978,200
Cap Rate 7%
$698,714
Cap Rate 9%
$543,444
Alternative Uses
Best Use
Multifamily LT 5
$698.7K
$611.4K – $815.2K
NOI $48,910 @ 7.0% cap · market cap 6.39%
Second Best
Apartment 5plus
$644.5K
$563.9K – $751.9K
NOI $45,113 @ 7.0% cap · market cap 5.90%
Theoretical Best
Specialty Retail
$4.82M
$4.22M – $5.63M
NOI $337,698 @ 7.0% cap · market cap 44.14%
Zoning and permitted uses should be independently verified with authorities.
How Realmo checks its estimates
Property Analytics
Unlock full access to Insights
Subscribe to Realmo Intelligence
Open Analytics
Current Use
Lease Details
2
Residential units
100%
Occupancy
Multi-tenant
Tenancy
Yes
Utilities to site
Location Intelligence
Trade Area within ½ mile
1,230
Businesses Nearby
Explore this area
Business Placement
Demographics for 33065, FL
59,668
Population
21,416
Households
2.8
Avg Household Size
36
Median Age
31%
College-Educated
93%
High-School Grad
8.6 sq mi
ZIP Area
6,938
Density / Sq Mi
$70,435
Median Household Income
$36,255
Median Earnings
$1,833
Median Rent
$416,800
Median Home Value
Check the figures for this property
Cap Rate, Value Estimation, Potential NOI and more
View Realmo Analytics
Market
Vacancy Rate% for Multifamily in South region






Frequently Asked Questions
What type of property is this?
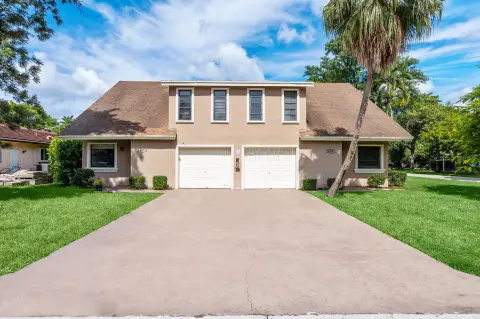
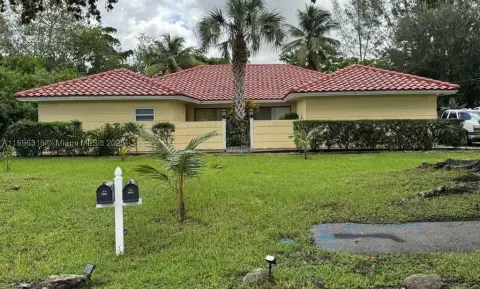
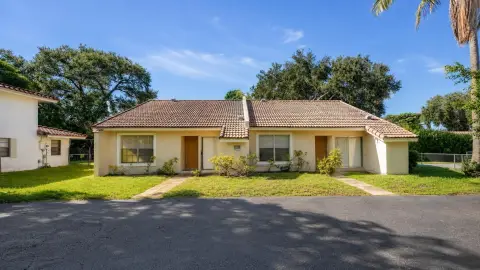
Duplex - Two-unit residential property with separate electric meters, tile flooring, and central air conditioning.
Where is this duplex located?
The property is located at 11041 NW 39th St Coral Springs, FL.
What is the asking price?
The asking price for this property is $765,000.
What are key features of this property?
This property features: Two‑unit duplex with 2,829 square feet total; Each unit includes 4 bedrooms and 2 bathrooms; Both units are tenant occupied under month‑to‑month Section 8 leases


