Seminole County Commercial
For Sale
Contact for pricing
1054 N 17-92 Hwy, Longwood, FL 32750
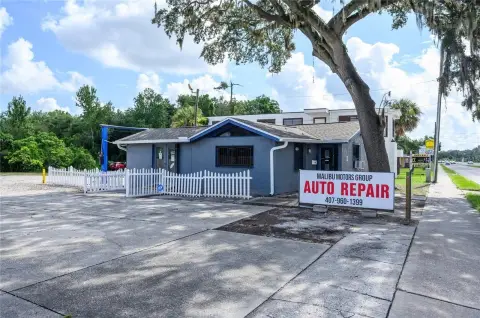
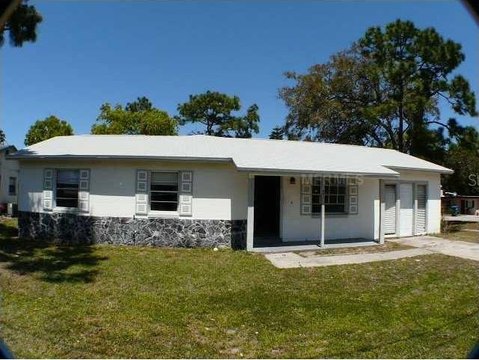
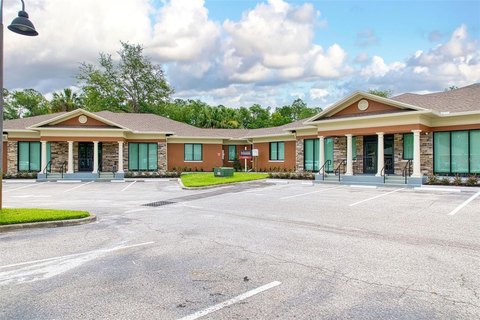
Commercial property with multiple structures and ample vehicle capacity.
Property Size2,775 SF
Lot Size0.91 Acres
Price / SF$405.41
Days on Market2014
Property Features for 1054 N 17-92 Hwy
General Information
Standard status
Active
Size
2,775 SF
Class
C
Lot size
0.91 Acres
Property subtype
Retail
Zoning
C-2
Investment Type
Owner/User
Listing Agency:
Results Real Estate Partners
Listed By:
Vincent Wolle · License #BK 688271
(407) 647-0200
Source:
Crexi
Added: Apr 7, 2021
Changed: Oct 6
Last Checked: Oct 11 at 6:19AM
Displayed information is deemed reliable but is not guaranteed and should be independently verified. All listing content including descriptions, pricing, images are the copyrighted material of Results Real Estate Partners
Investment Insights
Based on property information with market context.
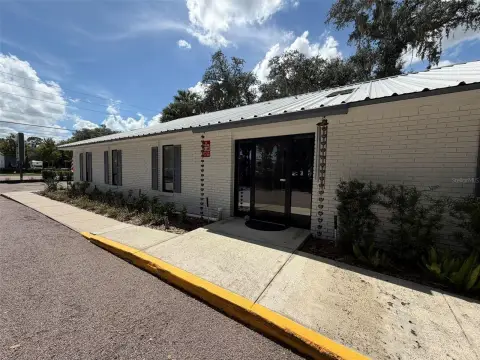
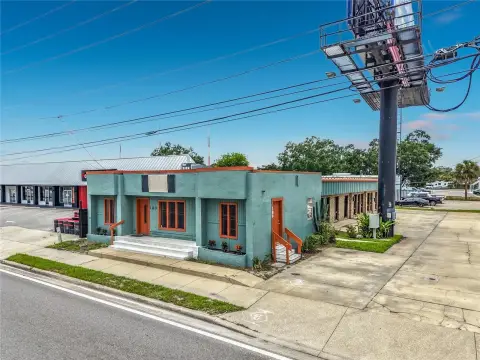
This commercial property in Seminole County is suitable for a car lot, boat sales, or a towing facility. It features three structures totaling 2,775 square feet, including three service bays and an office. The 0.91-acre site is zoned C-2 and has over 100 feet of frontage on Highway 17-92, with two access points, one on Highway 17-92 and another on Raven Avenue. The site is fenced, and equipped with security cameras and lighting. It can accommodate over 90 vehicles. The property is located at the intersection of Highway 17-92 and Raven Avenue, between State Road 434 and Ronald Reagan Boulevard, on car dealer row.
Key Highlights
- Prime location on Hwy 17‑92 in Seminole County's car dealer row.
- C‑2 zoning allows for car lot, boat sales, or towing facility.
- .91 acre fenced site with security cameras and lighting.
Financial Insights
Estimated NOI and Cap Rate
NOI / Yr
$54,492
Cap Rate
4.84%
Suggested Prices Based on Cap Rates
Cap Rate 5%
$1,089,840
$1.1M
Cap Rate 7%
$778,457
$778.5K
Cap Rate 9%
$605,467
$605.5K
Market Conditions
NOI Build-Up for 2,775 SF
Gross rent
$80.6K $29.04/SF
− Vacancy
−$2.7K −$0.99/SF
EGI
$77.8K $28.05/SF
− OpEx
−$23.4K −$8.42/SF
NOI
$54.5K $19.64/SF
Area
Seminole County, FL
Vacancy
3.40%
Lease Rate
$29.04 /SF/Yr
Expense Ratio
30.00%
Simulate Cap Rate and NOI
Suggested Prices Based on Cap Rates
Cap Rate 5%
$1,089,840
Cap Rate 7%
$778,457
Cap Rate 9%
$605,467
Alternative Uses
Best Use
Retail
$778.5K
$681.2K – $908.2K
NOI $54,492 @ 7.0% cap · market cap 4.84%
Second Best
Specialty Retail
$764.5K
$669.0K – $892.0K
NOI $53,518 @ 7.0% cap · market cap 4.76%
Theoretical Best
Office A
$789.7K
$691.0K – $921.3K
NOI $55,278 @ 7.0% cap · market cap 4.91%
Zoning and permitted uses should be independently verified with authorities.
Property Analytics
Current Use
Location Intelligence
Trade Area within ½ mile
583
Businesses Nearby
30k
Monthly Visits Nearby
Explore this area
Business Placement
Foot Traffic Nearby
Groceries 100%
Publix
Groceries
29,687 visits/mo
0.5 miles
Publix Liquors
Groceries
748 visits/mo
0.5 miles
Demographics for 32750, FL
25,261
Population
10,541
Households
2.4
Avg Household Size
43
Median Age
37%
College-Educated
93%
High-School Grad
11.4 sq mi
ZIP Area
2,216
Density / Sq Mi
$85,227
Median Household Income
$48,311
Median Earnings
$1,633
Median Rent
$350,600
Median Home Value
Market
Vacancy Rate% for Retail in South region

Questions? Ask Rey
Realmo’s AI knows this listing — price, zoning, demand, history. Ask anything.




Frequently Asked Questions
What type of property is this?
Car wash - Commercial property with multiple structures and ample vehicle capacity.
Where is this car wash located?
The property is located at 1054 N 17-92 Hwy Longwood, FL.
What is the asking price?
The asking price for this property is $1,125,000.
What are key features of this property?
This property features: Prime location on Hwy 17‑92 in Seminole County's car dealer row.; C‑2 zoning allows for car lot, boat sales, or towing facility.; .91 acre fenced site with security cameras and lighting.


