Tenant-Occupied Duplex with
For Sale
$470,000
10310 Lynwood Village, San Antonio, TX 78245
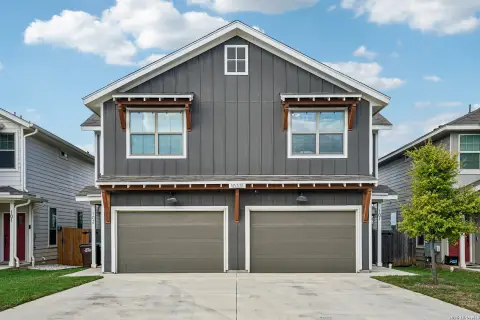
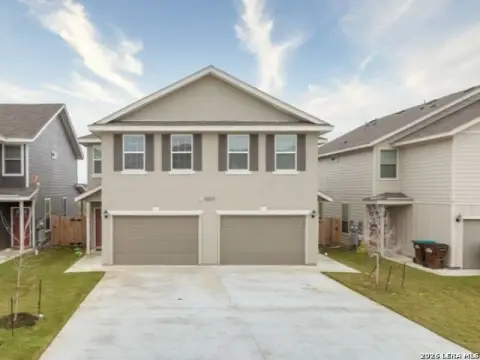
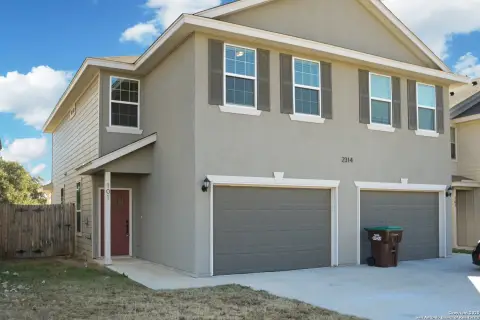
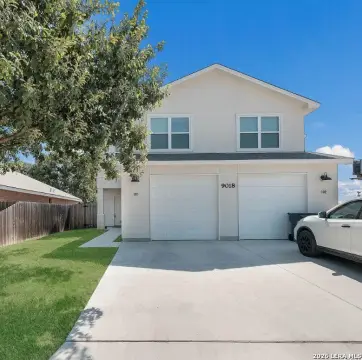
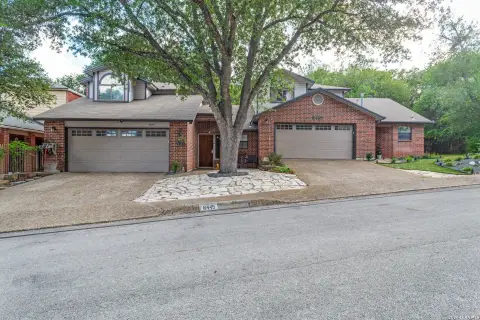
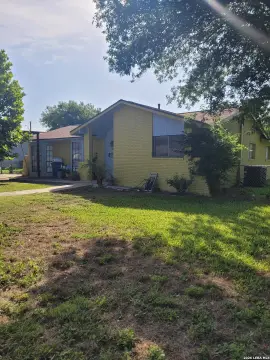
Gated-community duplex with two three-bedroom residences, private garages, covered patios, and active leases already in place.
Property Size2,712 SF
Price / SF$173.30
Days on Market55
Property Features for 10310 Lynwood Village
General Information
Standard status
Active
Size
2,712 SF
Total Parking Spaces
2
Property subtype
Multi-Family
Units
Unit Mix
2 x 3BR/2.5BA
Multifamily Units
2
Parking per Unit
1
Additional Details
Highway Access
Yes
Amenities
gated community
washer/dryer closet
covered patios
Building Details
Year Built
2022
Buildings
1
Stories
2
Tenancy
Multi
Listing Agency:
RE/MAX Alamo Realty
Listed By:
Esteban Trevino · License #484189
(210) 326-6183
Source:
Shebaramos
Added: Aug 28
Changed: Oct 15
Last Checked: Oct 7 at 1:49PM
Displayed information is deemed reliable but is not guaranteed and should be independently verified. All listing content including descriptions, pricing, images are the copyrighted material of RE/MAX Alamo Realty

Ask AI about this property
Review the available facts, identify missing information and prepare questions for the agent.
Investment Insights
Based on property information with market context.
Built in 2022, this 2,712-square-foot duplex contains two residences, each with 3 bedrooms and 2.5 bathrooms. Both layouts place the living room and kitchen on the first floor, with bedrooms upstairs and a dedicated washer-and-dryer closet. Each unit includes a one-car garage and a compact backyard with a covered patio. Interior finishes vary between units, with granite countertops paired with either white or dark brown cabinetry.
Both residences are tenant-occupied, and REMAX Alamo manages the property. Lease Unit #101 expires 5/31/27, while the lease for Unit #102 expires 8/30/27. Tenants pay $65 each toward water expense. The duplex is within a gated community in northwest San Antonio, near Loop 1604, HWY 90, Lackland AFB, and SWISD schools.
Both residences are tenant-occupied, and REMAX Alamo manages the property. Lease Unit #101 expires 5/31/27, while the lease for Unit #102 expires 8/30/27. Tenants pay $65 each toward water expense. The duplex is within a gated community in northwest San Antonio, near Loop 1604, HWY 90, Lackland AFB, and SWISD schools.
Key Highlights
- 2,712‑square‑foot duplex built in 2022
- Two units, each with 3 bedrooms and 2.5 bathrooms
- One‑car garage and covered patio for each unit
Financial Insights
Estimated NOI and Cap Rate
NOI / Yr
$28,417
Cap Rate
6.05%
Suggested Prices Based on Cap Rates
Cap Rate 5%
$568,340
$568.3K
Cap Rate 7%
$405,957
$406.0K
Cap Rate 9%
$315,744
$315.7K
Market Conditions
NOI Build-Up for 2,712 SF
Gross rent
$43.0K $15.84/SF
− Vacancy
−$2.4K −$0.87/SF
EGI
$40.6K $14.97/SF
− OpEx
−$12.2K −$4.49/SF
NOI
$28.4K $10.48/SF
Area
ZIP 78245
Vacancy
5.50%
Lease Rate
$15.84 /SF/Yr
Expense Ratio
30.00%
Simulate Cap Rate and NOI
Suggested Prices Based on Cap Rates
Cap Rate 5%
$568,340
Cap Rate 7%
$405,957
Cap Rate 9%
$315,744
Alternative Uses
Best Use
Multifamily LT 5
$406.0K
$355.2K – $473.6K
NOI $28,417 @ 7.0% cap · market cap 6.05%
Second Best
Apartment 5plus
$376.5K
$329.5K – $439.3K
NOI $26,357 @ 7.0% cap · market cap 5.61%
Theoretical Best
Office A
$691.8K
$605.3K – $807.1K
NOI $48,425 @ 7.0% cap · market cap 10.30%
Zoning and permitted uses should be independently verified with authorities.
How Realmo checks its estimates
Property Analytics
Unlock full access to Insights
Subscribe to Realmo Intelligence
Open Analytics
Lease Details
2
Residential units
Multi-tenant
Tenancy
Yes
Highway access
Location Intelligence
Trade Area within ½ mile
65
Businesses Nearby
Explore this area
Business Placement
Demographics for 78245, TX
93,031
Population
32,219
Households
2.9
Avg Household Size
31
Median Age
26%
College-Educated
91%
High-School Grad
35.2 sq mi
ZIP Area
2,643
Density / Sq Mi
$87,890
Median Household Income
$43,165
Median Earnings
$1,563
Median Rent
$241,500
Median Home Value
Check the figures for this property
Cap Rate, Value Estimation, Potential NOI and more
View Realmo Analytics
Market
Vacancy Rate% for Multifamily in South region



Frequently Asked Questions
What type of property is this?
Duplex - Gated-community duplex with two three-bedroom residences, private garages, covered patios, and active leases already in place.
Where is this duplex located?
The property is located at 10310 Lynwood Village San Antonio, TX.
What is the asking price?
The asking price for this property is $470,000.
What are key features of this property?
This property features: 2,712‑square‑foot duplex built in 2022; Two units, each with 3 bedrooms and 2.5 bathrooms; One‑car garage and covered patio for each unit