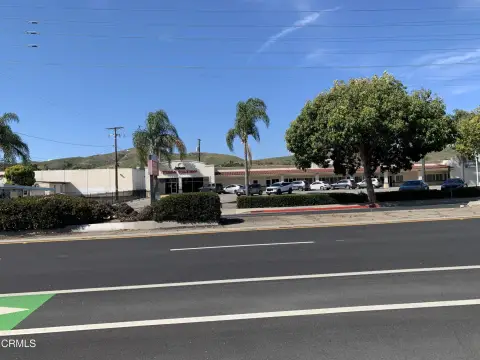
Corner Retail Condo with Tall
For Sale
$750,000
101-2176 E Main St, Ventura, CA
Built in 2022 with installed HVAC and expansive street-facing windows.
Property Size1,585 SF
Price / SF$473.19
Days on Market541
Property Features for 101-2176 E Main St
General Information
Standard status
Active
Size
1,585 SF
Site & Location
Corner Location
Yes
Anchor Co-Tenants
A Secret Place Beauty Salon, Boba Tea Cafe & Yoga Studio
Additional Details
Floor
Ground
Amenities
high ceilings
tall windows
HVAC system
Building Details
Year Built
2022
Listing Agency:
LIV Sotheby's International Realty
(805) 641-0125
Listed By:
David Smolen
(805) 320-3090
Source:
Exprealty
Added: Apr 22, 2025
Changed: Oct 3
Last Checked: Oct 12 at 9:06PM
Displayed information is deemed reliable but is not guaranteed and should be independently verified. All listing content including descriptions, pricing, images are the copyrighted material of LIV Sotheby's International Realty
Investment Insights
Based on property information with market context.
This 1,585-square-foot retail condo occupies a corner position within the Villa San Clemente Condo Complex, a mixed-use development completed in 2022. The interior features high ceilings, tall windows, abundant natural light, and an existing HVAC system that can support a streamlined build-out. The property is suited to retail, wellness, professional services, and creative office uses as stated in the property information.
The ground level contains three commercial condos, with ten two-story residential condos above. The unit is next to A Secret Place Beauty Salon, while a Boba Tea Cafe and Yoga Studio are identified as coming soon at the opposite end of the complex. The corner placement and window exposure provide prominent visibility from the surrounding streets.
The ground level contains three commercial condos, with ten two-story residential condos above. The unit is next to A Secret Place Beauty Salon, while a Boba Tea Cafe and Yoga Studio are identified as coming soon at the opposite end of the complex. The corner placement and window exposure provide prominent visibility from the surrounding streets.
Key Highlights
- 1,585 SF corner retail condo in the Villa San Clemente Condo Complex
- Completed in 2022
- High ceilings and tall windows provide abundant natural light
Financial Insights
Estimated NOI and Cap Rate
NOI / Yr
$55,759
Cap Rate
7.43%
Suggested Prices Based on Cap Rates
Cap Rate 5%
$1,115,180
$1.1M
Cap Rate 7%
$796,557
$796.6K
Cap Rate 9%
$619,544
$619.5K
Market Conditions
NOI Build-Up for 1,585 SF
Gross rent
$88.8K $56.04/SF
− Vacancy
−$14.5K −$9.13/SF
EGI
$74.3K $46.91/SF
− OpEx
−$18.6K −$11.73/SF
NOI
$55.8K $35.18/SF
Area
Santa Clara County, CA
Vacancy
16.30%
Lease Rate
$56.04 /SF/Yr
Expense Ratio
25.00%
Simulate Cap Rate and NOI
Suggested Prices Based on Cap Rates
Cap Rate 5%
$1,115,180
Cap Rate 7%
$796,557
Cap Rate 9%
$619,544
Alternative Uses
Best Use
Office B
$796.6K
$697.0K – $929.3K
NOI $55,759 @ 7.0% cap · market cap 7.43%
Second Best
Retail
$611.6K
$535.2K – $713.6K
NOI $42,813 @ 7.0% cap · market cap 5.71%
Theoretical Best
Office A
$956.9K
$837.3K – $1.12M
NOI $66,982 @ 7.0% cap · market cap 8.93%
Zoning and permitted uses should be independently verified with authorities.
How Realmo checks its estimates
Property Analytics
Current Use
Location Intelligence
Trade Area within ½ mile
5,272
Businesses Nearby
Explore this area
Business Placement
Market
Vacancy Rate% for Office in West region

Questions? Ask Rey
Realmo’s AI knows this listing — price, zoning, demand, history. Ask anything.




Frequently Asked Questions
What type of property is this?
Retail space - Built in 2022 with installed HVAC and expansive street-facing windows.
Where is this retail space located?
The property is located at 101-2176 E Main St Ventura, CA.
What is the asking price?
The asking price for this property is $750,000.
What are key features of this property?
This property features: 1,585 SF corner retail condo in the Villa San Clemente Condo Complex; Completed in 2022; High ceilings and tall windows provide abundant natural light


