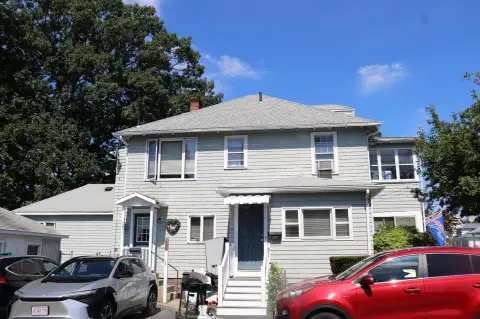
Waterfront Two-Family
For Sale
$659,900
Pending
10-12 Forbush Ave, Quincy, MA 02169
Two-family home with waterfront views and tenant income.
Property Size1,278 SF
Lot Size0.12 Acres
Days on Market322
Property Features for 10-12 Forbush Ave
General Information
Standard status
Pending
Size
1,278 SF
Lot size
0.12 Acres
Property subtype
Investment
Taxes and HOA fees
Annual Taxes
$4,267
Building Details
Building Size
1,278 SF
Year Built
1920
Stories
3
Units
2
Listed By:
Allison MacLellan
(617) 980-5999
Source:
Elliman
Added: Nov 28, 2025
Changed: Oct 5
Last Checked: Oct 15 at 1:55AM
Displayed information is deemed reliable but is not guaranteed and should be independently verified. All listing content including descriptions, pricing, images are the copyrighted material of Allison MacLellan

Ask AI about this property
Review the available facts, identify missing information and prepare questions for the agent.
Investment Insights
Based on property information with market context.
This two-family property is located in Germantown and offers waterfront views. The first-floor unit will be vacant in August, making it suitable for owner occupancy. The second-floor unit is currently occupied by a tenant with a lease extending to July 2022. The second-floor unit includes a bedroom and a loft area that can accommodate an additional bed or serve as an office. Both units were renovated in 2019 and feature granite countertops and new appliances. New boilers have been installed. The property is not located in a flood zone. Both the first and second floors have decks facing the water. Transportation options include a T bus stop at the end of the road and the Red Line train at Wollaston or Quincy Center. Wollaston Beach is nearby, and a small public beach is located a few houses away.
Key Highlights
- Waterfront property with DECKS FACING THE WATER on both units.
- Two‑family home, ideal for owner‑occupancy with rental income from the second unit.
- Not in a flood zone.
Financial Insights
Estimated NOI and Cap Rate
NOI / Yr
$21,580
Cap Rate
3.27%
Suggested Prices Based on Cap Rates
Cap Rate 5%
$431,600
$431.6K
Cap Rate 7%
$308,286
$308.3K
Cap Rate 9%
$239,778
$239.8K
Market Conditions
NOI Build-Up for 1,278 SF
Gross rent
$33.0K $25.80/SF
− Vacancy
−$2.1K −$1.68/SF
EGI
$30.8K $24.12/SF
− OpEx
−$9.2K −$7.24/SF
NOI
$21.6K $16.89/SF
Area
Quincy, MA
Vacancy
6.50%
Lease Rate
$25.80 /SF/Yr
Expense Ratio
30.00%
Simulate Cap Rate and NOI
Suggested Prices Based on Cap Rates
Cap Rate 5%
$431,600
Cap Rate 7%
$308,286
Cap Rate 9%
$239,778
Alternative Uses
Best Use
Multifamily LT 5
$308.3K
$269.8K – $359.7K
NOI $21,580 @ 7.0% cap · market cap 3.27%
Second Best
Apartment 5plus
$283.2K
$247.8K – $330.4K
NOI $19,822 @ 7.0% cap · market cap 3.00%
Theoretical Best
Office A
$755.4K
$661.0K – $881.3K
NOI $52,879 @ 7.0% cap · market cap 8.01%
Zoning and permitted uses should be independently verified with authorities.
How Realmo checks its estimates
Property Analytics
Unlock full access to Insights
Subscribe to Realmo Intelligence
Open Analytics
Current Use
Location Intelligence
Trade Area within ½ mile
203
Businesses Nearby
Explore this area
Business Placement
Demographics for 02169, MA
62,140
Population
30,198
Households
2.1
Avg Household Size
39
Median Age
48%
College-Educated
92%
High-School Grad
12.1 sq mi
ZIP Area
5,136
Density / Sq Mi
$92,080
Median Household Income
$60,166
Median Earnings
$1,975
Median Rent
$552,200
Median Home Value
Check the figures for this property
Cap Rate, Value Estimation, Potential NOI and more
View Realmo Analytics
Market
Vacancy Rate% for Multifamily in Northeast region




Frequently Asked Questions
What type of property is this?
Duplex - Two-family home with waterfront views and tenant income.
Where is this duplex located?
The property is located at 10-12 Forbush Ave Quincy, MA.
What is the asking price?
The asking price for this property is $659,900.
What are key features of this property?
This property features: Waterfront property with DECKS FACING THE WATER on both units.; Two‑family home, ideal for owner‑occupancy with rental income from the second unit.; Not in a flood zone.


