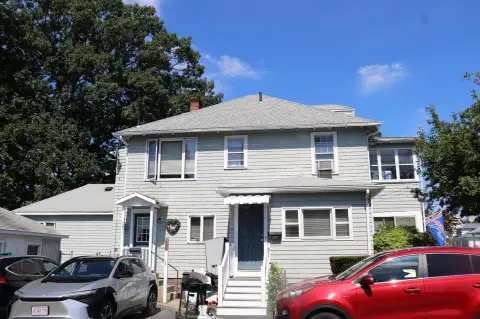
Quincy Two-Family Home For
For Sale
$725,000
16 Water St, Quincy, MA 02169
Well-maintained two-family home in Quincy, ideal for owner-occupants.
Property Size1,679 SF
Price / SF$431.80
Days on Market153
Property Features for 16 Water St
General Information
Standard status
Active
Size
1,679 SF
Property subtype
Multi-Family
Zoning
BUSB
Amenities
Vinyl, Hardwood, Stone / Slate, Stone/Ceramic Tile, Tile
Range, Dishwasher, Microwave, Refrigerator, Washer, Dryer, Washer/Dryer
Wood Burning, Gas
1
Crown Molding, Open Floorplan, Ceiling Fan(s), Bathroom with Shower Stall, Living Room, Dining Room, Kitchen
No
Shingle
Rain Gutters
Public Transportation, Shopping, Golf, Medical Facility, Laundromat, Highway Access, Marina, Private School, Public School, T-Station, Other
for Gas Range
Building Details
Building Size
1,679 SF
Year Built
1950
Stories
2
Listing Agency:
Keller Williams Realty
Listed By:
The Varano Realty Group · License #2013009293
(404) 689-4408
Source:
Reishomesearch
Added: May 16
Changed: Sep 8
Last Checked: Aug 25 at 3:03AM
Displayed information is deemed reliable but is not guaranteed and should be independently verified. All listing content including descriptions, pricing, images are the copyrighted material of Keller Williams Realty

Ask AI about this property
Review the available facts, identify missing information and prepare questions for the agent.
Investment Insights
Based on property information with market context.
This well-maintained two-family home is located in Quincy. It is suitable for both owner-occupants and investors. The property features two units with modern conveniences. The first-floor unit has a one-bedroom layout with an open floor plan connecting the living room, dining area, and kitchen. The oversized bathroom includes a tiled shower, a soaking tub, and an in-unit washer and dryer. The second-floor unit features two bedrooms, a living room, an eat-in kitchen, and a full bathroom with a shower. It also has its own washer and dryer combo. The property offers flexible living arrangements and functional layouts. It is located close to shopping, dining, public transportation, and major routes. The property size is 1679 square feet.
Key Highlights
- Two separate units ideal for owner‑occupancy or investment.
- Enjoy the convenience of in‑unit washer and dryer in both units.
- Located in a desirable Quincy location near shopping, dining, public transportation, and major routes.
Financial Insights
Estimated NOI and Cap Rate
NOI / Yr
$28,352
Cap Rate
3.91%
Suggested Prices Based on Cap Rates
Cap Rate 5%
$567,040
$567.0K
Cap Rate 7%
$405,029
$405.0K
Cap Rate 9%
$315,022
$315.0K
Market Conditions
NOI Build-Up for 1,679 SF
Gross rent
$43.3K $25.80/SF
− Vacancy
−$2.8K −$1.68/SF
EGI
$40.5K $24.12/SF
− OpEx
−$12.2K −$7.24/SF
NOI
$28.4K $16.89/SF
Area
Quincy, MA
Vacancy
6.50%
Lease Rate
$25.80 /SF/Yr
Expense Ratio
30.00%
Simulate Cap Rate and NOI
Suggested Prices Based on Cap Rates
Cap Rate 5%
$567,040
Cap Rate 7%
$405,029
Cap Rate 9%
$315,022
Alternative Uses
Best Use
Multifamily LT 5
$405.0K
$354.4K – $472.5K
NOI $28,352 @ 7.0% cap · market cap 3.91%
Second Best
Apartment 5plus
$372.0K
$325.5K – $434.0K
NOI $26,041 @ 7.0% cap · market cap 3.59%
Theoretical Best
Office A
$992.4K
$868.4K – $1.16M
NOI $69,470 @ 7.0% cap · market cap 9.58%
Zoning and permitted uses should be independently verified with authorities.
How Realmo checks its estimates
Property Analytics
Unlock full access to Insights
Subscribe to Realmo Intelligence
Open Analytics
Current Use
Location Intelligence
Trade Area within ½ mile
1,735
Businesses Nearby
Explore this area
Business Placement
Demographics for 02169, MA
62,140
Population
30,198
Households
2.1
Avg Household Size
39
Median Age
48%
College-Educated
92%
High-School Grad
12.1 sq mi
ZIP Area
5,136
Density / Sq Mi
$92,080
Median Household Income
$60,166
Median Earnings
$1,975
Median Rent
$552,200
Median Home Value
Check the figures for this property
Cap Rate, Value Estimation, Potential NOI and more
View Realmo Analytics
Market
Vacancy Rate% for Multifamily in Northeast region




Frequently Asked Questions
What type of property is this?
Duplex - Well-maintained two-family home in Quincy, ideal for owner-occupants.
Where is this duplex located?
The property is located at 16 Water St Quincy, MA.
What is the asking price?
The asking price for this property is $725,000.
What are key features of this property?
This property features: Two separate units ideal for owner‑occupancy or investment.; Enjoy the convenience of in‑unit washer and dryer in both units.; Located in a desirable Quincy location near shopping, dining, public transportation, and major routes.


