Triplex with Private Outdoor
For Sale
$1,600,000
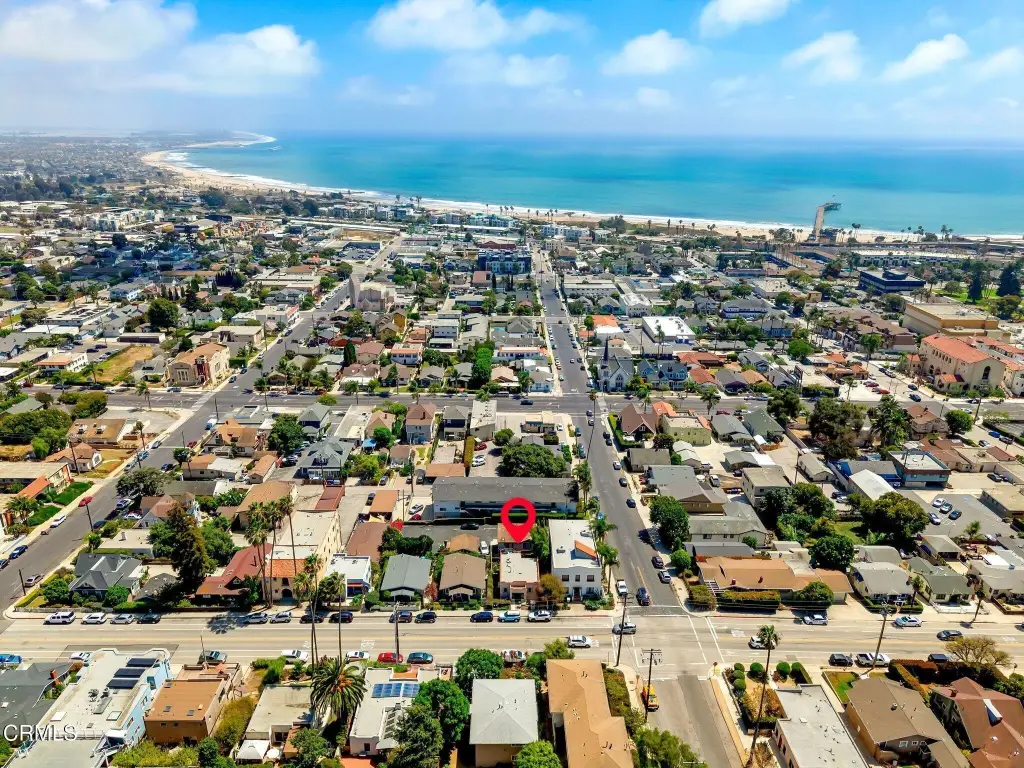
916 Poli Street, Ventura, CA 93001
Triplex, Ventura, CA
Property Size2,480 SF
Lot Size0.10 Acres
Price / SF$645.16
Days on Market65
Property Features for 916 Poli Street
General Information
Property type
Residential Multi Family
Property subtype
Other
Bedrooms
6
Bathrooms
3
Full bathrooms
3
Rooms
Bedroom 4, Bedroom 5, Bedroom 3, Bathroom 1, Bathroom 2, Bedroom 2, Bathroom 3, Bedroom 1, Bedroom 6
Parking features
Assigned, Garage
Interior features
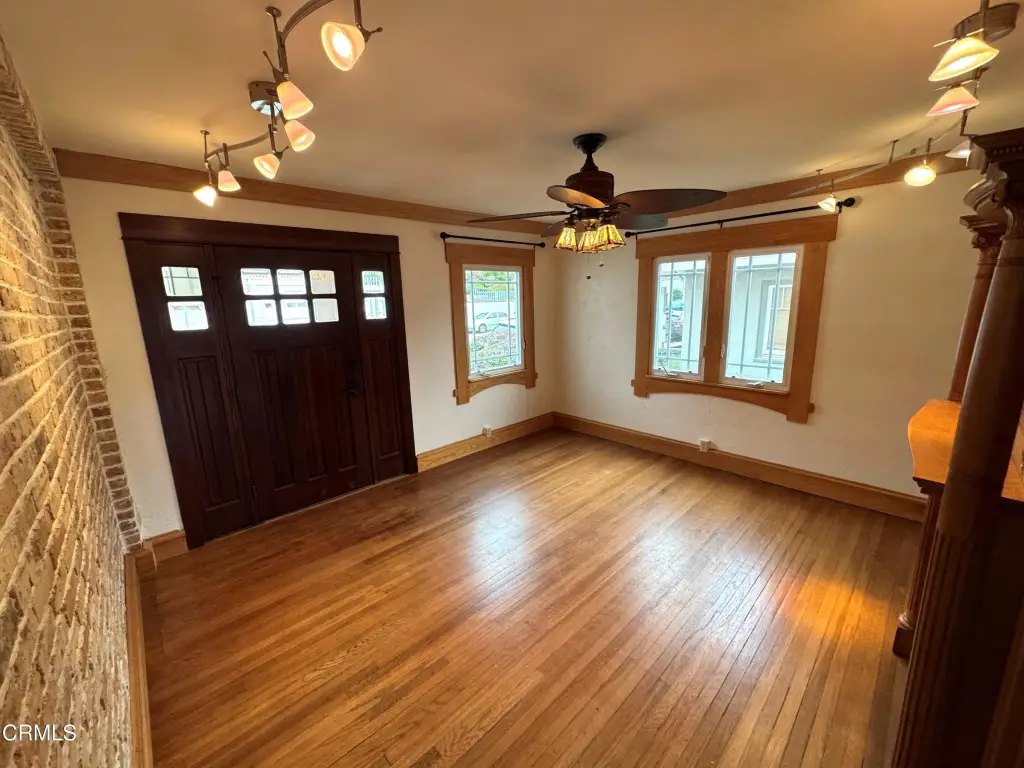
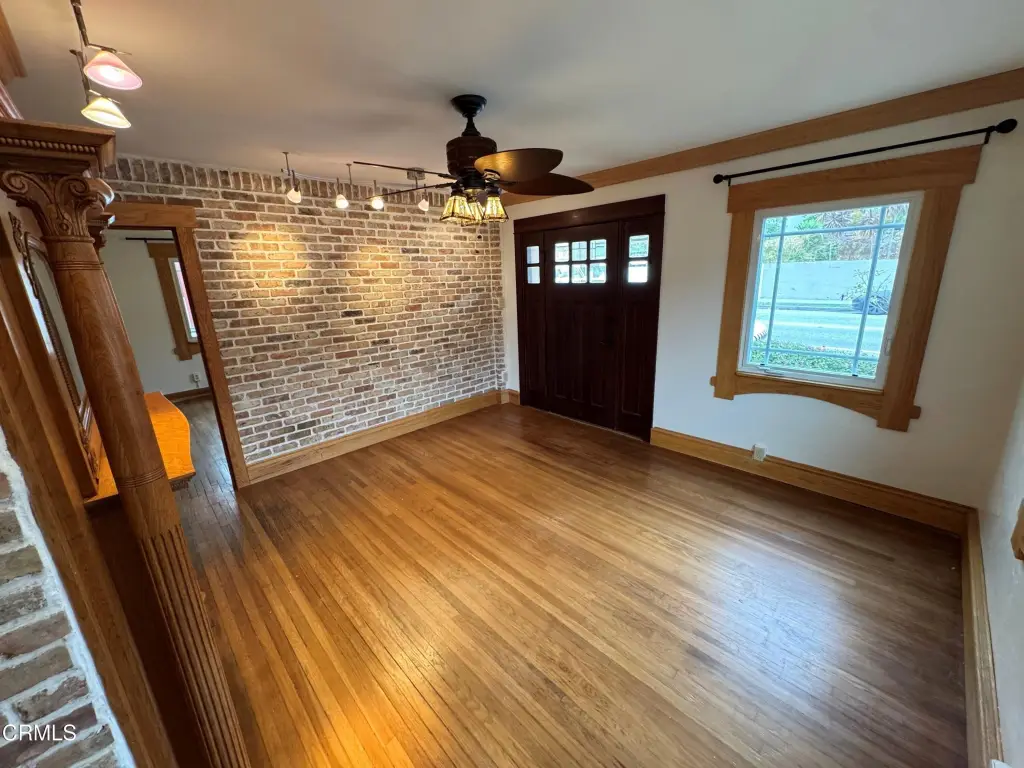
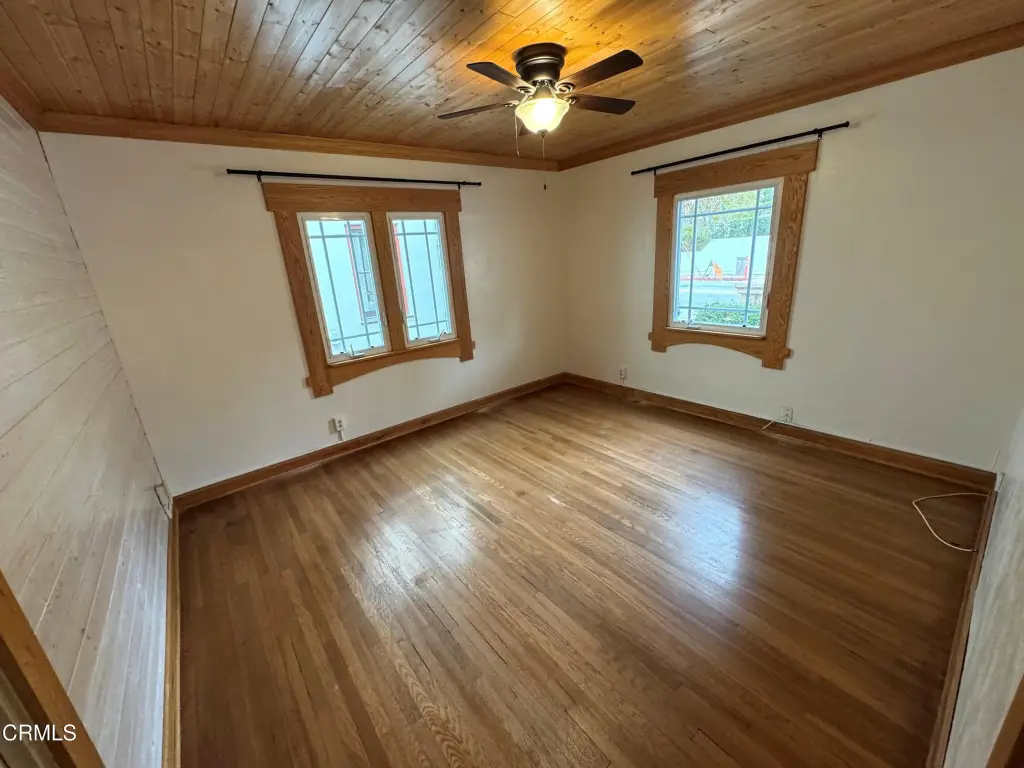
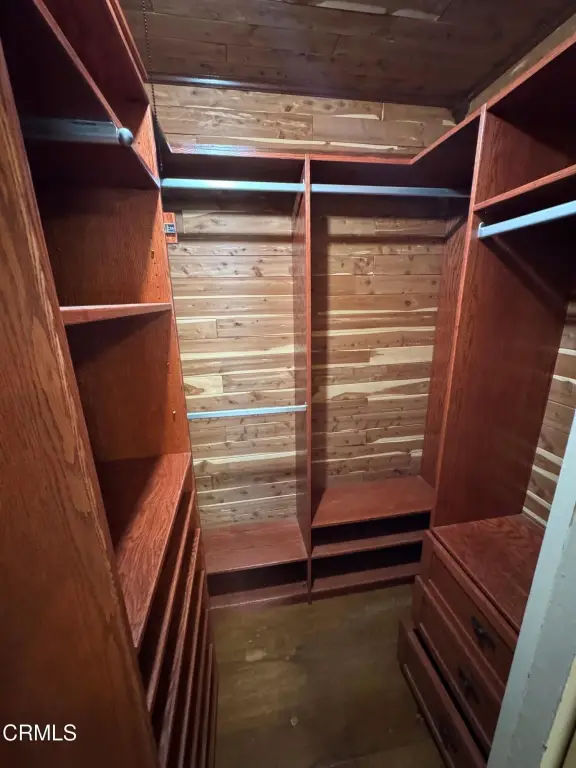
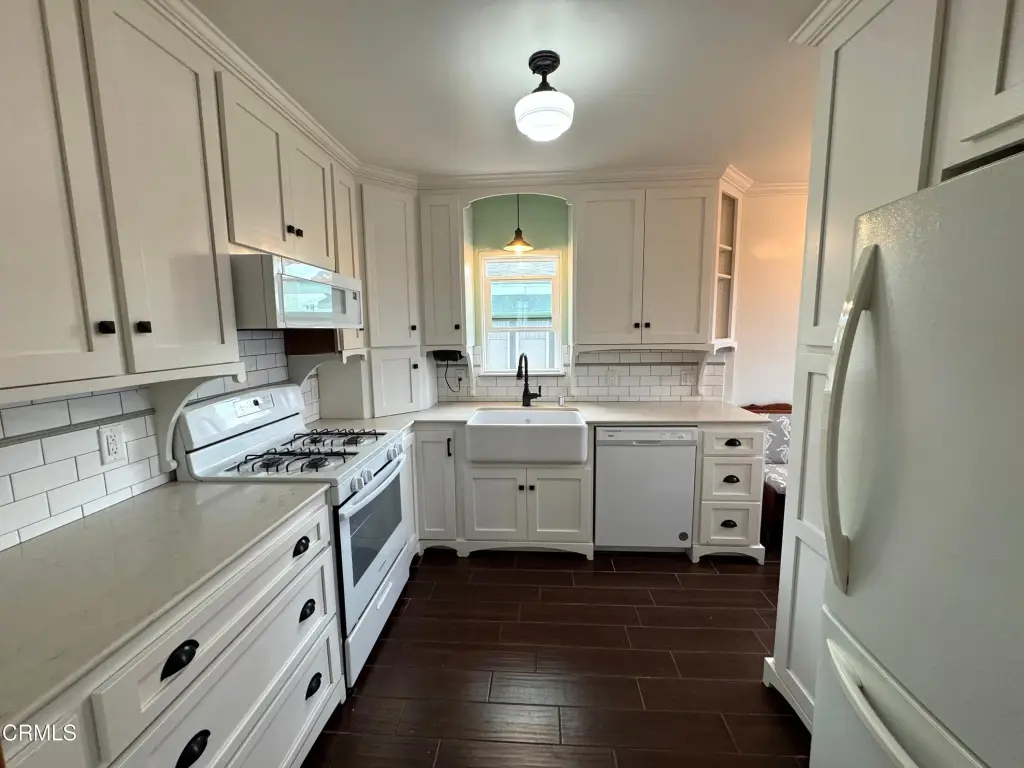
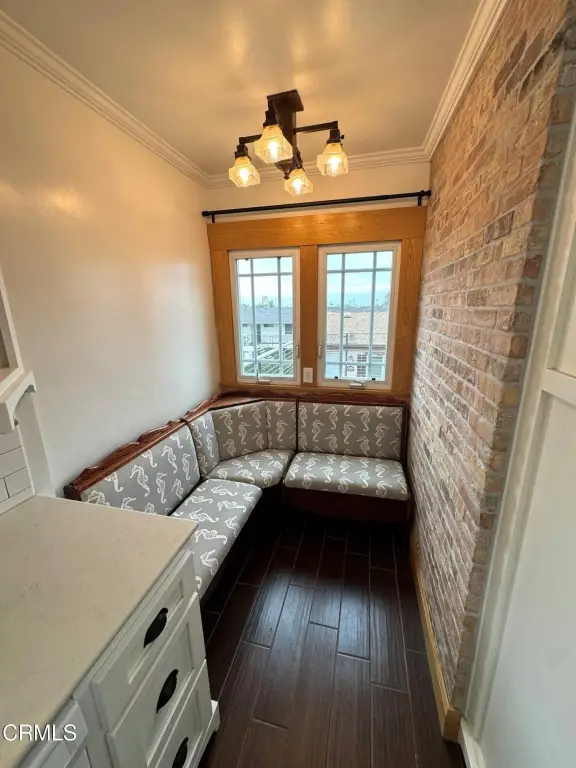
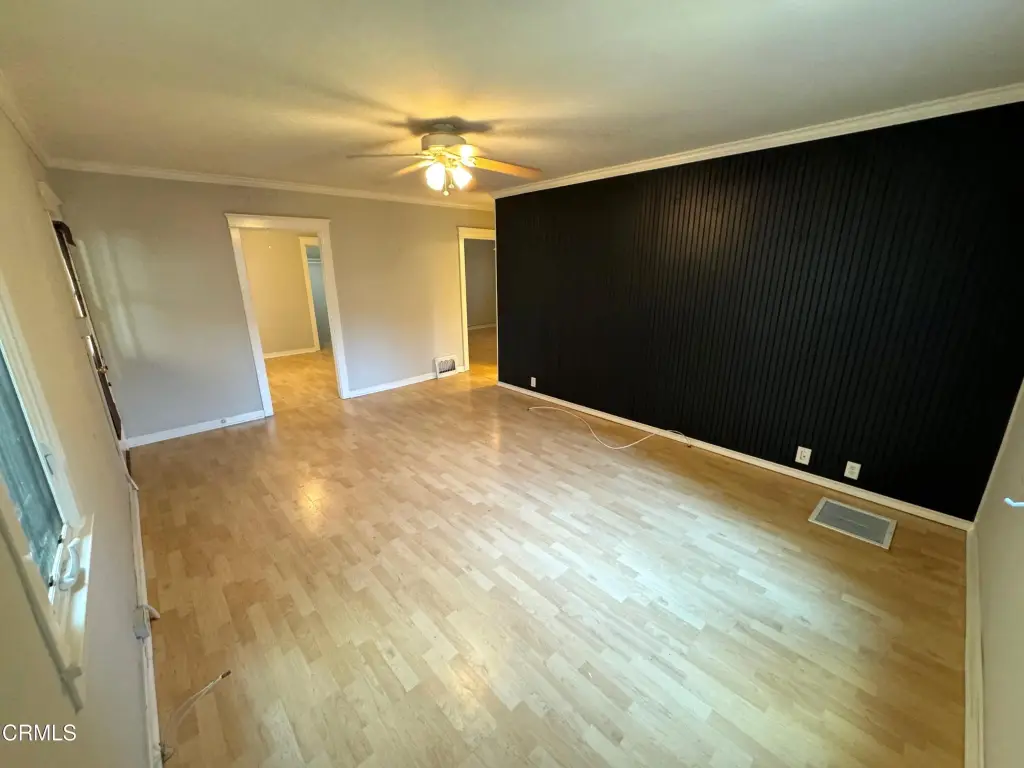
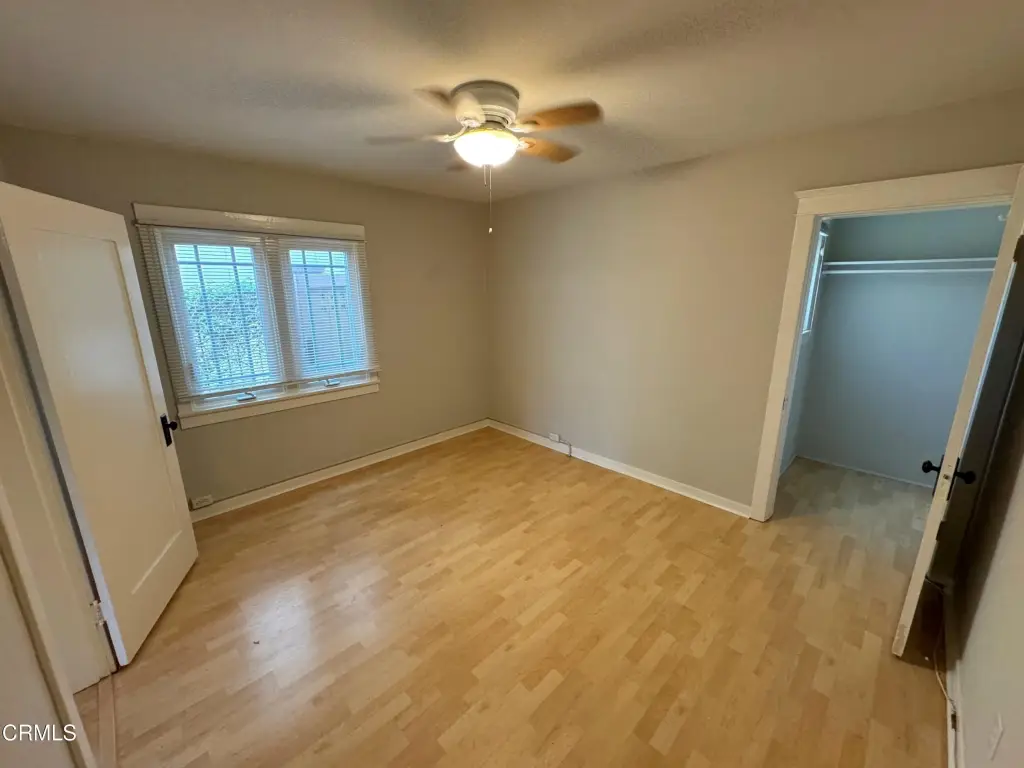
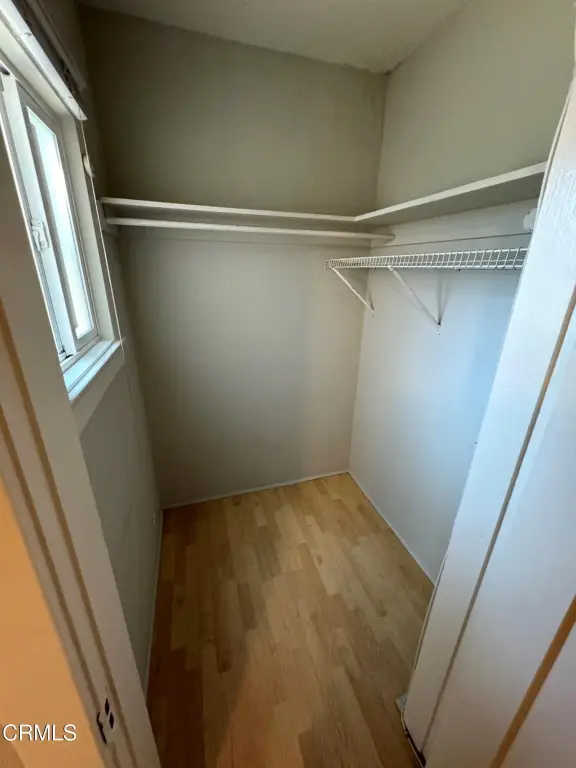
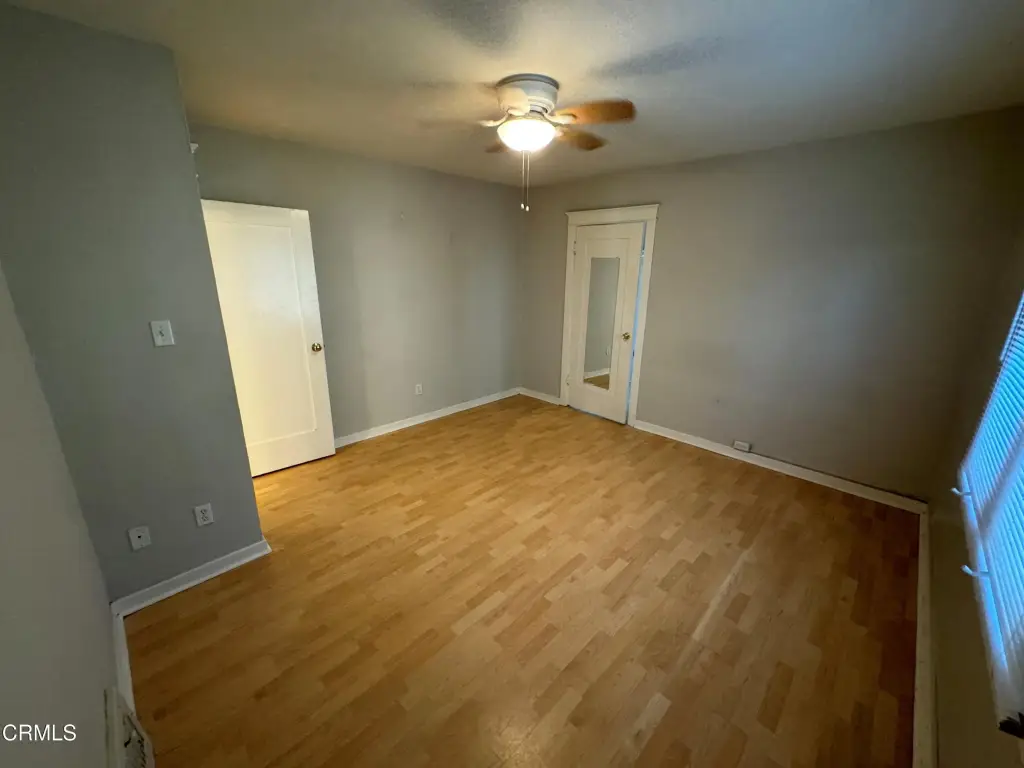
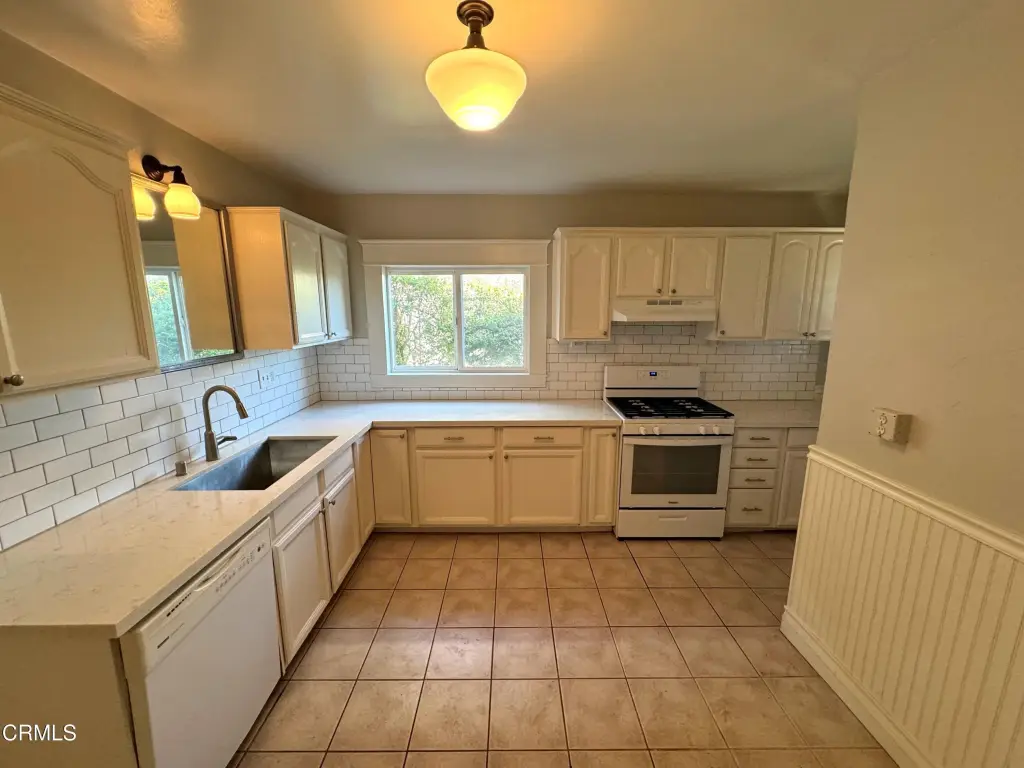
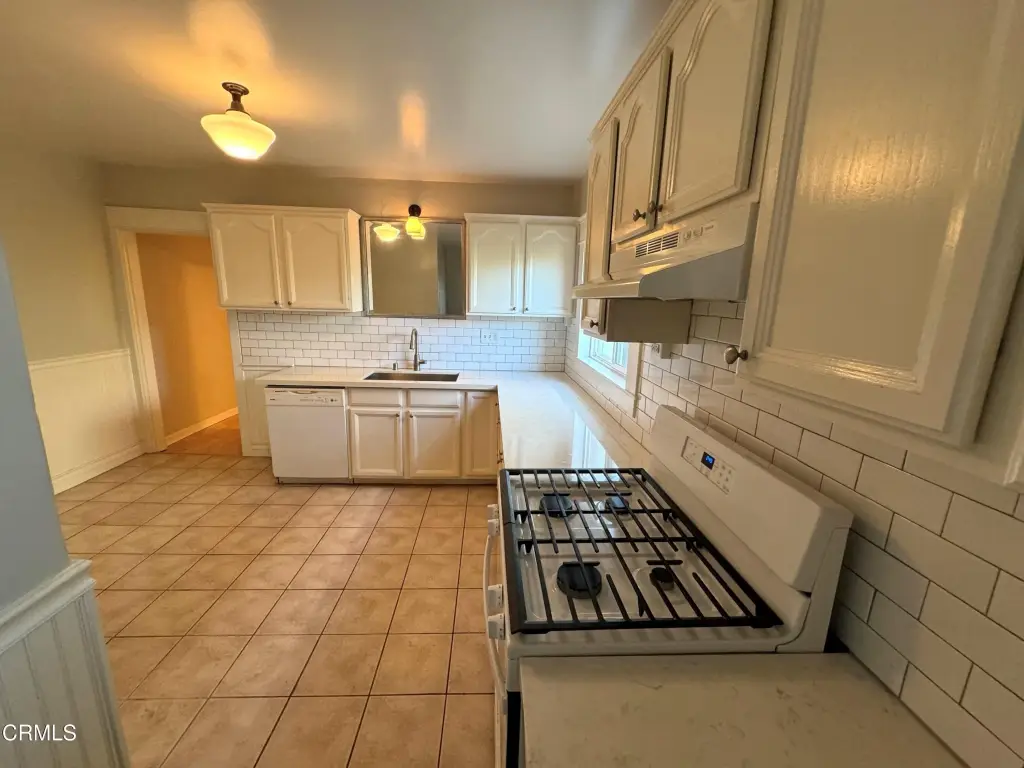
Brick Walls, Quartz Counters, Ceiling Fan(s), Storage, Crown Molding
Fencing
Brick
Appliances
Dishwasher, Gas Oven, Refrigerator
View
Water, Hills, Ocean
Elementary school district
Ventura Unified School District
Middle school district
Ventura Unified School District
High school district
Ventura Unified School District
Subdivision
VC24 - Ventura-Calif-Mills
Standard status
Active
APN
0730054020
Size
2,480 SF
Lot size
0.10 Acres
Utilities
Sewer type
Public Sewer
Heating system
Natural Gas
Water source
Public
Amenities
private outdoor space
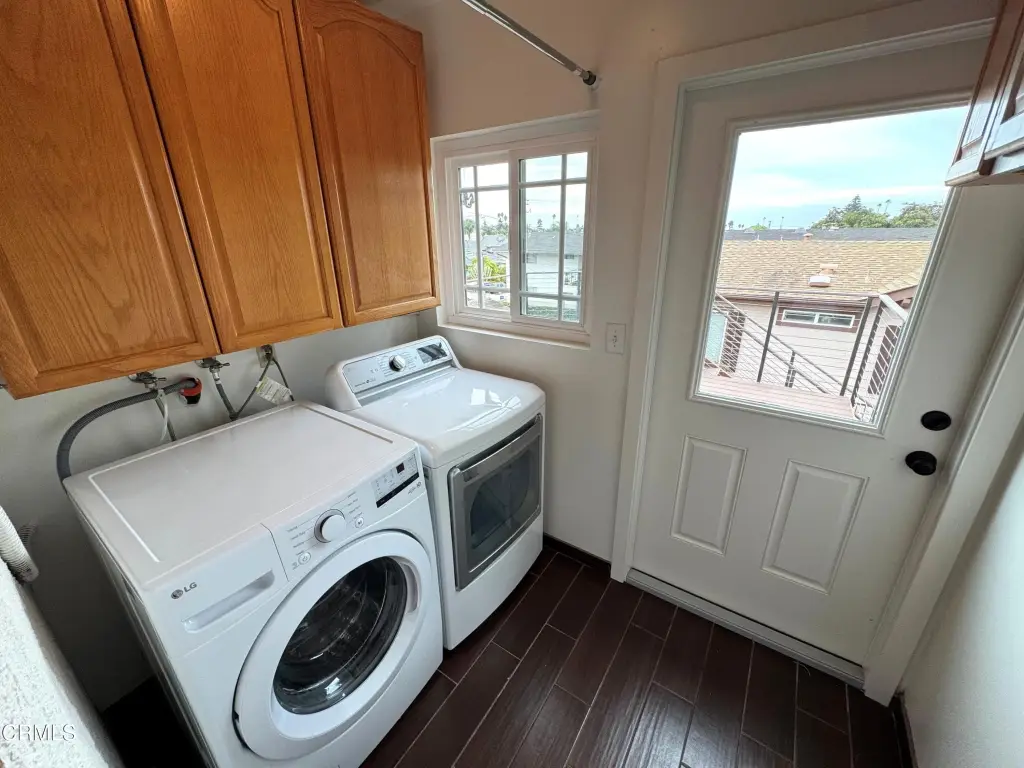
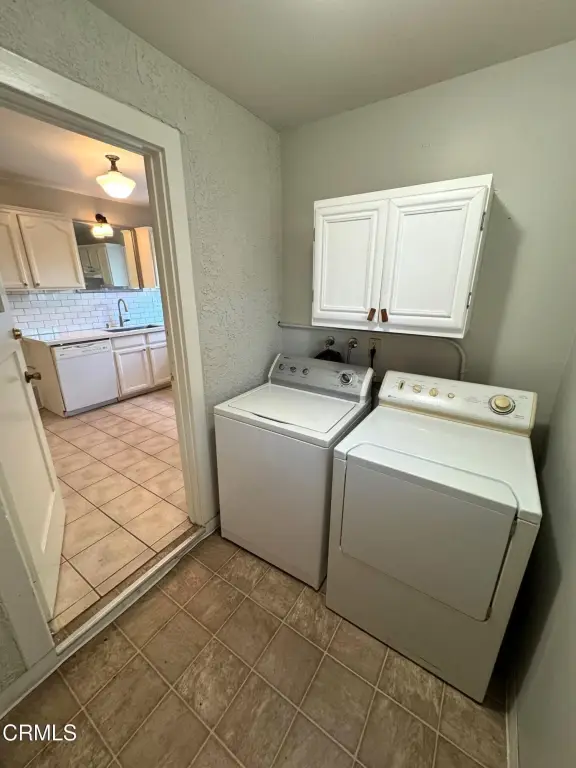
indoor laundry
fireplace
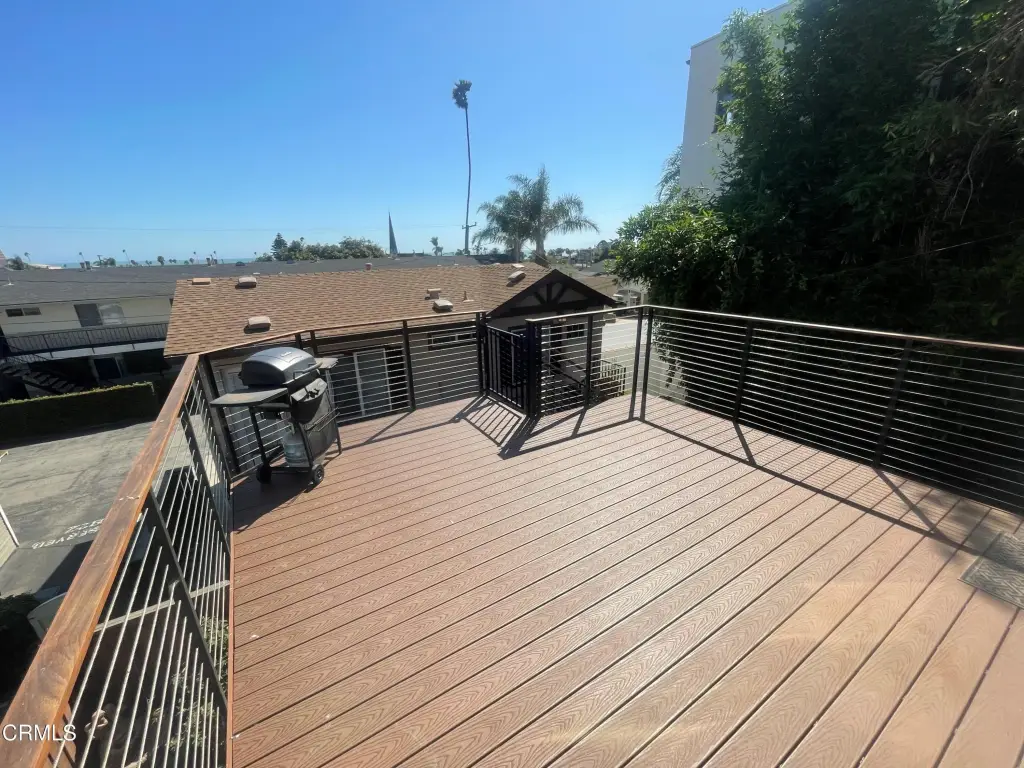
deck
ocean views
Building Details
Year built
1926
Flooring type
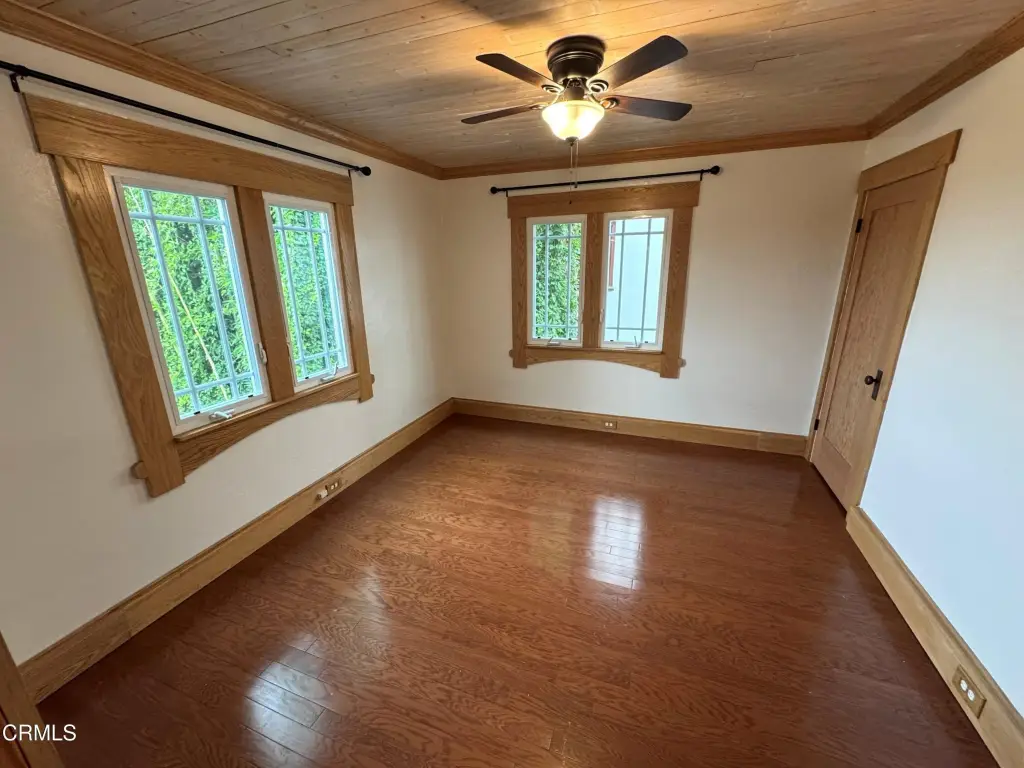
Tile, Laminate, Wood
Roof type
Flat, Tile, Shingle
Additional Structures
Storage
Listing Agency:
RE/MAX Gold Coast-Beach Office · RE/MAX International
(805) 216-4580
Listed By:
Billy Davidson · License #02154915
(805) 208-2871
Added: Aug 4
Changed: Sep 17
Last Checked: Oct 7 at 3:06AM
MLS# V1-38008
Copyright © 2026 California Regional MLS - Pasadena-Foothills and Ventura County Coastal. All rights reserved. All information provided by the listing agent/broker is deemed reliable but is not guaranteed and should be independently verified.
Investment Insights
Based on property information with market context.
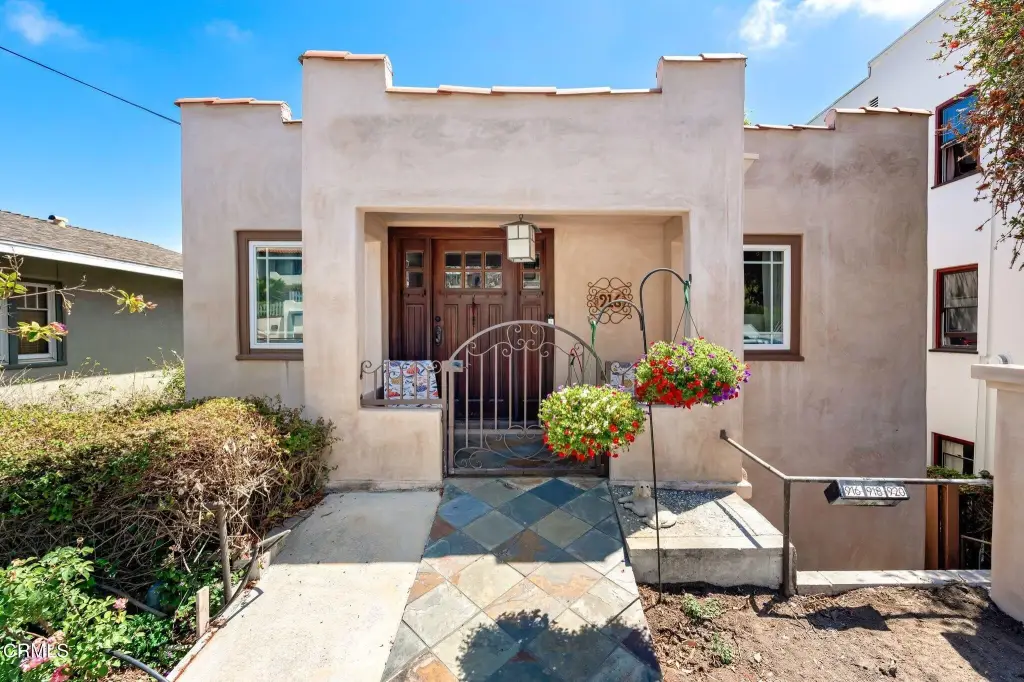
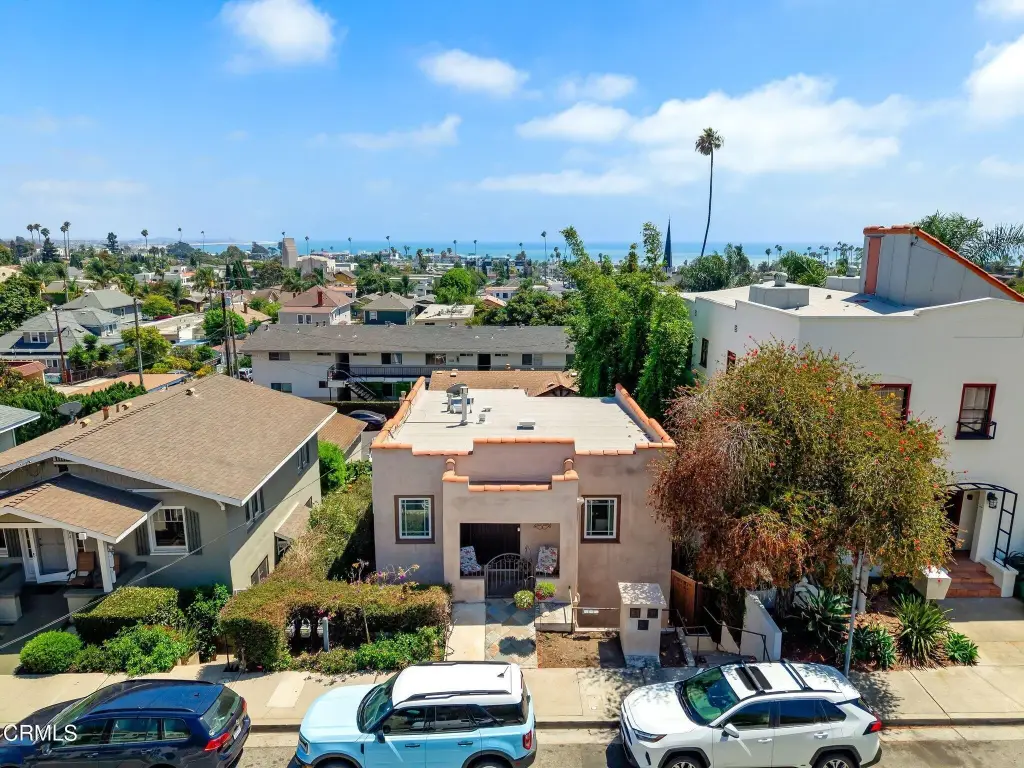
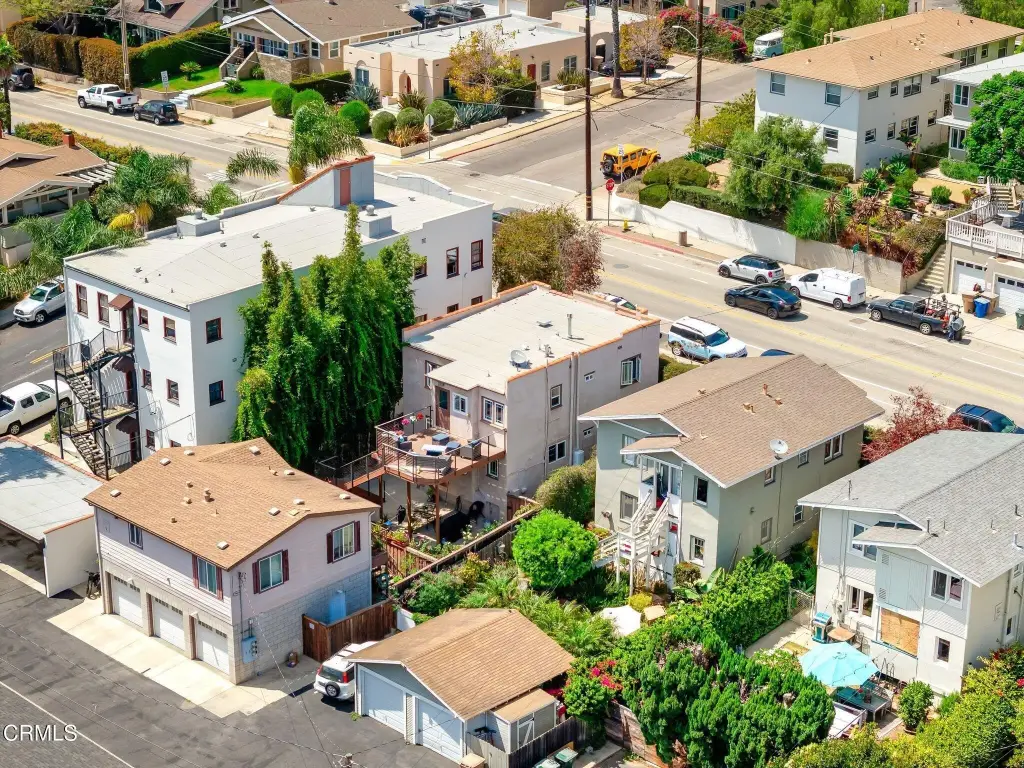
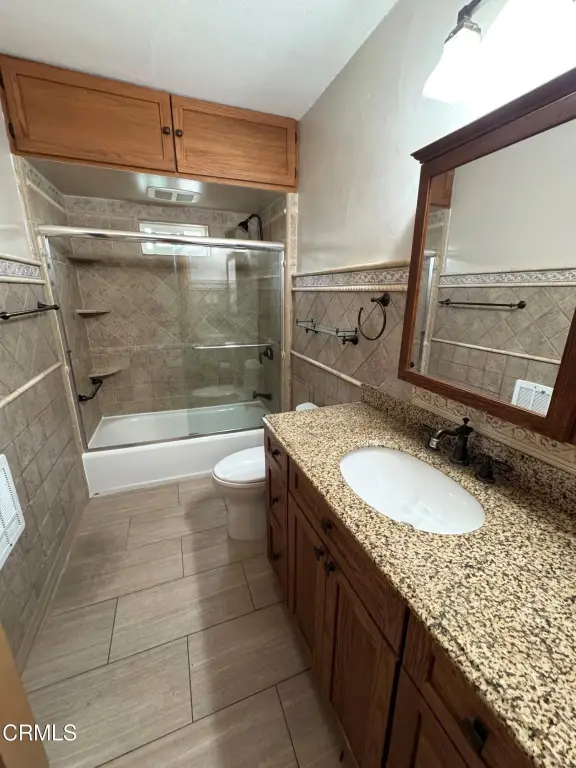
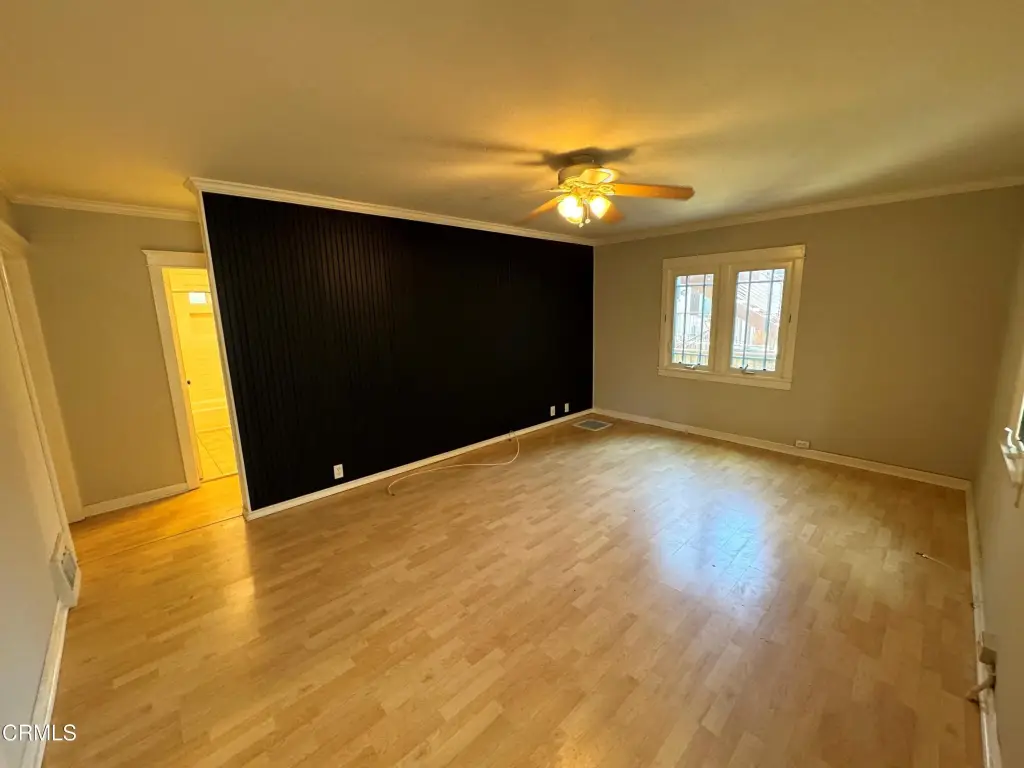
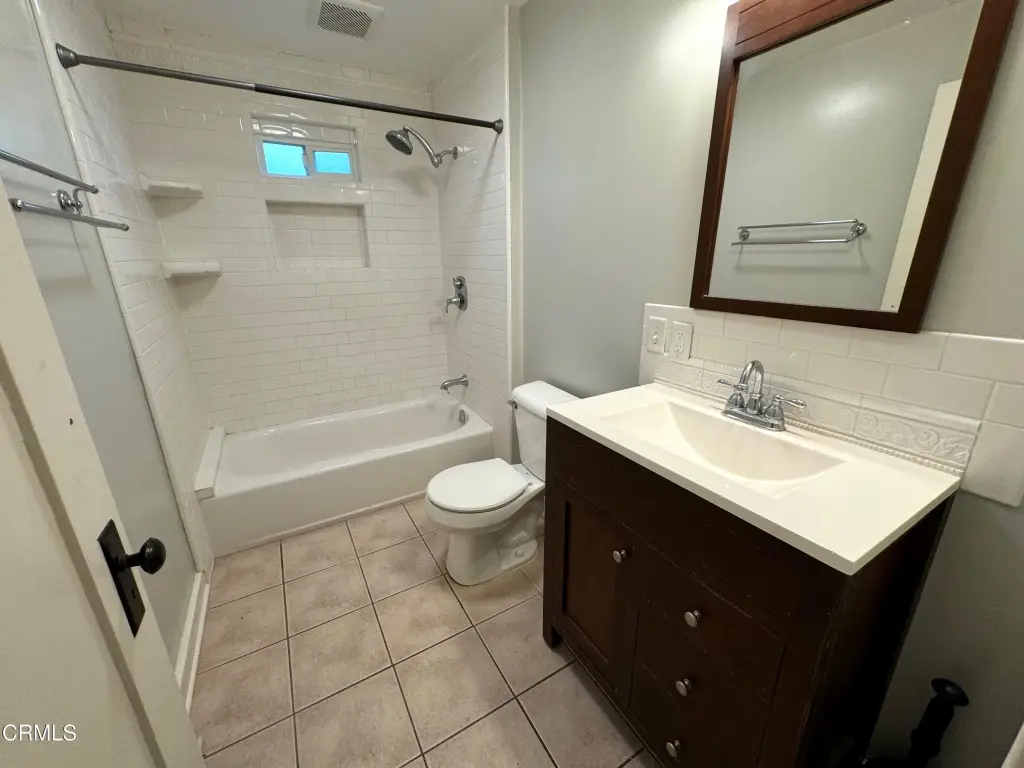
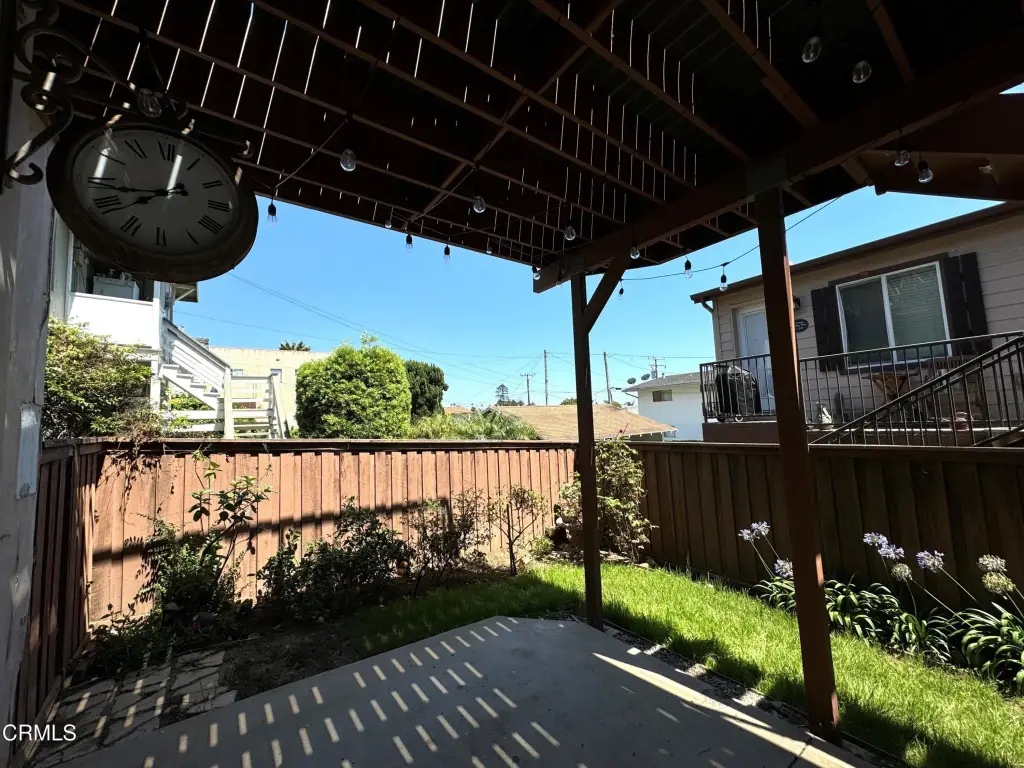
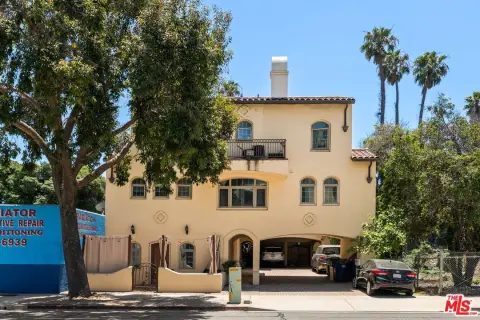
Located at 916 Poli Street, this 1926 triplex contains three distinct residences on a 0.1-acre parcel totaling 2,480 square feet. Each unit has private indoor laundry and outdoor space. The front residence includes original oak flooring, a fireplace, tongue-and-groove ceilings, custom plaster walls, a remodeled kitchen, and a renovated bathroom. Its 2020 Trex deck offers peekaboo ocean views and outdoor entertaining space.
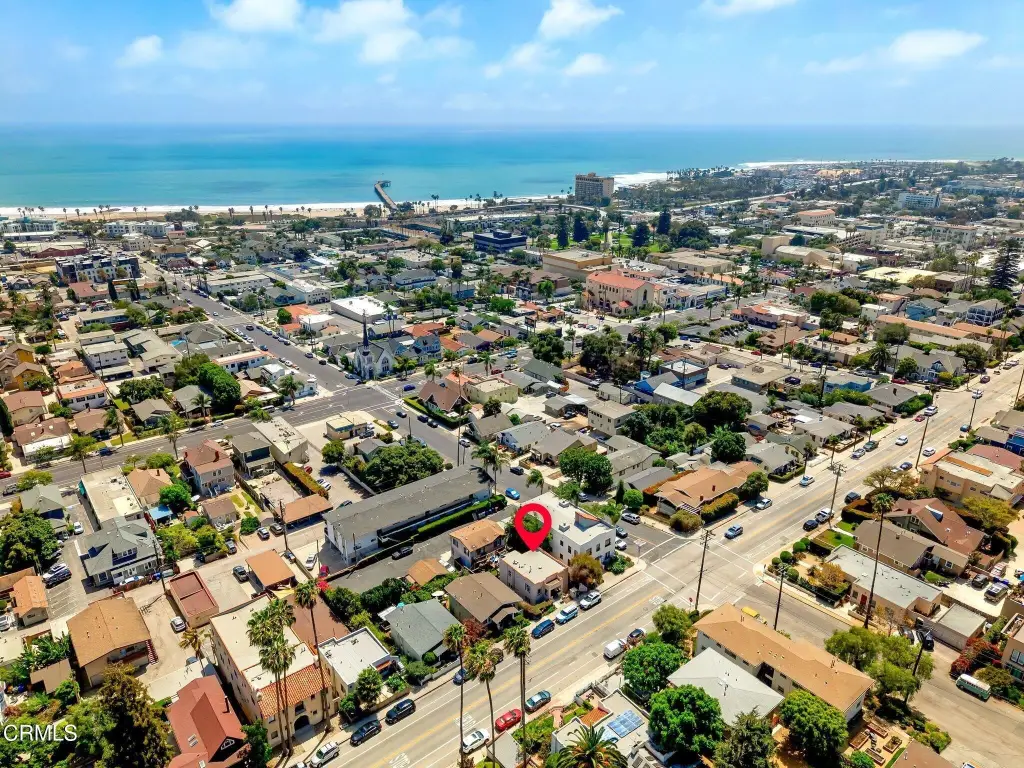
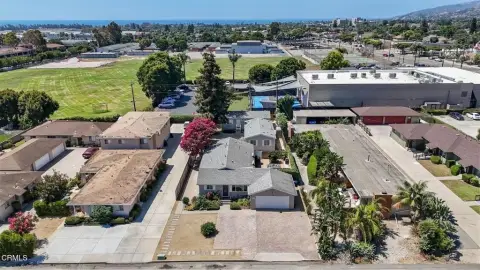
The lower residence, Unit 918, provides two bedrooms, one bathroom, and a private patio with garden area. Unit 920 is positioned above three single-car garages and offers another two-bedroom, one-bathroom layout. Additional property features include upgraded Milgard dual-pane windows, public water and sewer, assigned garage parking, and brick fencing. The triplex is near Downtown Ventura, the Ventura Pier, beaches, restaurants, coffee shops, boutique shopping, and the weekly farmers market.
The lower residence, Unit 918, provides two bedrooms, one bathroom, and a private patio with garden area. Unit 920 is positioned above three single-car garages and offers another two-bedroom, one-bathroom layout. Additional property features include upgraded Milgard dual-pane windows, public water and sewer, assigned garage parking, and brick fencing. The triplex is near Downtown Ventura, the Ventura Pier, beaches, restaurants, coffee shops, boutique shopping, and the weekly farmers market.
Key Highlights
- Three‑residence triplex built in 1926
- 2,480 square feet on a 0.1‑acre parcel
- Each residence includes private indoor laundry and outdoor space
Property Analytics
Unlock full access to Insights
Subscribe to Realmo Intelligence
Open Analytics
Current Use
Lease Details
3
Residential units
Location Intelligence
Trade Area within ½ mile
2,080
Businesses Nearby
Explore this area
Business Placement
Demographics for 93001, CA
33,859
Population
14,705
Households
2.3
Avg Household Size
40
Median Age
38%
College-Educated
88%
High-School Grad
96.6 sq mi
ZIP Area
351
Density / Sq Mi
$86,310
Median Household Income
$45,023
Median Earnings
$1,881
Median Rent
$760,700
Median Home Value
Check the figures for this property
Cap Rate, Value Estimation, Potential NOI and more
View Realmo Analytics
Market
Vacancy Rate% for Multifamily in West region

Questions? Ask Rey
Realmo’s AI knows this listing — price, zoning, demand, history. Ask anything.





Frequently Asked Questions
What type of property is this?
Triplex - Three residences include private laundry and updated interiors near Downtown Ventura.
Where is this triplex located?
The property is located at 916 Poli Street Ventura, CA.
What is the asking price?
The asking price for this property is $1,600,000.
What are key features of this property?
This property features: Three‑residence triplex built in 1926; 2,480 square feet on a 0.1‑acre parcel; Each residence includes private indoor laundry and outdoor space