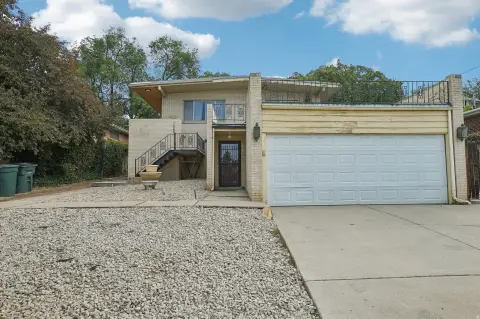
Duplex with New
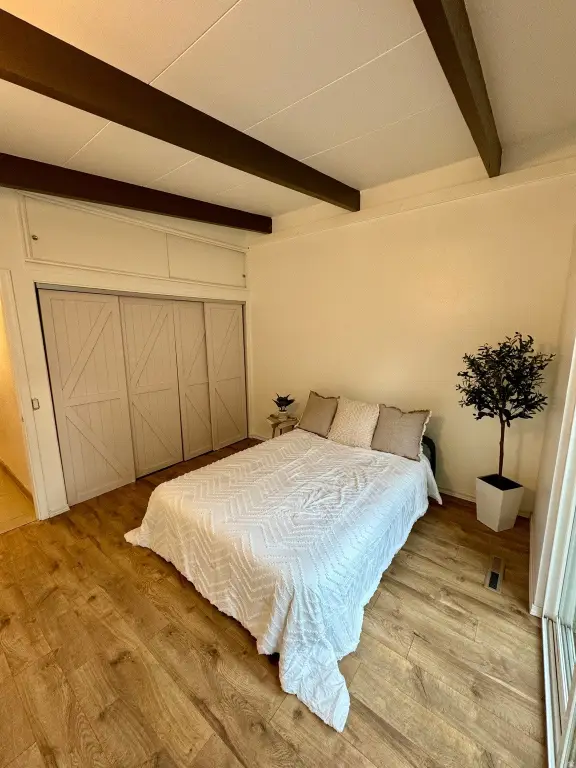
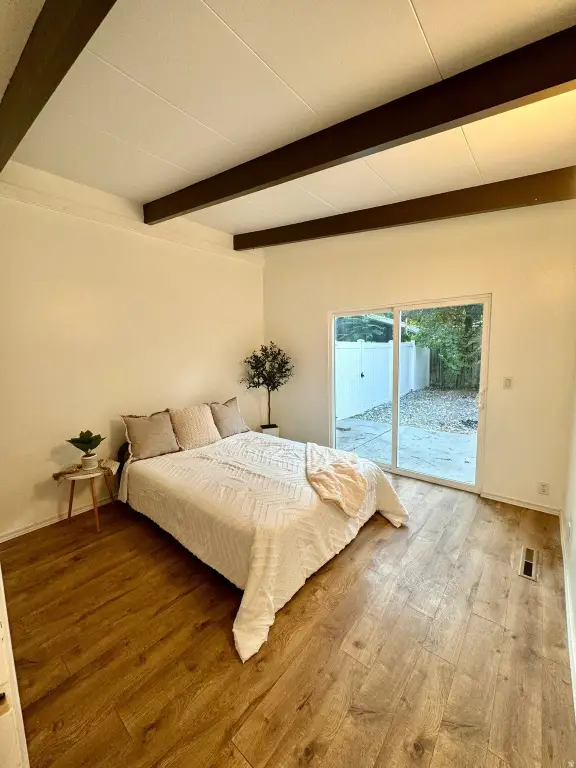
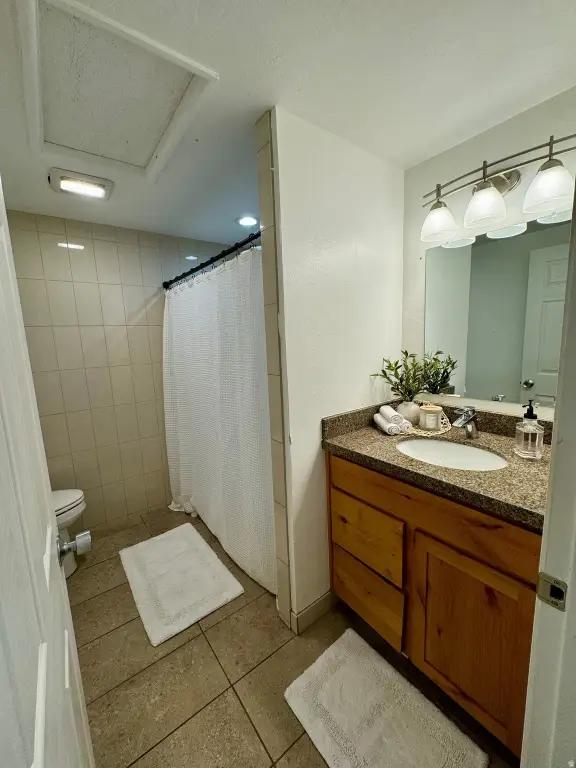

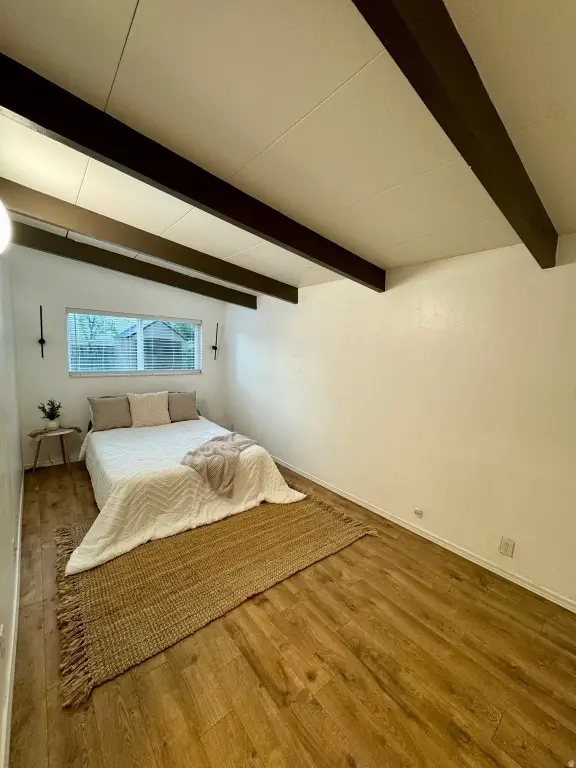
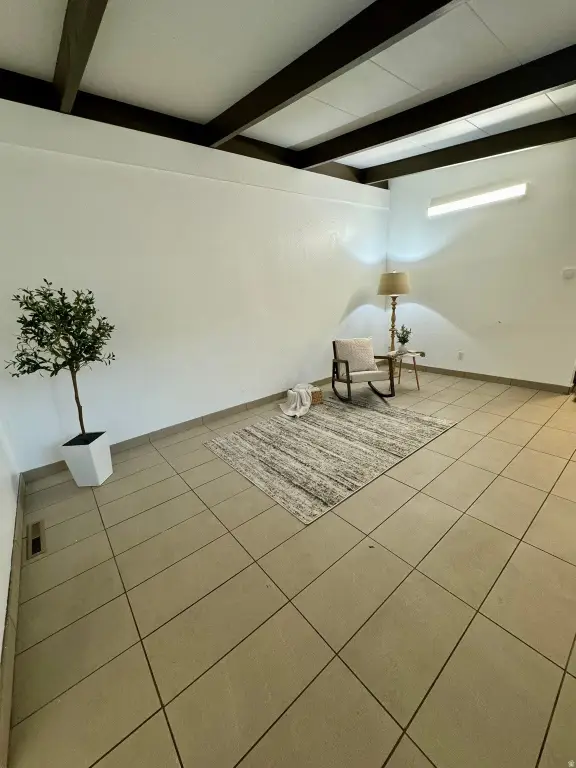
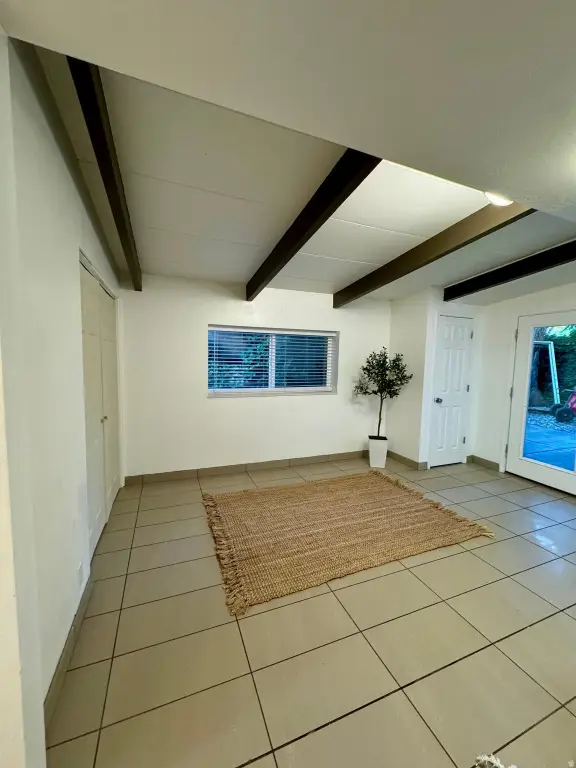
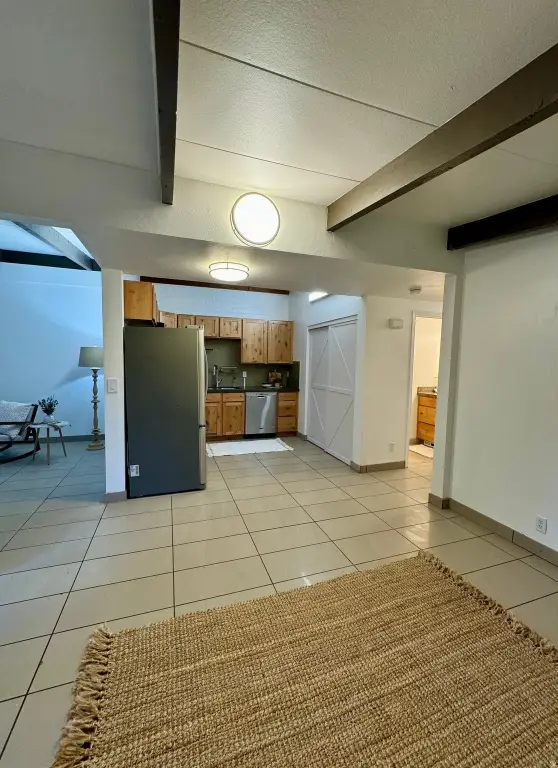
For Sale
$720,000
3366 S 700 E, Salt Lake City, UT 84106
Residential, Salt Lake City, UT
Property Size2,200 SF
Lot Size0.18 Acres
Price / SF$327.27
Days on Market338
Property Features for 3366 S 700 E
General Information
Property type
Residential Multi Family
Property subtype
Duplex
Zoning
Multi-Family
Zoning description
1108
Bedrooms
4
Bathrooms
4
Full bathrooms
4
Rooms
Bathroom 4, Bedroom 3, Bedroom 1, Bedroom 2, Bathroom 2, Bathroom 1, Bathroom 3, Bedroom 4
Parking
10
Parking features
Covered
Window features
Blinds
Patio and Porch features
Porch, Patio
Interior features
Disposal, Range/Oven: Free Stdng., Vaulted Ceilings, Dishwasher: Built-In
Exterior features
Double Pane Windows, Porch: Open, Skylights, Sliding Glass Doors, Patio: Open
Subdivision
BIG FIELD SUR
Lot features
Fenced: Part, Secluded, Sidewalks, Private
Elementary school
Lincoln
Middle school
Granite Park
High school
Cottonwood
Elementary school district
Granite
Middle school district
Granite
High school district
Granite
Standard status
Active
APN
16-29-352-008
Size
2,200 SF
Lot size
0.18 Acres
Taxes and HOA fees
Tax Annual Amount
2500
Utilities
Heating system
Central, Natural Gas, Forced Air
Building Details
Year built
1960
Number of units
2
Flooring type
Hardwood, Tile
Building materials
Brick, Cinder Block, Composition
Roof type
Membrane
Architectural style
Other
Listing Agency:
Equity Real Estate (Results)
(801) 610-9394
Listed By:
Shantell Douros
(800) 785-9995
Added: Nov 3, 2025
Changed: Oct 2
Last Checked: Oct 7 at 6:06PM
MLS# 2121046
Copyright © 2026 UtahRealEstate.com. All rights reserved. All information provided by the listing agent/broker is deemed reliable but is not guaranteed and should be independently verified.
Investment Insights
Based on property information with market context.
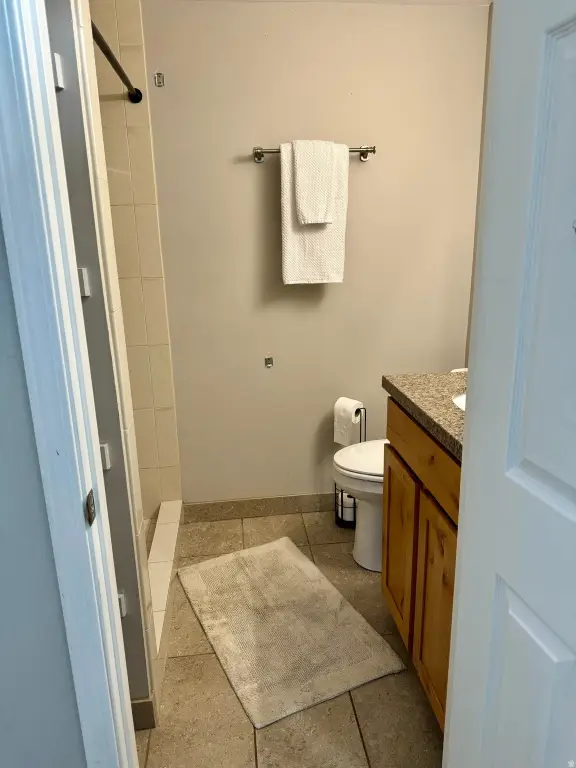
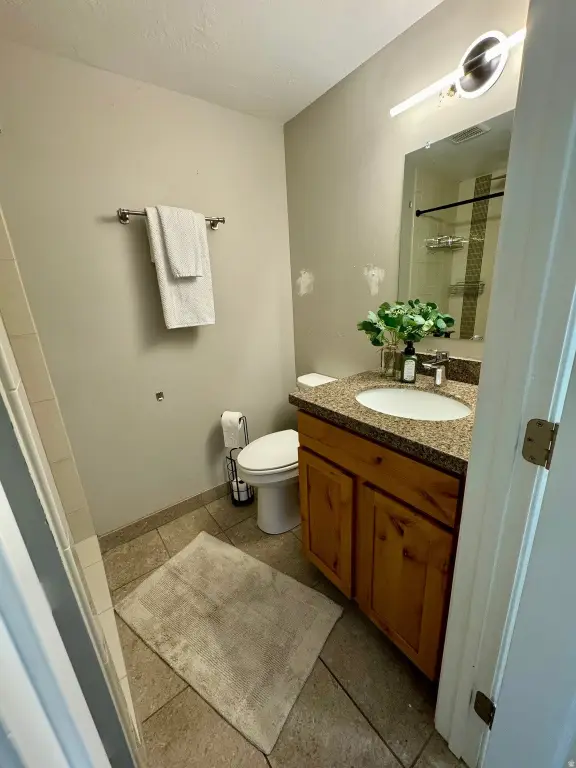
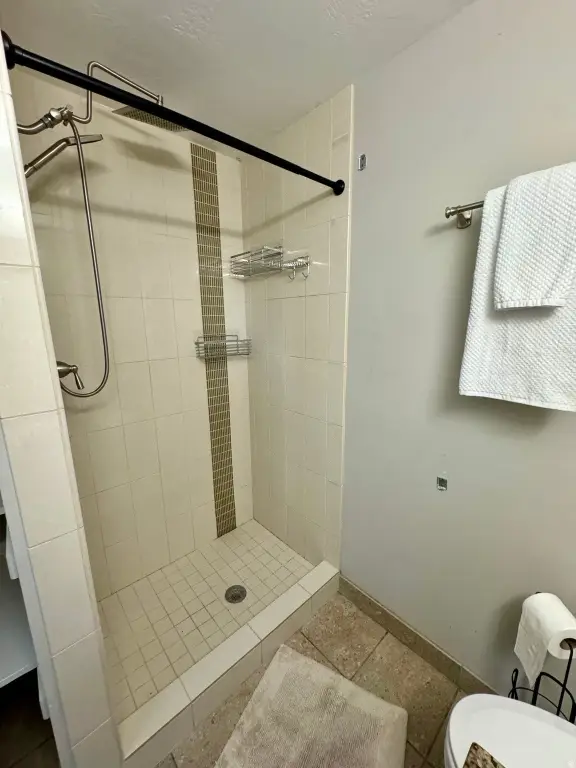
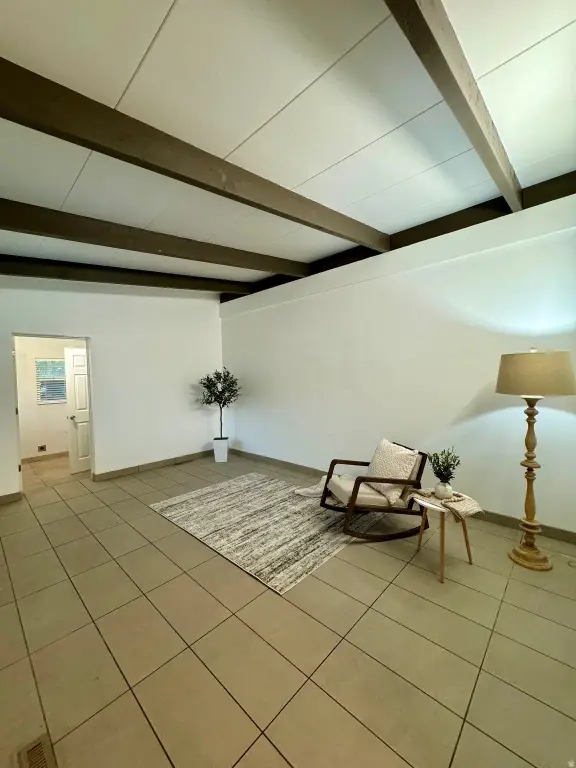
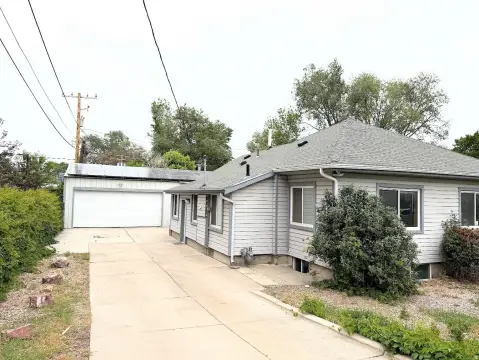
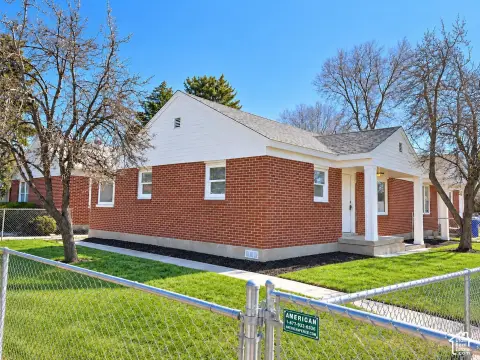
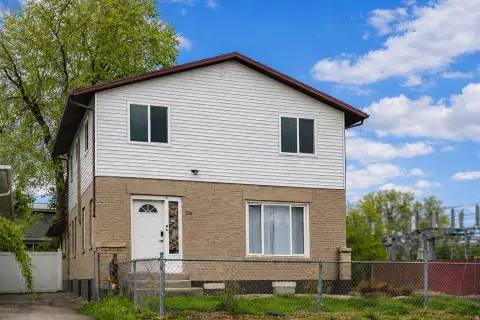
This Salt Lake City duplex contains two residential units totaling 2,200 square feet on a 0.18-acre lot. Both units feature open floor plans, solid-surface countertops, stainless steel appliances, hardwood and tile flooring, and washer and dryer hookups. One unit includes a washer and dryer. A new roof was installed across the building within the last 6 months. Additional features include vaulted ceilings, double-pane windows, skylights, open patio and porch areas, covered parking, and forced-air central heating powered by natural gas.
The property is zoned Multi-Family and is located near Nibley Park, with Sugar House also identified as nearby for dining and entertainment. A vinyl fence divides the two yards, providing separate outdoor areas for each unit. Both units are occupied by renters with leases in place.
The property is zoned Multi-Family and is located near Nibley Park, with Sugar House also identified as nearby for dining and entertainment. A vinyl fence divides the two yards, providing separate outdoor areas for each unit. Both units are occupied by renters with leases in place.
Key Highlights
- Two‑unit duplex with 2,200 square feet on a 0.18‑acre lot
- New roof installed on the entire building within the last 6 months
- Both units have renters with leases in place
Financial Insights
Estimated NOI and Cap Rate
NOI / Yr
$29,339
Cap Rate
4.07%
Suggested Prices Based on Cap Rates
Cap Rate 5%
$586,780
$586.8K
Cap Rate 7%
$419,129
$419.1K
Cap Rate 9%
$325,989
$326.0K
Market Conditions
NOI Build-Up for 2,200 SF
Gross rent
$44.4K $20.16/SF
− Vacancy
−$2.4K −$1.11/SF
EGI
$41.9K $19.05/SF
− OpEx
−$12.6K −$5.72/SF
NOI
$29.3K $13.34/SF
Area
Salt Lake City, UT
Vacancy
5.50%
Lease Rate
$20.16 /SF/Yr
Expense Ratio
30.00%
Simulate Cap Rate and NOI
Suggested Prices Based on Cap Rates
Cap Rate 5%
$586,780
Cap Rate 7%
$419,129
Cap Rate 9%
$325,989
Alternative Uses
Best Use
Multifamily LT 5
$419.1K
$366.7K – $489.0K
NOI $29,339 @ 7.0% cap · market cap 4.07%
Second Best
Apartment 5plus
$389.4K
$340.7K – $454.3K
NOI $27,255 @ 7.0% cap · market cap 3.79%
Theoretical Best
Office A
$592.7K
$518.6K – $691.5K
NOI $41,490 @ 7.0% cap · market cap 5.76%
Zoning and permitted uses should be independently verified with authorities.
Property Analytics
Unlock full access to Insights
Subscribe to Realmo Intelligence
Open Analytics
Current Use
Lease Details
2
Residential units
100%
Occupancy
Multi-tenant
Tenancy
Location Intelligence
Trade Area within ½ mile
843
Businesses Nearby
Explore this area
Business Placement
Demographics for 84106, UT
35,892
Population
16,782
Households
2.1
Avg Household Size
35
Median Age
57%
College-Educated
97%
High-School Grad
6.0 sq mi
ZIP Area
5,982
Density / Sq Mi
$94,452
Median Household Income
$56,358
Median Earnings
$1,576
Median Rent
$529,100
Median Home Value
Check the figures for this property
Cap Rate, Value Estimation, Potential NOI and more
View Realmo Analytics
Market
Vacancy Rate% for Multifamily in West region

Questions? Ask Rey
Realmo’s AI knows this listing — price, zoning, demand, history. Ask anything.


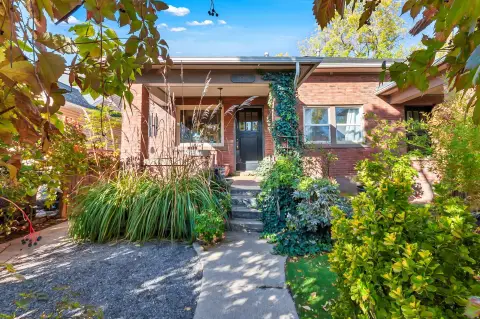

Frequently Asked Questions
What type of property is this?
Duplex - Each unit includes an open layout, solid-surface counters, and stainless steel appliances.
Where is this duplex located?
The property is located at 3366 S 700 E Salt Lake City, UT.
What is the asking price?
The asking price for this property is $720,000.
What are key features of this property?
This property features: Two‑unit duplex with 2,200 square feet on a 0.18‑acre lot; New roof installed on the entire building within the last 6 months; Both units have renters with leases in place


