Dual-Frontage Office
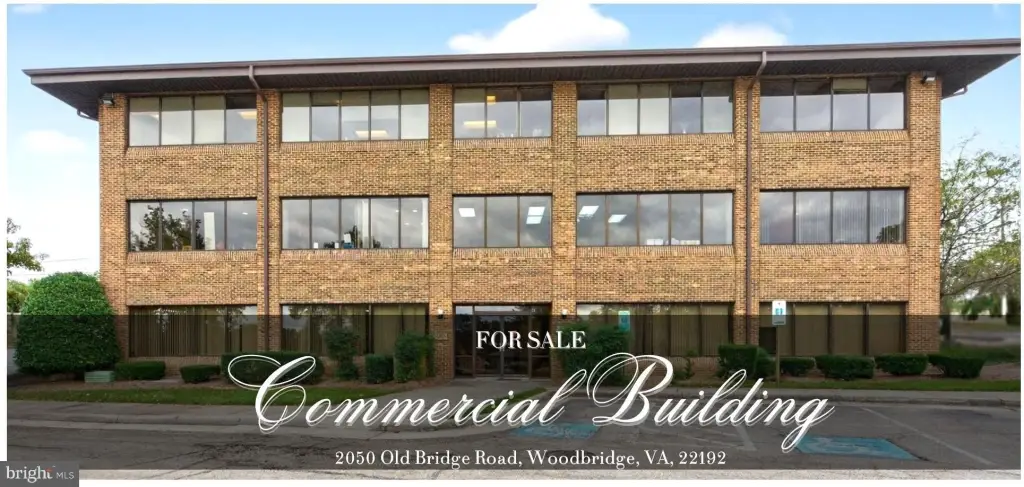
2050 OLD BRIDGE Road Woodbridge, VA 22192


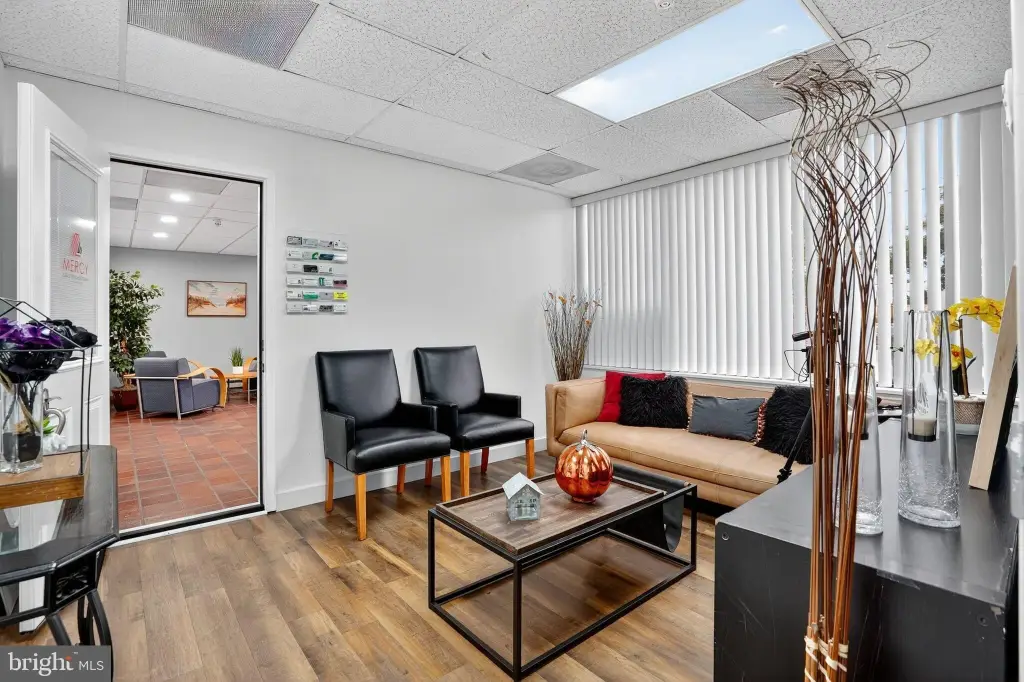
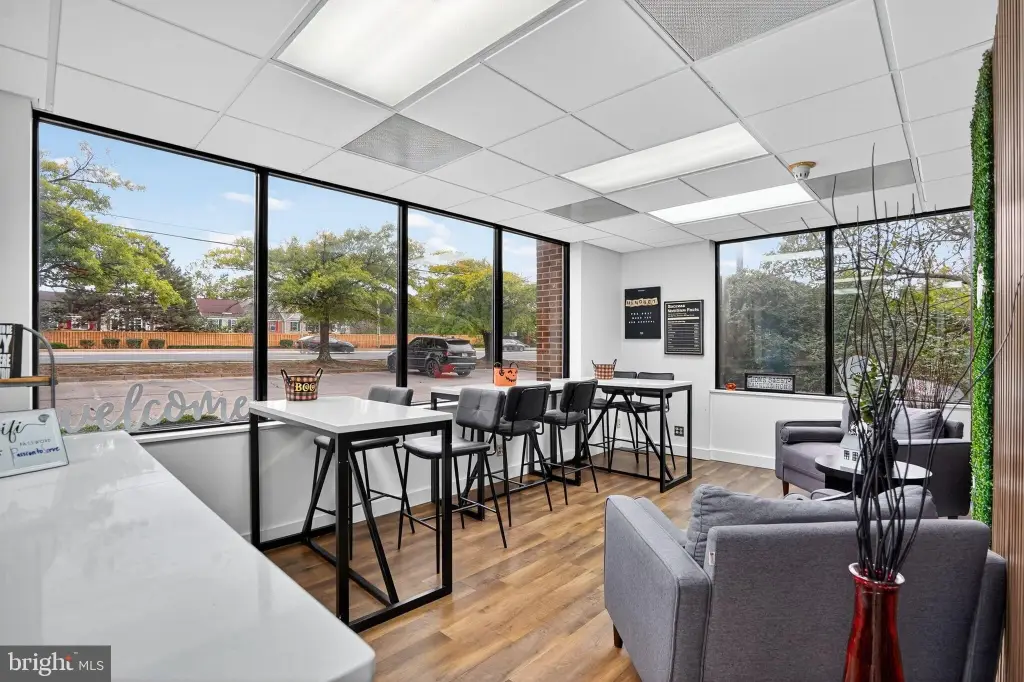
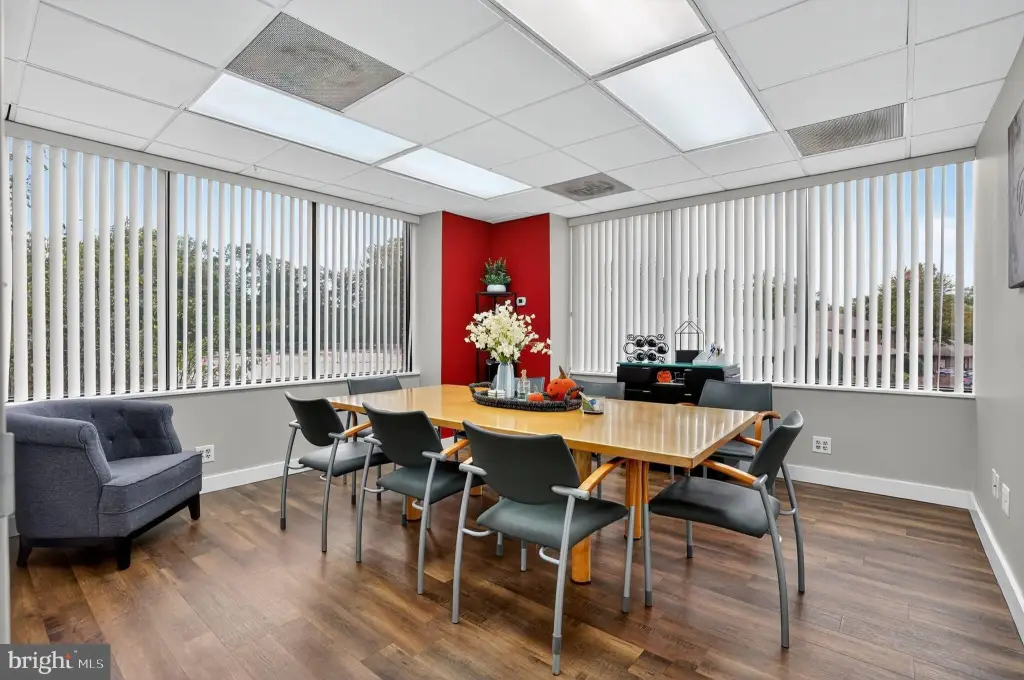
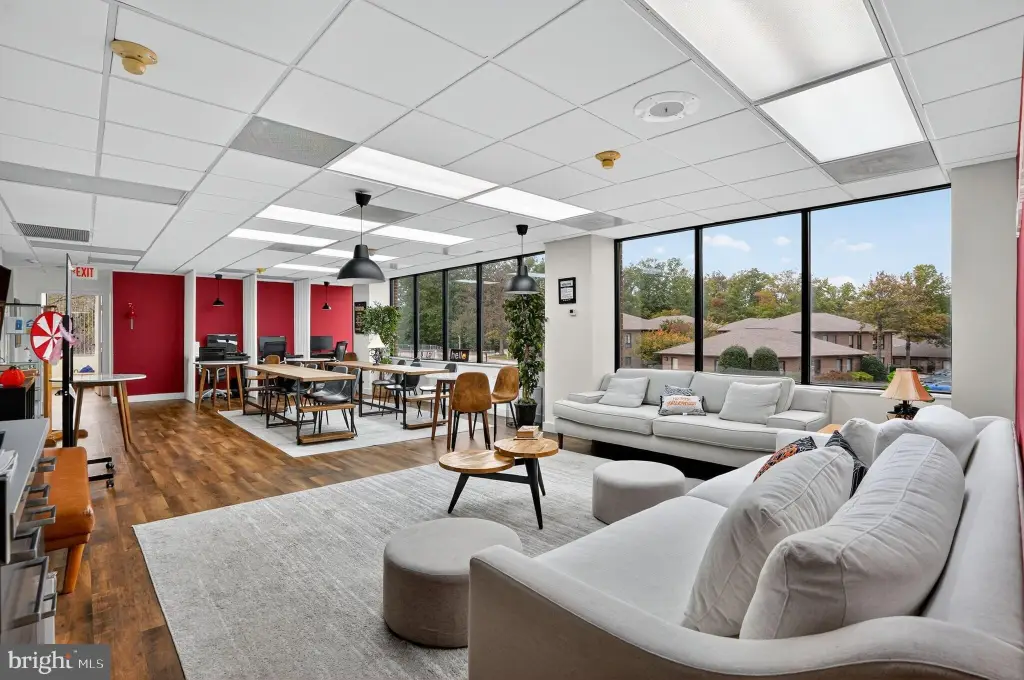



For Sale
$3,800,000
Commercial Sale - WOODBRIDGE, VA
Property Size15,000 SF
Price / SF$253.33
Days on Market291
Property Features for 2050 OLD BRIDGE Road
General Information
- Property type
- Other
- Property subtype
- Office
- Parking
- 36
- Parking features
- Parking Lot
- Standard status
- Active
- Size
- 15,000 SF
Taxes and HOA fees
- Tax Annual Amount
- 27431
Utilities
- Heating system
- Forced Air
- Cooling system
- Central Air
Building Details
- Year built
- 1986
- Building materials
- Brick
Listing Agency:
Casals Realtors
(703) 348-3911
Listed By:
Mercy F Lugo-Struthers · License #0225190414
(703) 861-6510
Added: Oct 10, 2025
Changed: Jun 9
Last Checked: Jul 27 at 12:06AM
MLS# VAPW2105392
Copyright © 2026 Bright MLS. All rights reserved. All information provided by the listing agent/broker is deemed reliable but is not guaranteed and should be independently verified.
Investment Insights
Based on property information with market context.
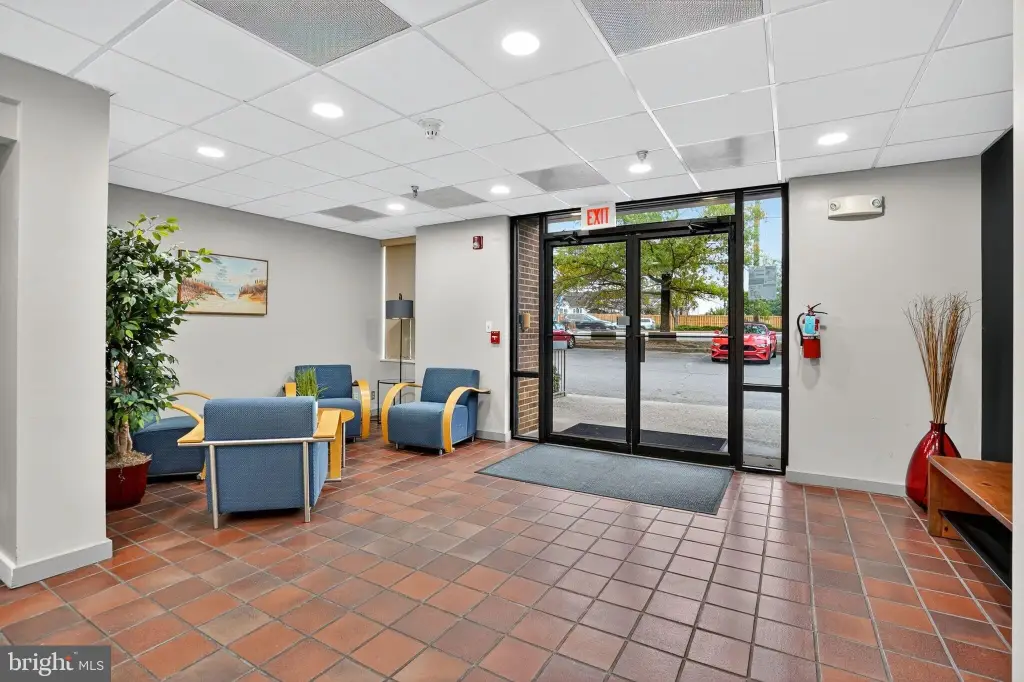
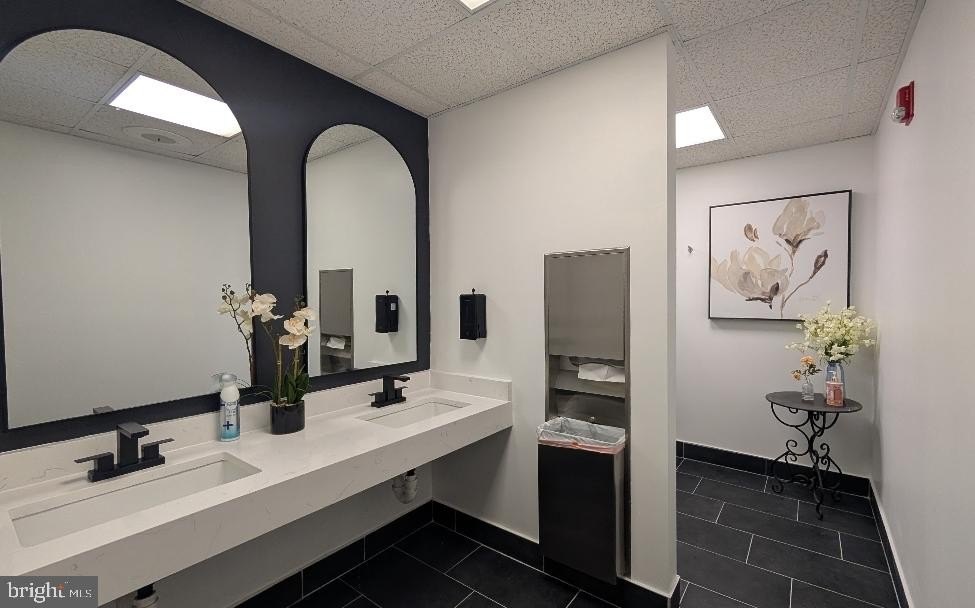
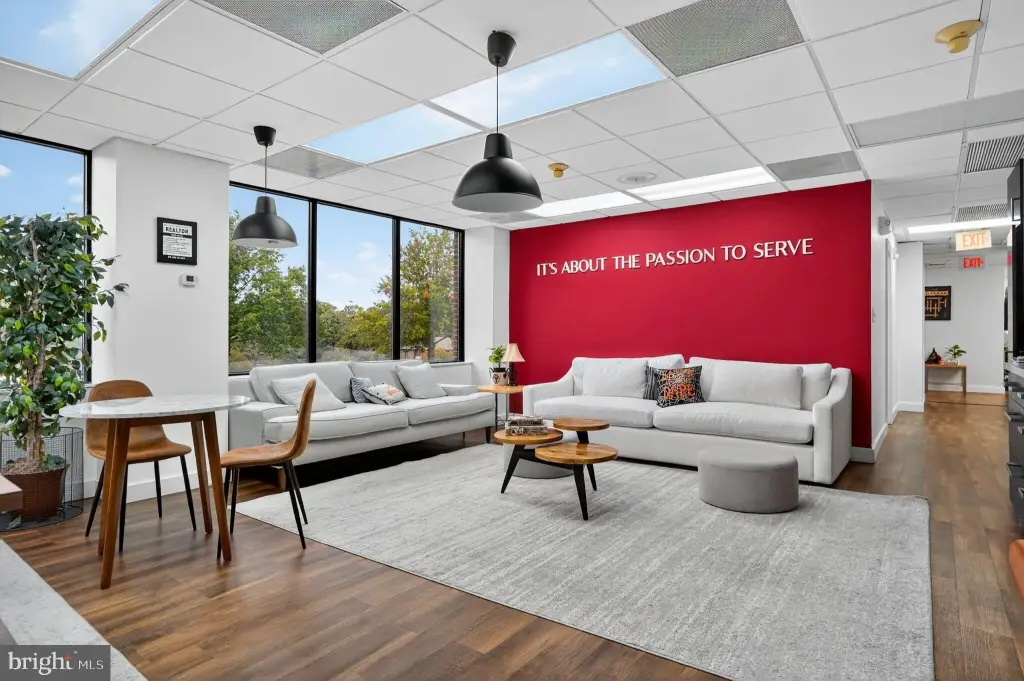
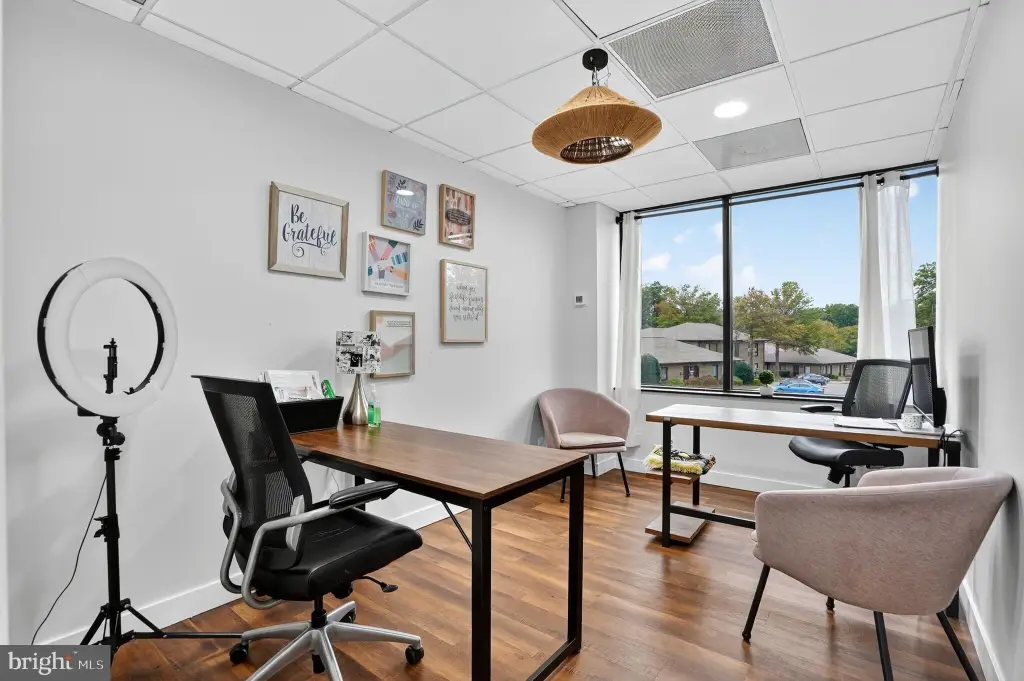
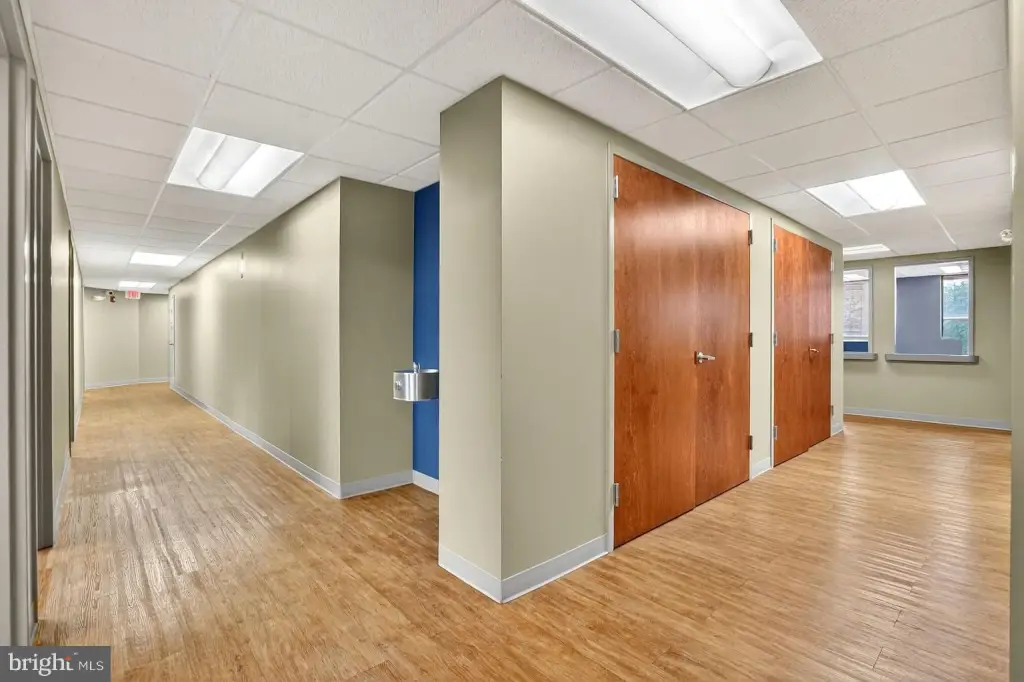
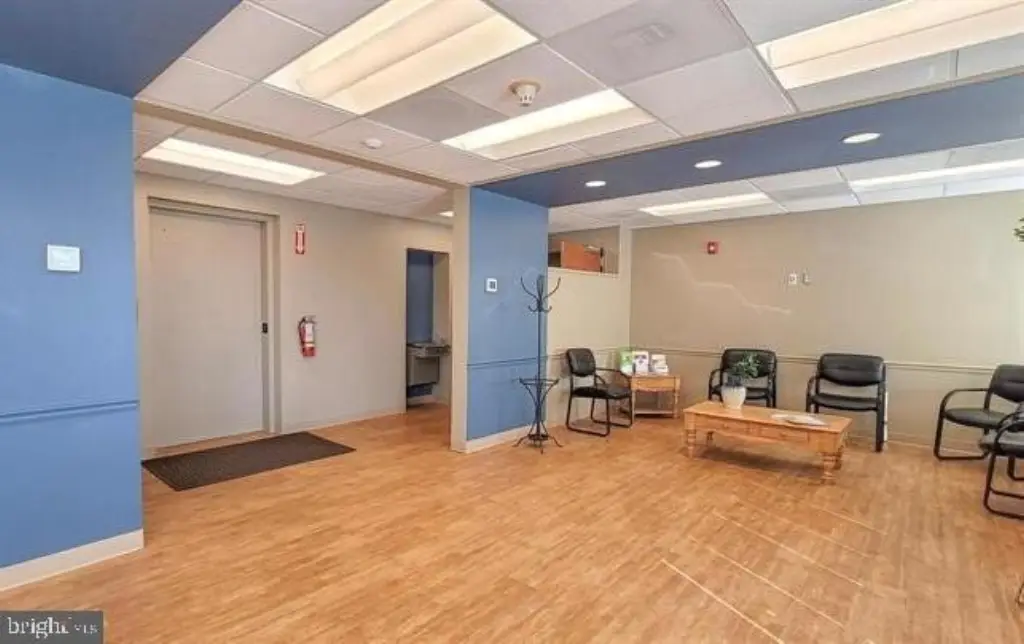
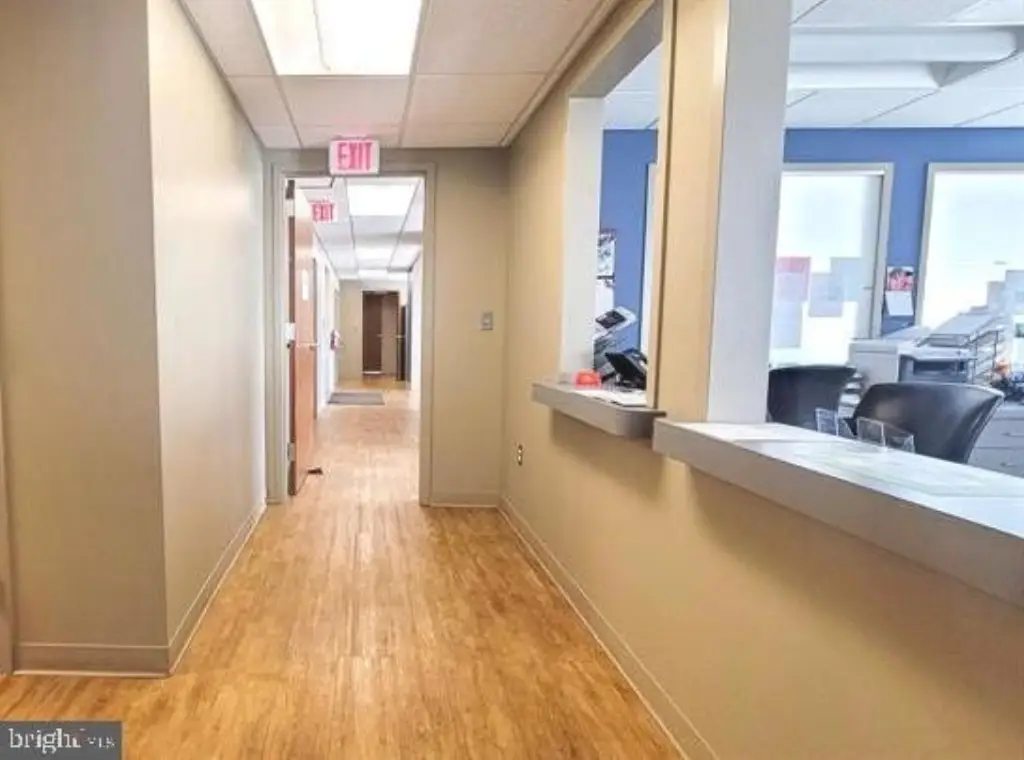
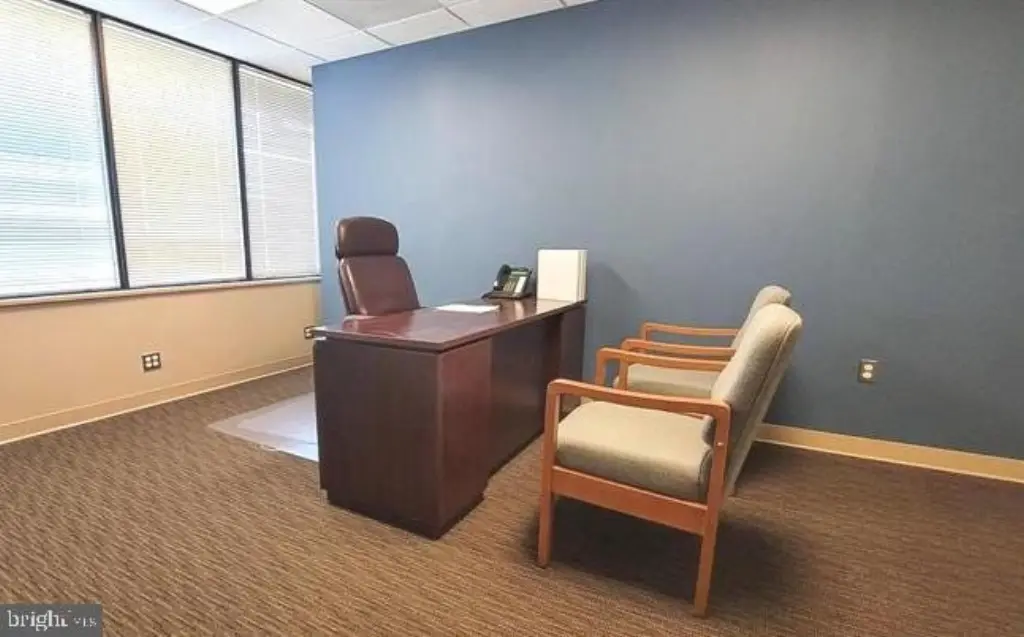
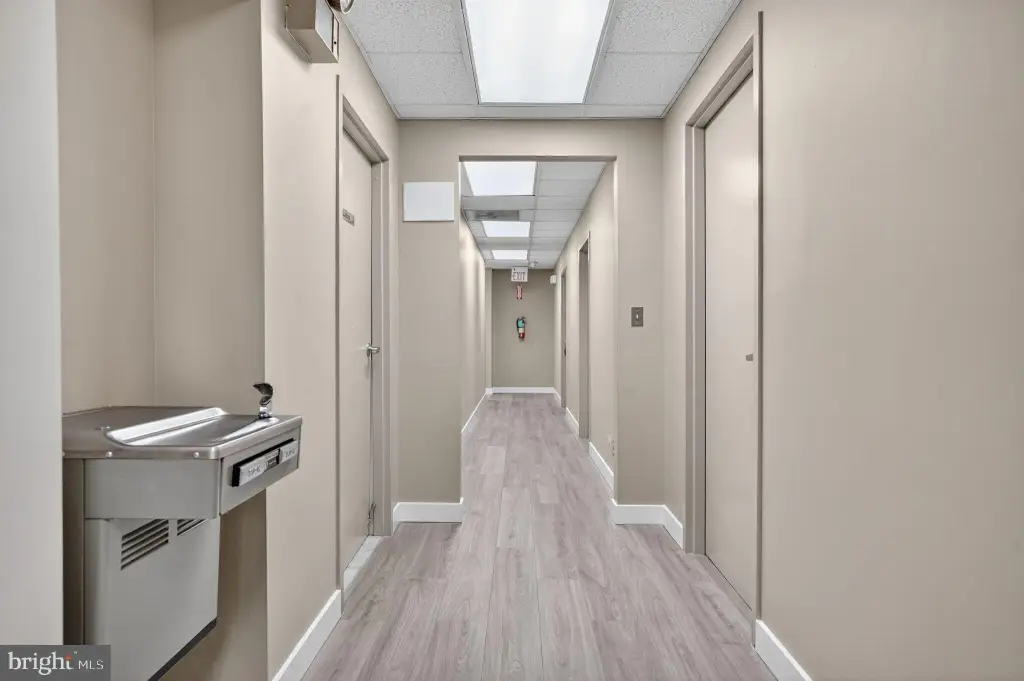
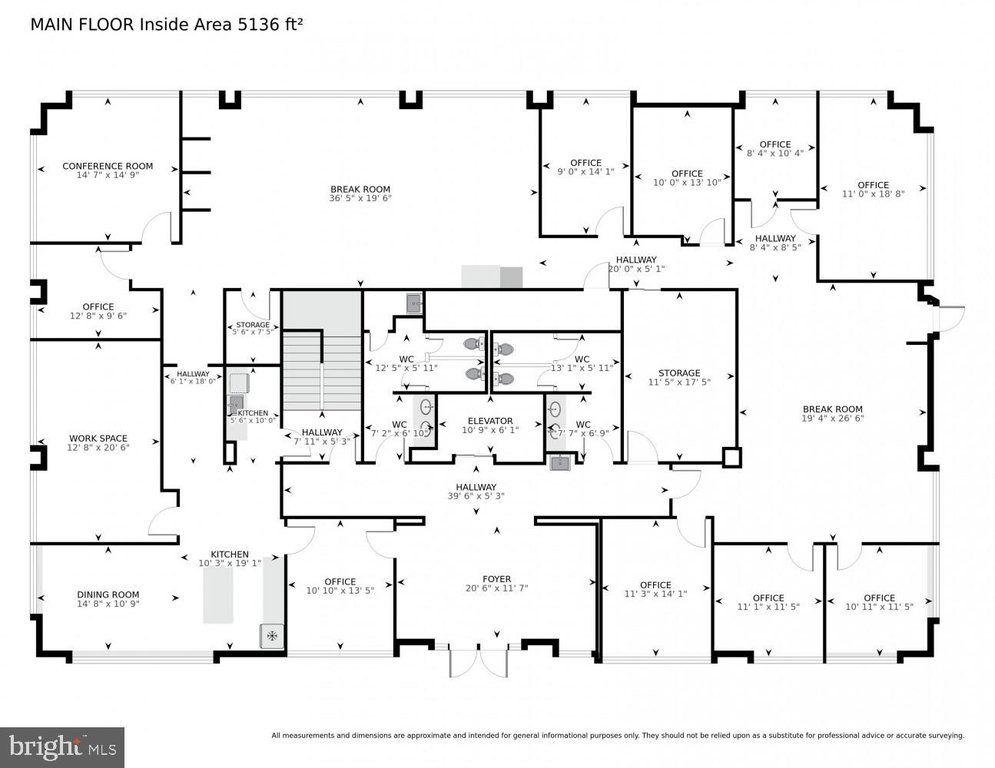
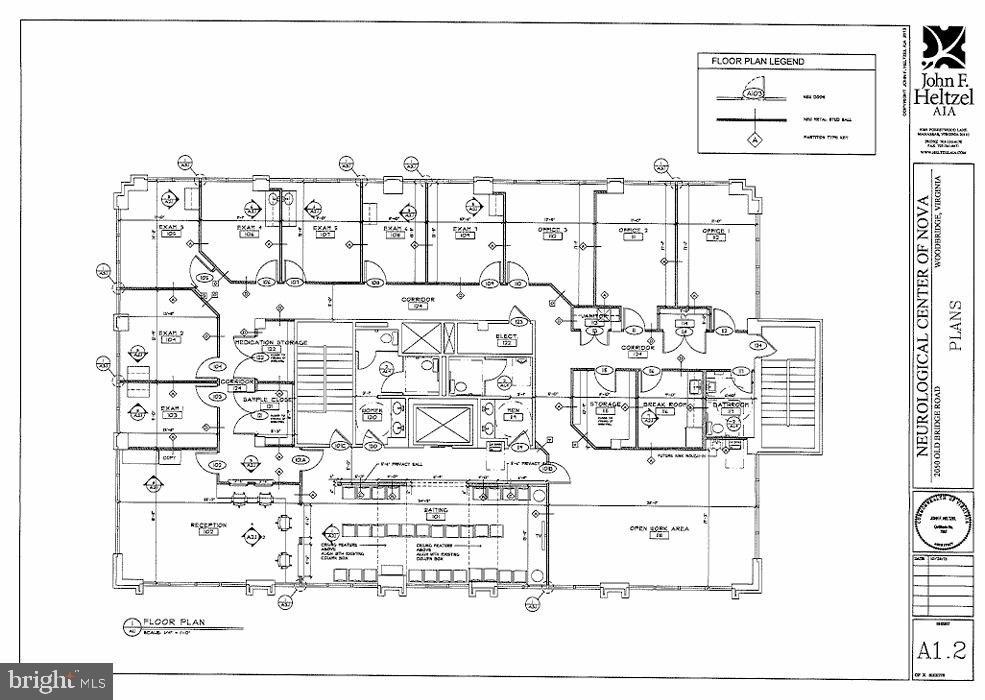
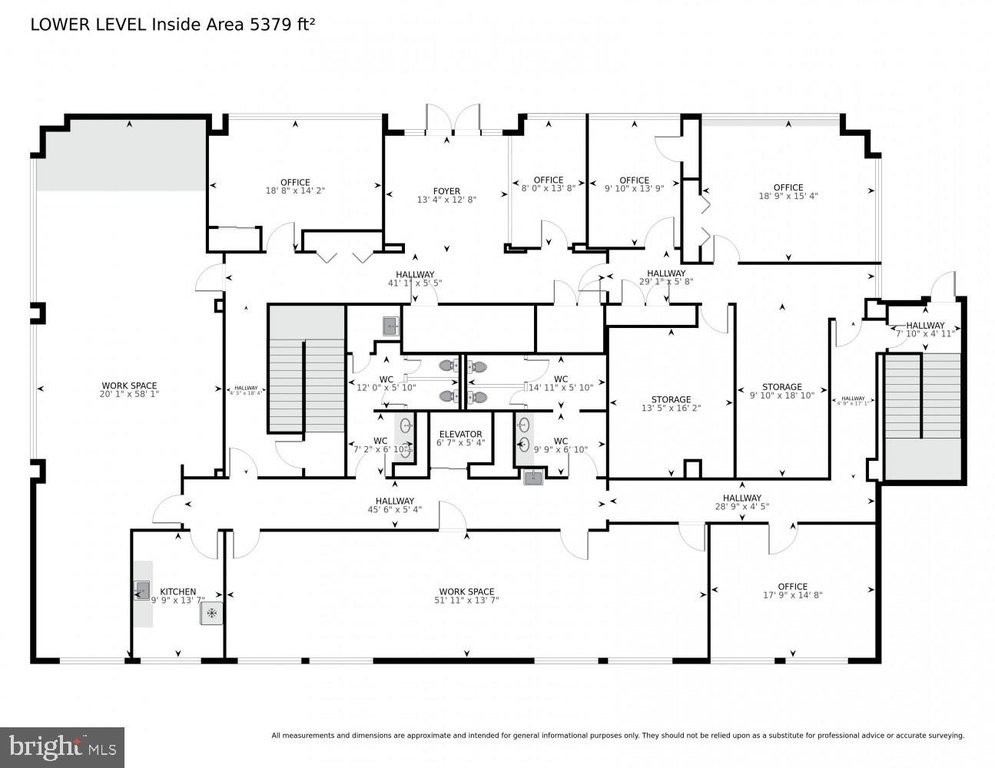
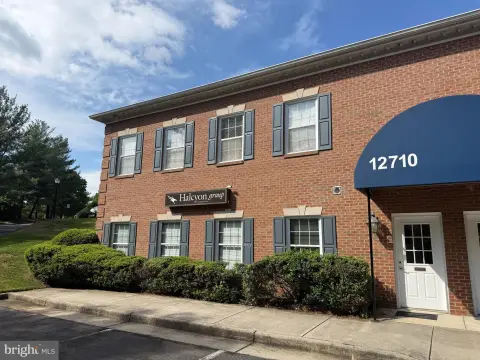
A three-story brick office building offering adaptable workspace designed for professional services and office-oriented users. The property includes an elevator plus exterior stair access and three separate lobbies. Interior features include remodeled restrooms, kitchen areas, and flexible floorplans, with layouts that support either subdivision or full-floor occupancy. Office spaces are described as well-sized and can be configured to fit a range of tenant needs.
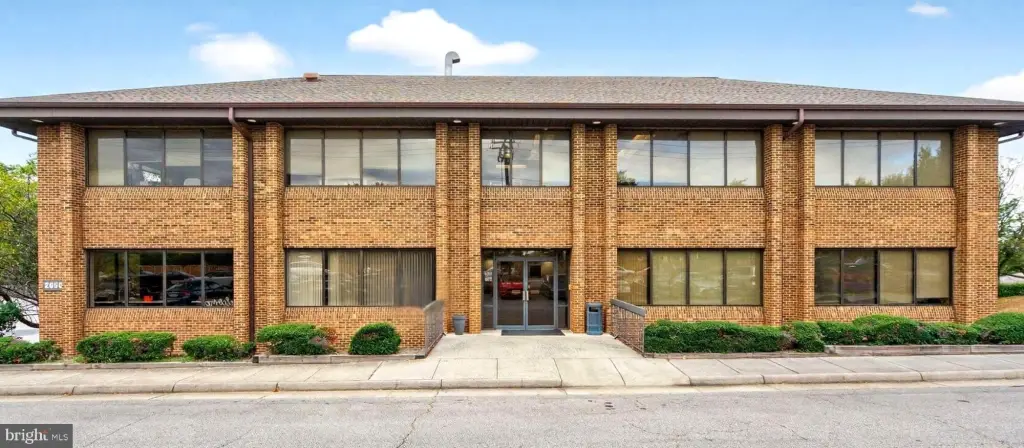
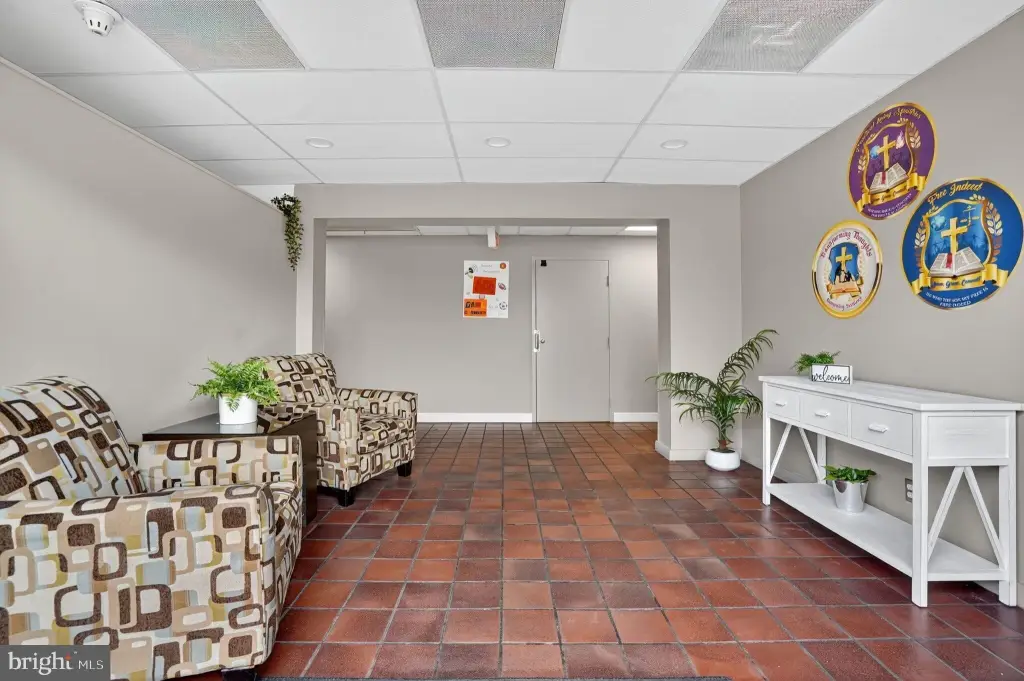
Access and visibility are supported by entrances on two streets and ample on-site parking. The building is positioned with dual frontage along Old Bridge Road, and the property is located within minutes of I-95, Route 123, and Jefferson Davis Highway. It is also described as being near hospitals, with Quantico and Fort Belvoir noted as approximately 20 to 30 minutes away.
The first and second floors are currently leased to established tenants, providing current occupancy at the building level. Both leases are stated to expire within the next two years, creating a near-term window for a new owner to evaluate renewals or reposition the space for future office users. For tenants and owner-occupants seeking flexible floorplates, the combination of multiple lobbies, elevator service, and potential for subdivision supports a practical range of operational footprints.
Access and visibility are supported by entrances on two streets and ample on-site parking. The building is positioned with dual frontage along Old Bridge Road, and the property is located within minutes of I-95, Route 123, and Jefferson Davis Highway. It is also described as being near hospitals, with Quantico and Fort Belvoir noted as approximately 20 to 30 minutes away.
The first and second floors are currently leased to established tenants, providing current occupancy at the building level. Both leases are stated to expire within the next two years, creating a near-term window for a new owner to evaluate renewals or reposition the space for future office users. For tenants and owner-occupants seeking flexible floorplates, the combination of multiple lobbies, elevator service, and potential for subdivision supports a practical range of operational footprints.
Key Highlights
- Prime 15,000 SF brick office building with three floors, elevator, and dual frontage offering exceptional visibility.
- Currently leased to strong, established tenants providing immediate cash flow with leases expiring within two years, offering renewal or repositioning opportunities.
- Flexible floorplans with remodeled restrooms and kitchen areas on each level, suitable for various professional uses.
Financial Insights For Office B
Simulate Cap Rate and NOI
NOI Build-Up
- Vacancy
- income lost from leasable area expected to sit empty during the year — subtracted from gross rent.
- EGI (Effective Gross Income)
- gross rent minus vacancy losses — the realistic income before paying operating costs.
- OpEx (Operating Expenses)
- recurring costs to operate the property (property tax, insurance, utilities, maintenance, management) — excludes financing and capital improvements.
- NOI (Net Operating Income)
- income a property generates after operating costs but before financing and taxes.
| Component | $ | $/SF |
|---|---|---|
| Gross rent | $363.6k | $24.24 |
| − Vacancy | −$10.9k | −$0.73 |
| EGI | $352.7k | $23.51 |
| − OpEx | −$88.2k | −$5.88 |
| NOI | $264.5k | $17.63 |
15,000 SF · lease $24.24/SF/yr · vacancy 3.00% · expense 25.00%
Alternative Uses
Best Use
Office B
$3.78M
$3.31M – $4.41M
NOI $264,519 @ 7.0% cap · market cap 6.96%
Second Best
—
—
no second resolved use
Theoretical Best
Specialty Retail
$4.41M
$3.85M – $5.14M
NOI $308,367 @ 7.0% cap · market cap 8.11%
Zoning and permitted uses should be independently verified with local authorities.
Property Analytics
Property Profile
Location Intelligence
Current Use by Public Records
Allstate Insurance Agent: ...
Insurance Agency
Sam Oraee, MD
Physician
Transforming Thoughts Counseling ...
Counselor
Autism Behavior Therapies ...
Pediatrician
Faith AME Church
Association Or Organization




FAQs
What type of property is this?
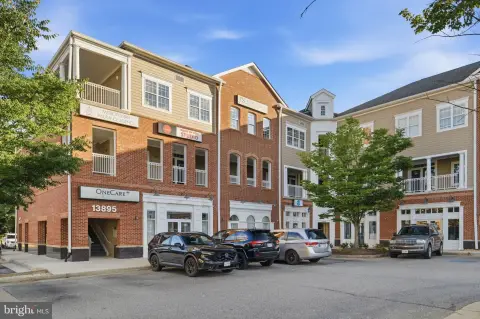
Office building - Three-story brick office building with elevator, dual entrances, and flexible floorplates near major regional routes.
Where is this office building located?
The property is located at 2050 OLD BRIDGE Road Woodbridge, VA.
What is the asking price?
The asking price for this property is $3,800,000.
What are key features of this property?
This property features: Prime 15,000 SF brick office building with three floors, elevator, and dual frontage offering exceptional visibility.; Currently leased to strong, established tenants providing immediate cash flow with leases expiring within two years, offering renewal or repositioning opportunities.; Flexible floorplans with remodeled restrooms and kitchen areas on each level, suitable for various professional uses.


