Two-Story Mixed-Use
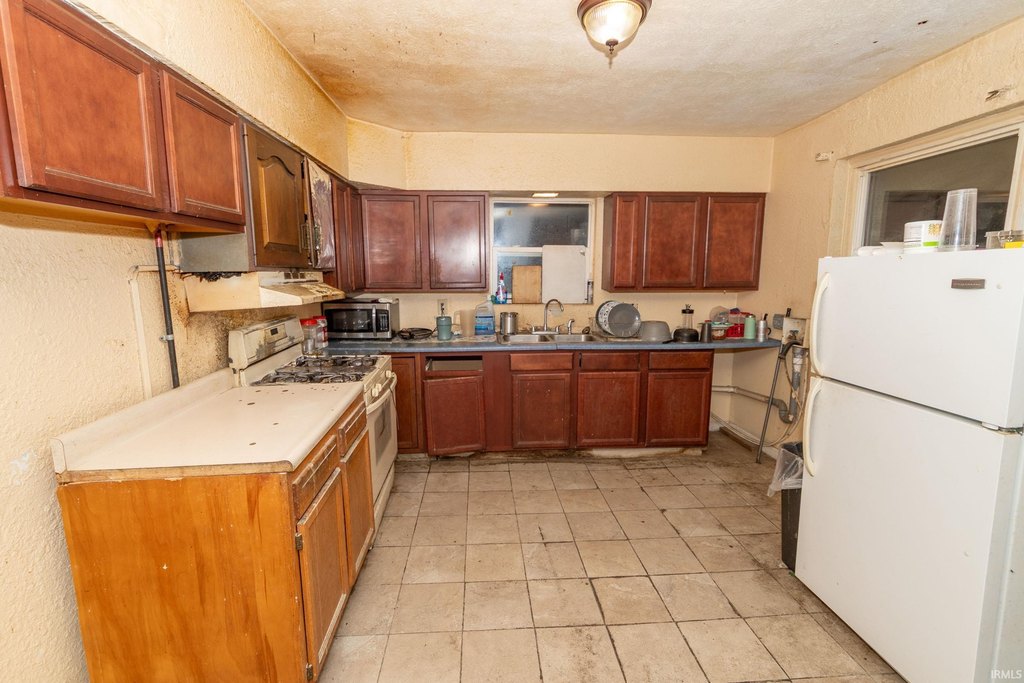
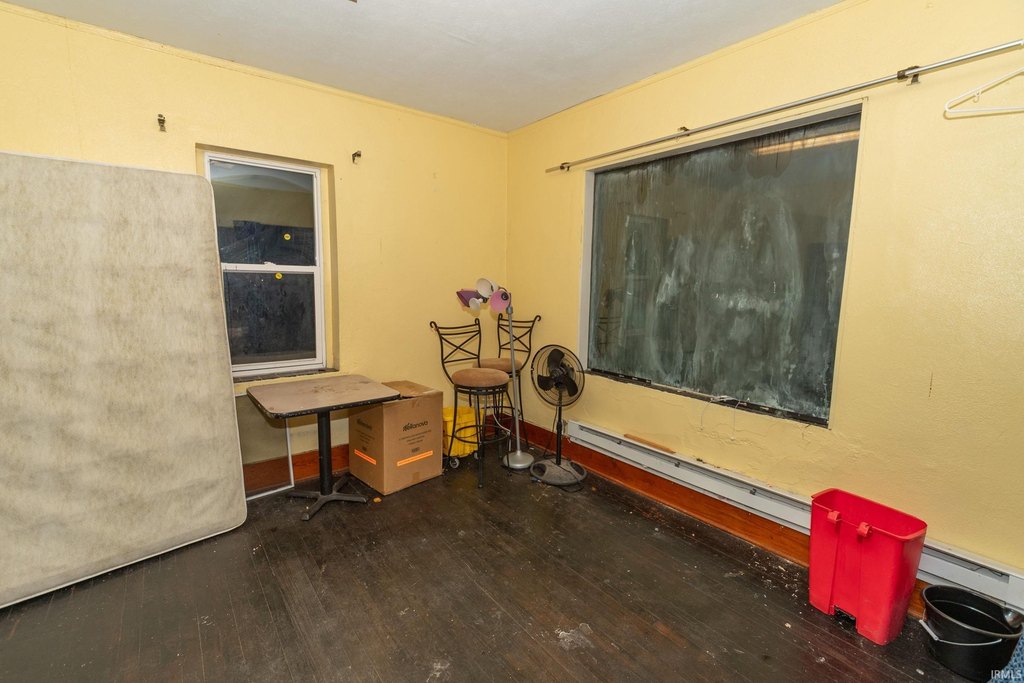
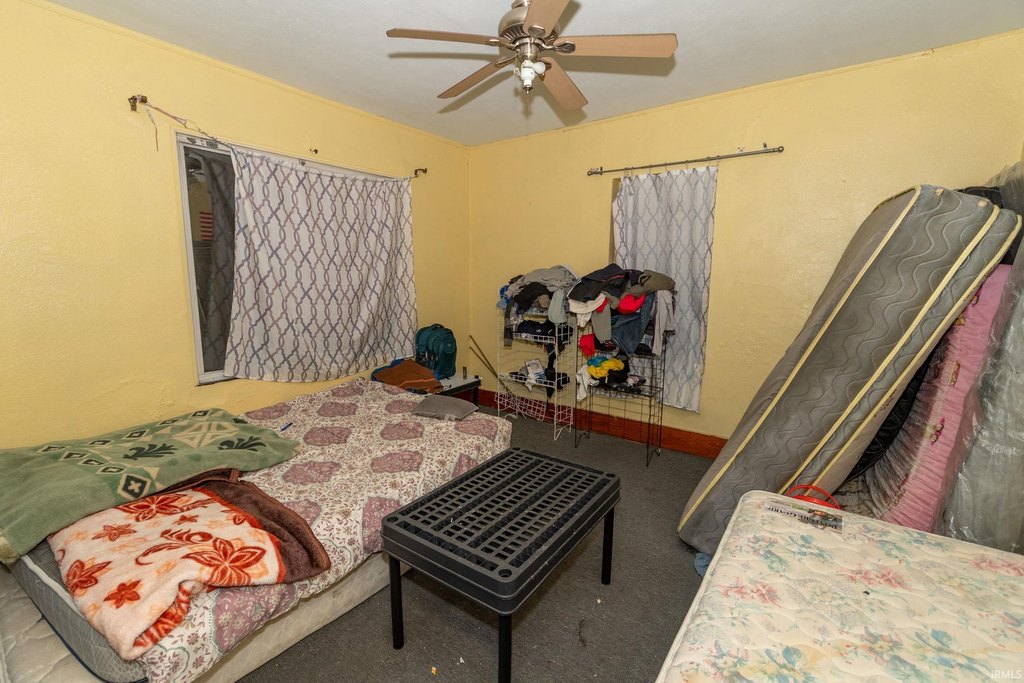
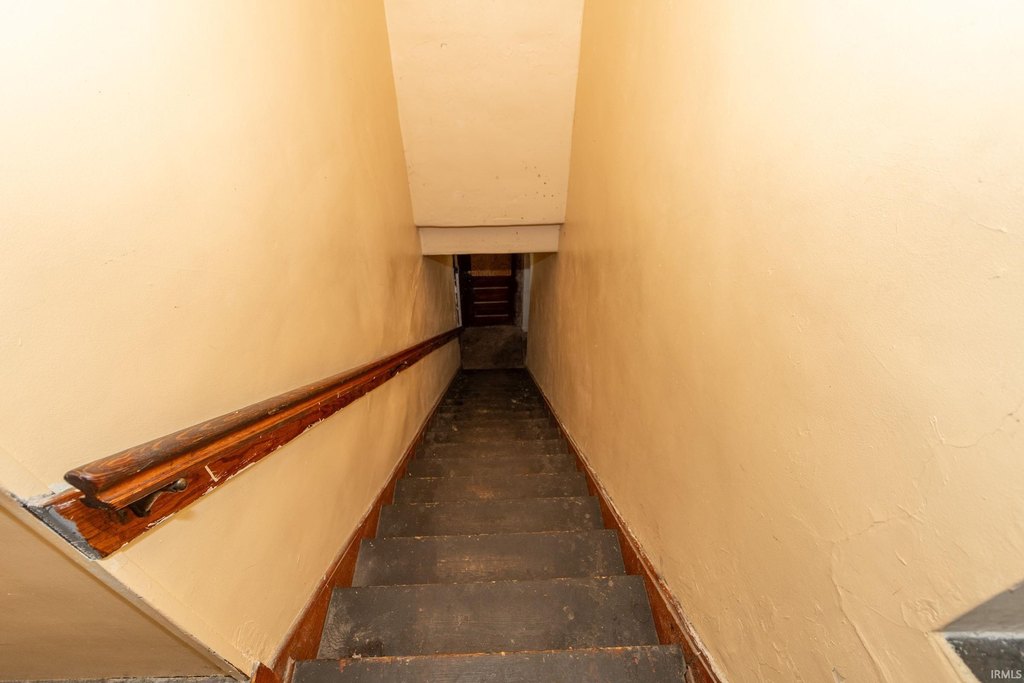
For Sale
$290,000
1637 KEMBLE AVE, South Bend, IN 46613
INVESTMENT, Bi-Level, South Bend, IN
Property Size2,394 SF
Lot Size0.25 Acres
Price / SF$121.14
Days on Market323
Property Features for 1637 KEMBLE AVE
General Information
Property type
Residential Multi Family
Property subtype
Other
Bedrooms
5
Bathrooms
2
Full bathrooms
1
Half bathrooms
1
Rooms
Bedroom 2, Bathroom 1, Bathroom 2, Bedroom 3, Bedroom 1, Basement, Bedroom 4, Bedroom 5
Lot features
Corner, 0-2.9999
Elementary school
Monroe
Middle school
Marshall
High school
Riley
Elementary school district
South Bend Community School Corp.
Middle school district
South Bend Community School Corp.
High school district
South Bend Community School Corp.
Directions
PRAIRE SOUTH ON KEMBLE.
Subdivision
St. Joseph County
Standard status
Active
APN
71-08-14-331-027.000-026
Size
2,394 SF
Lot size
0.25 Acres
Taxes and HOA fees
Tax Year
2025
Tax Description
Lots 50-51 Byerleys Add
Tax Annual Amount
1680
Legal Description
Lots 50-51 Byerleys Add
Amenities
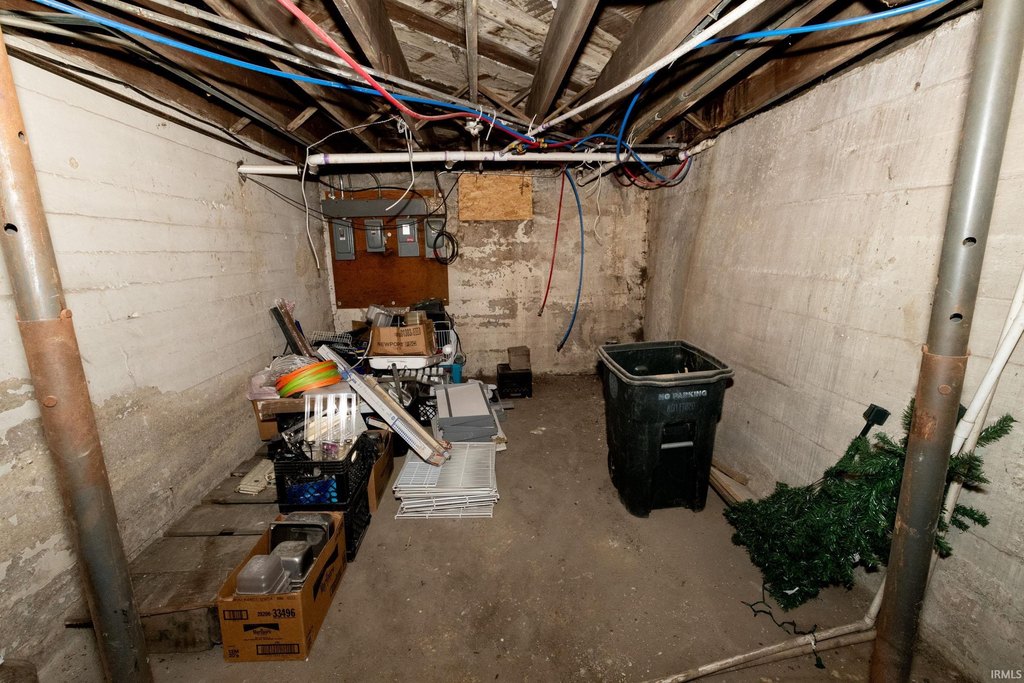
basement
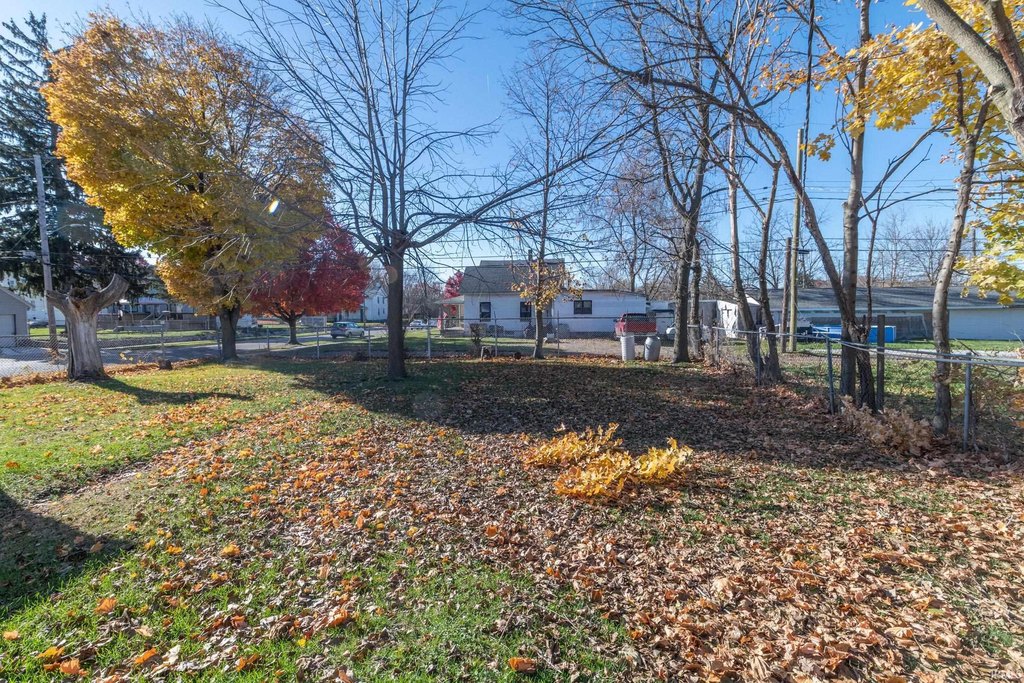
double-fenced lot
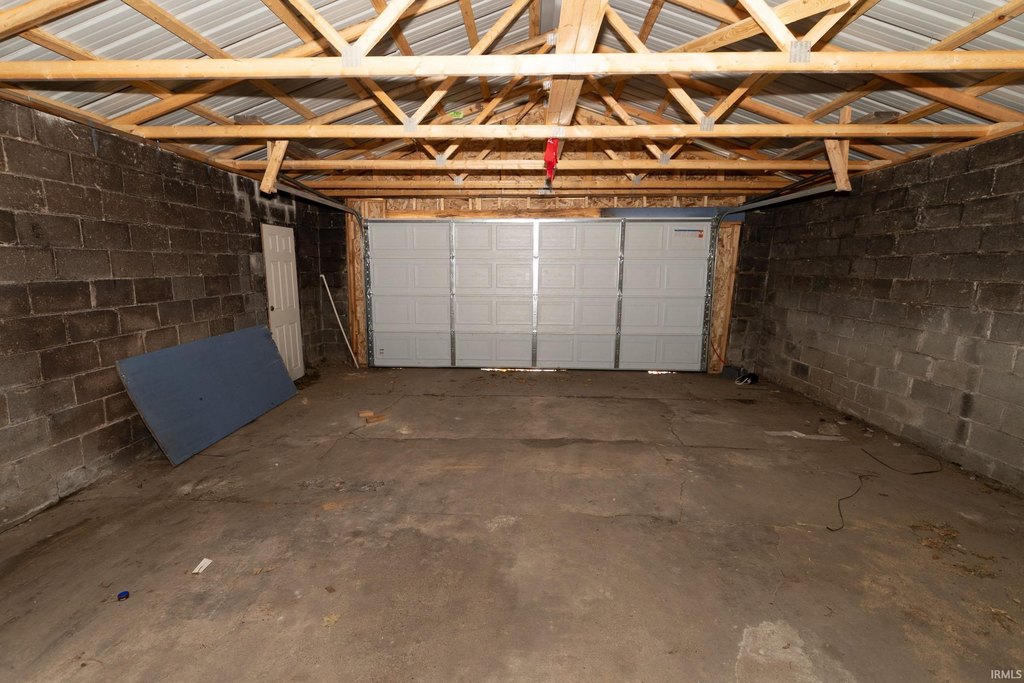
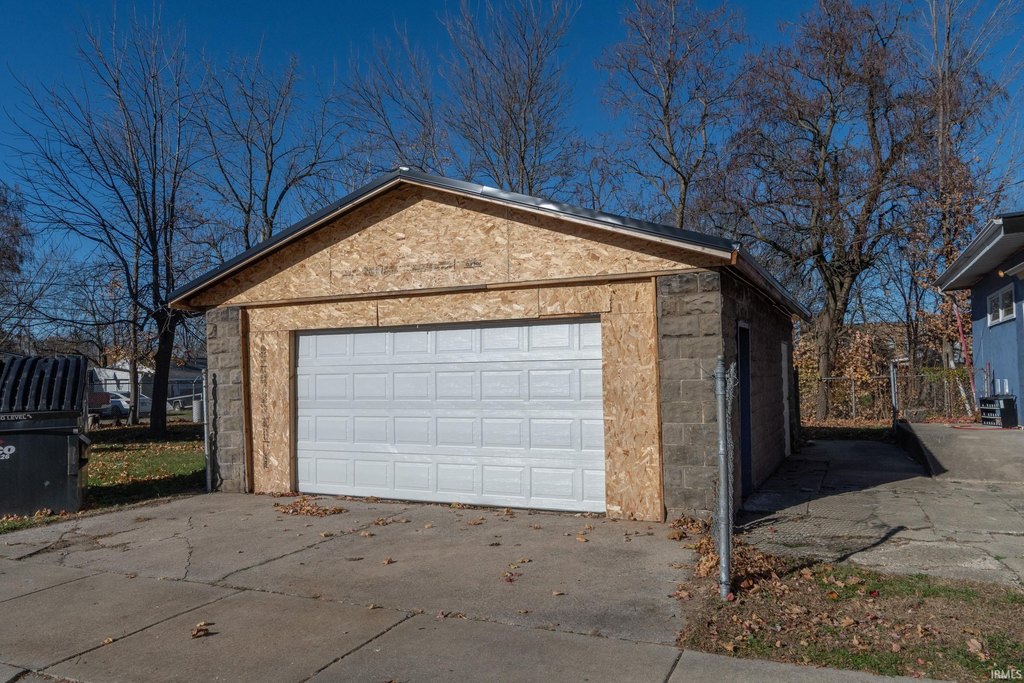
detached 2-car garage
Building Details
Year built
1956
Floors in Building
2
Number of units
1
Flooring type
Concrete
Architectural style
Other
Listing Agency:
McKinnies Realty, LLC Elkhart
(574) 271-3440
Listed By:
Kavita Patel · License #RB22002108
(574) 387-9959
Added: Nov 18, 2025
Changed: Sep 15
Last Checked: Oct 7 at 8:06AM
MLS# 202546428
Copyright © 2026 Elkhart County Board of Realtors. All rights reserved. All information provided by the listing agent/broker is deemed reliable but is not guaranteed and should be independently verified.
Investment Insights
Based on property information with market context.
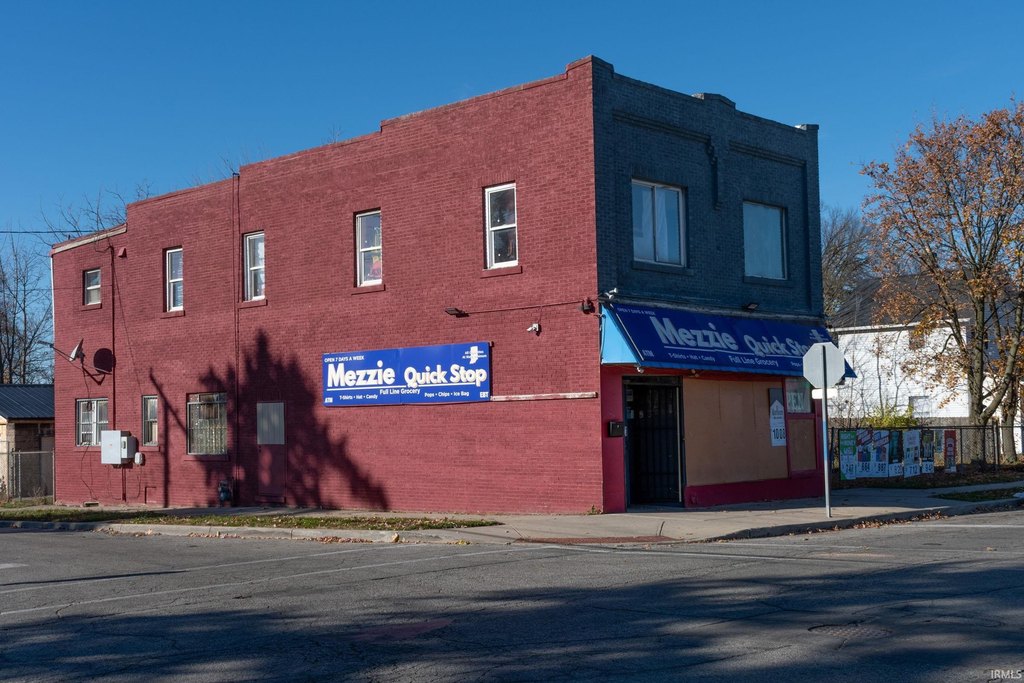
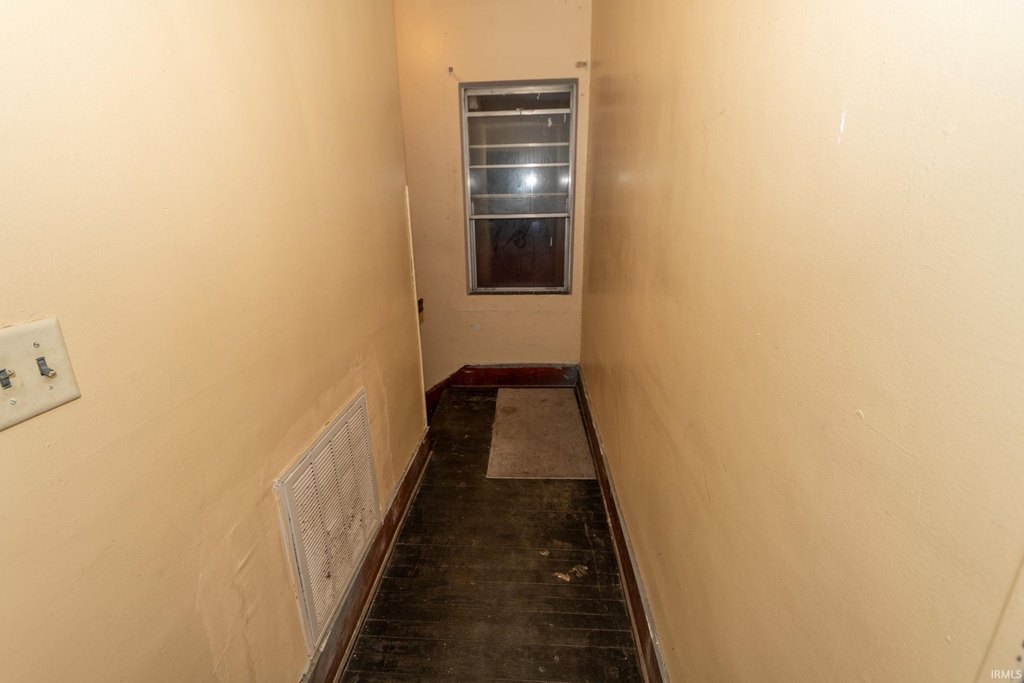
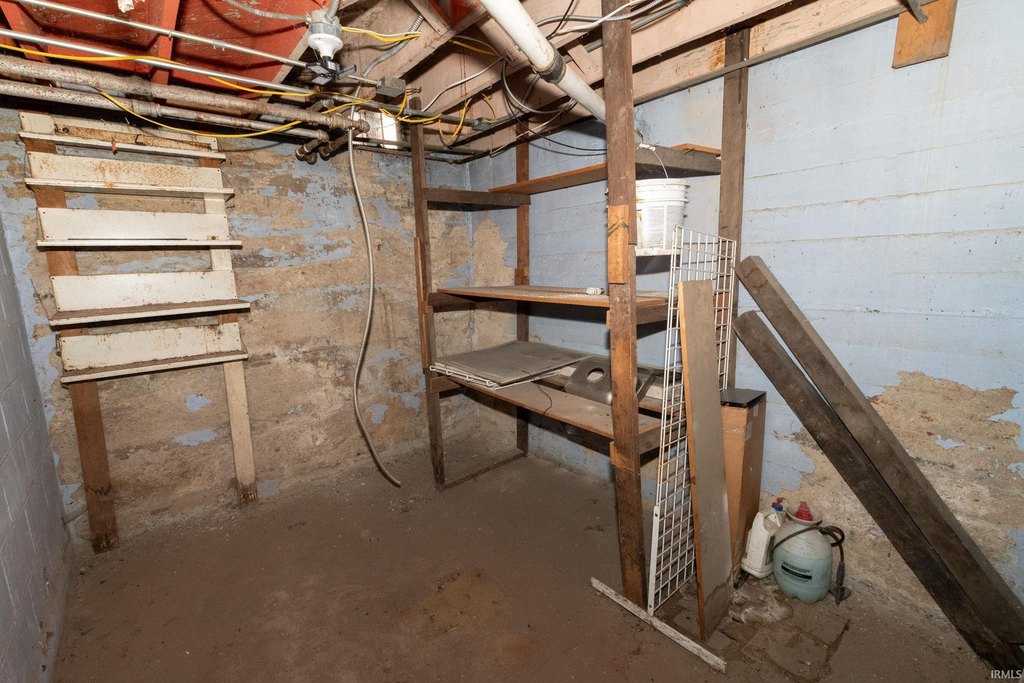
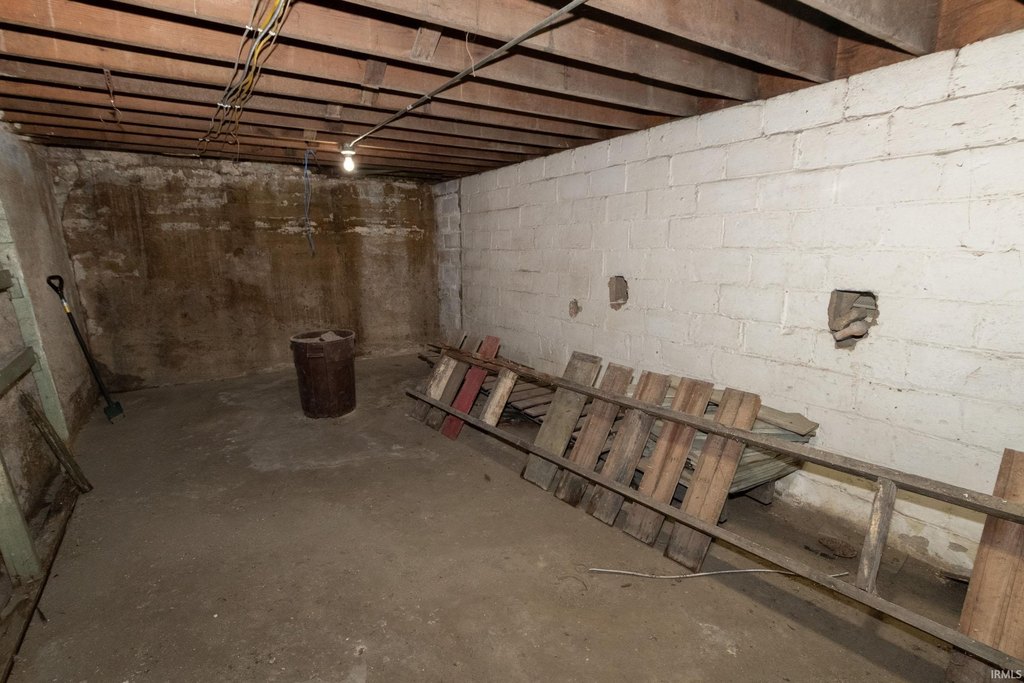
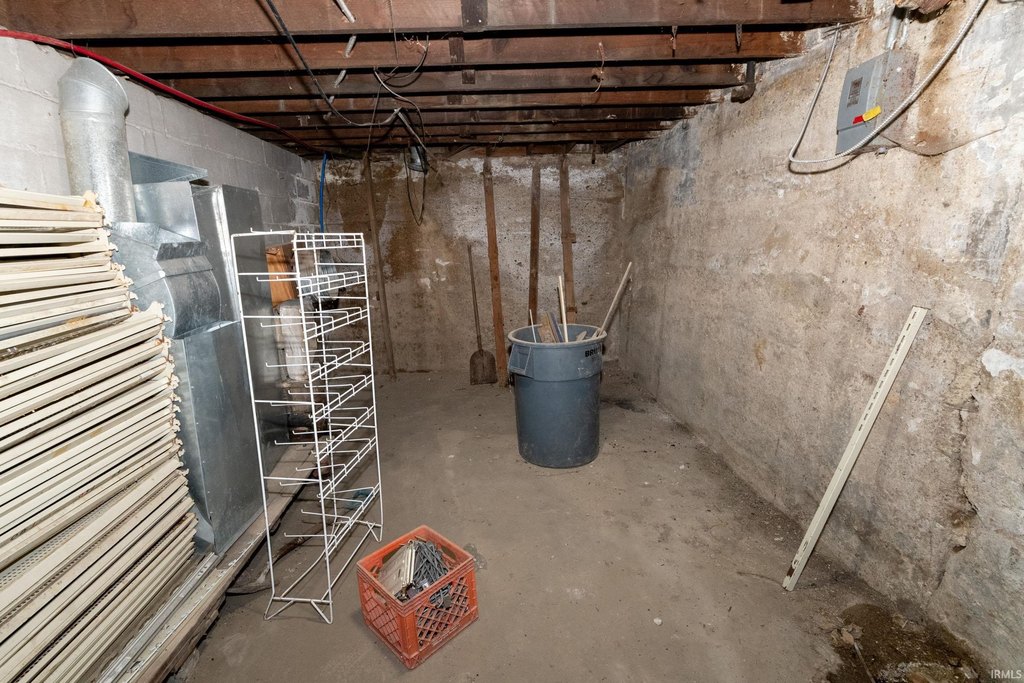
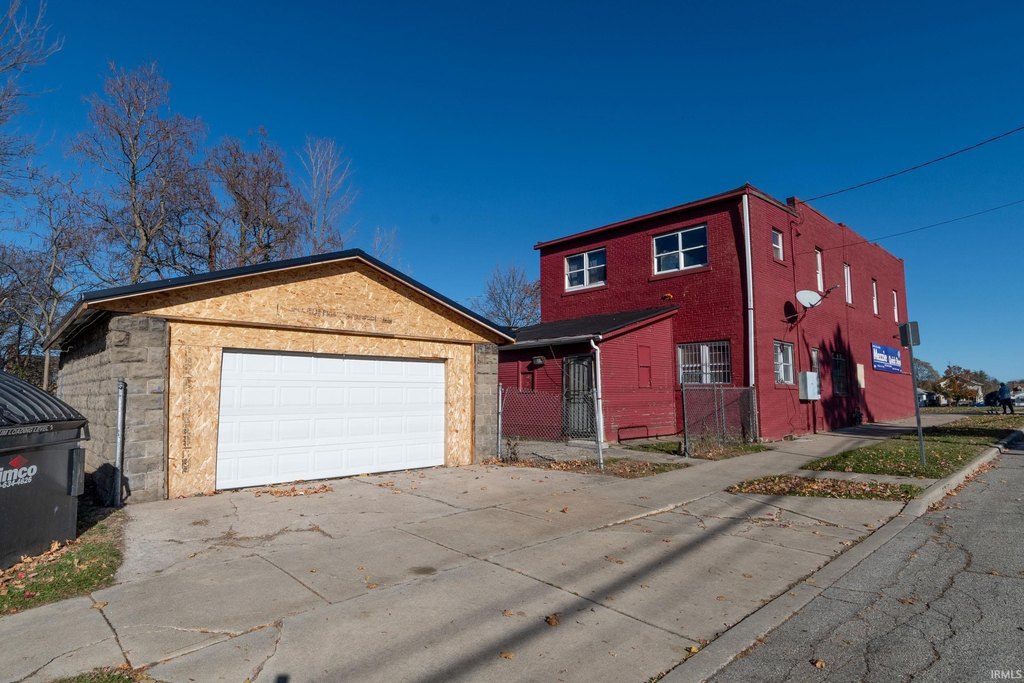
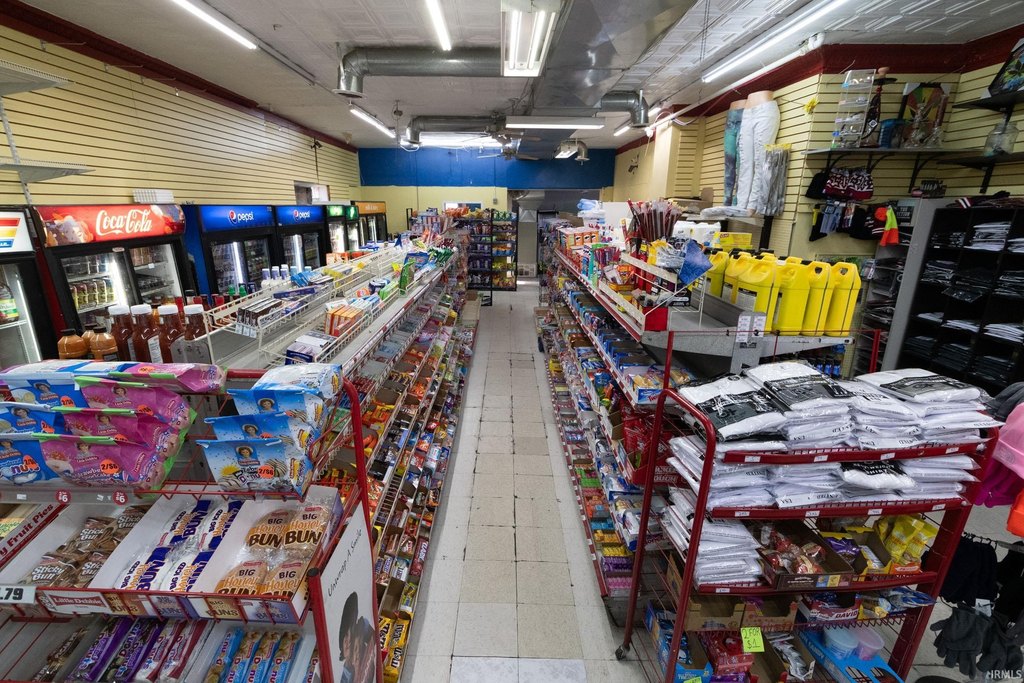
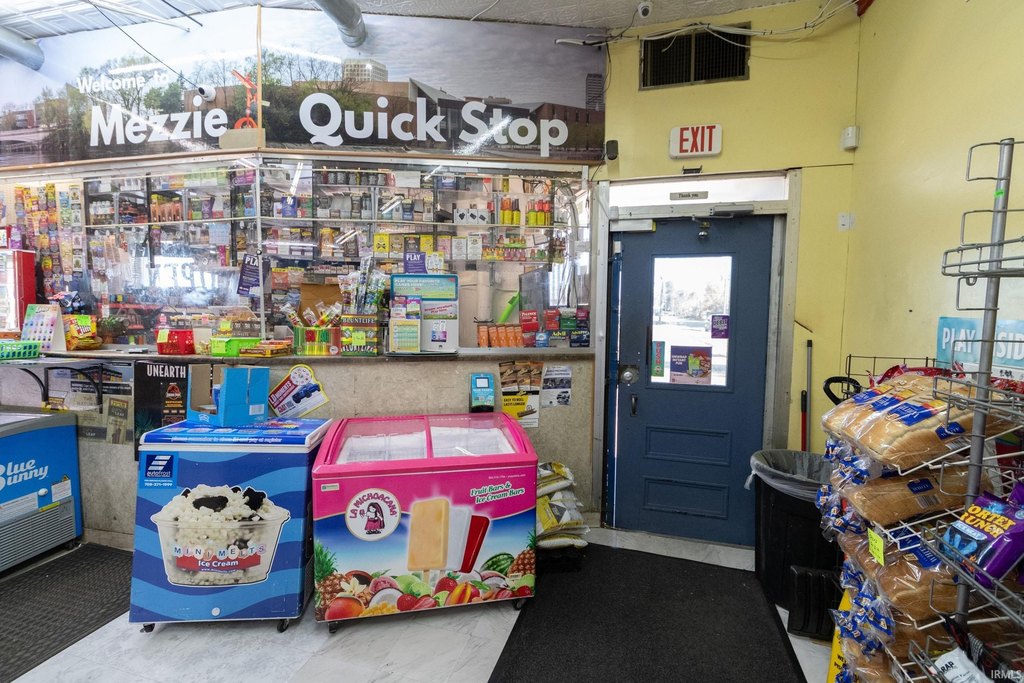
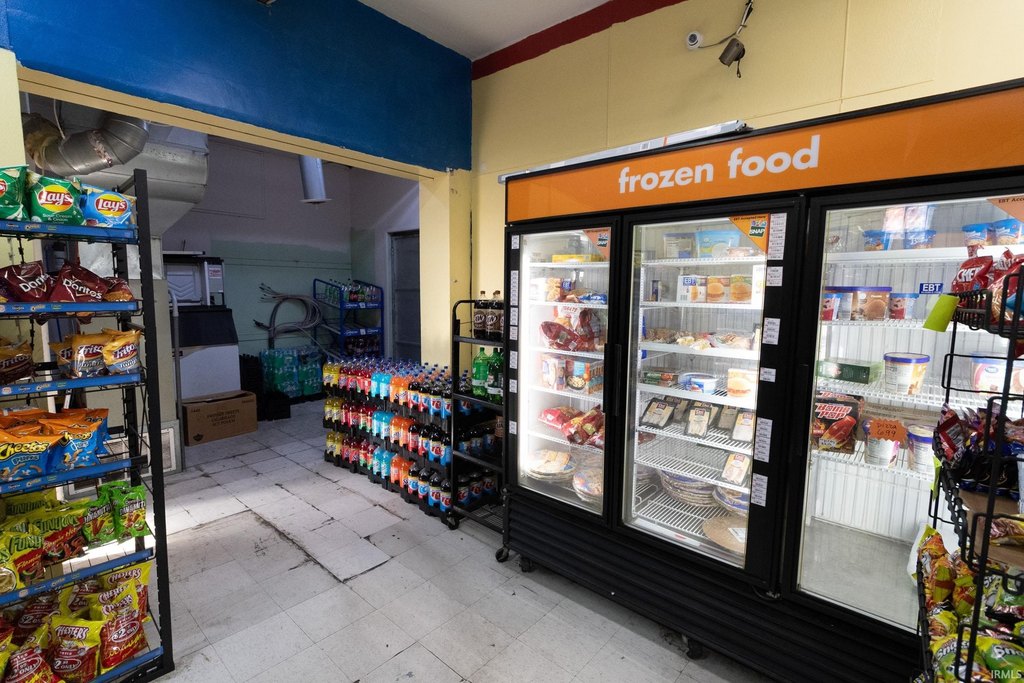
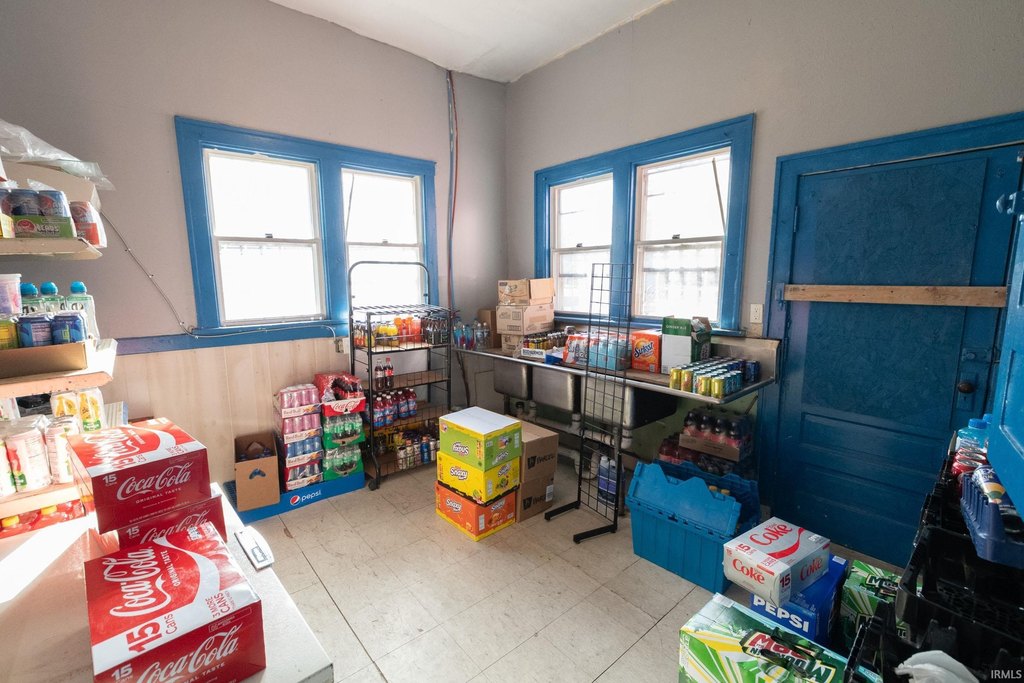
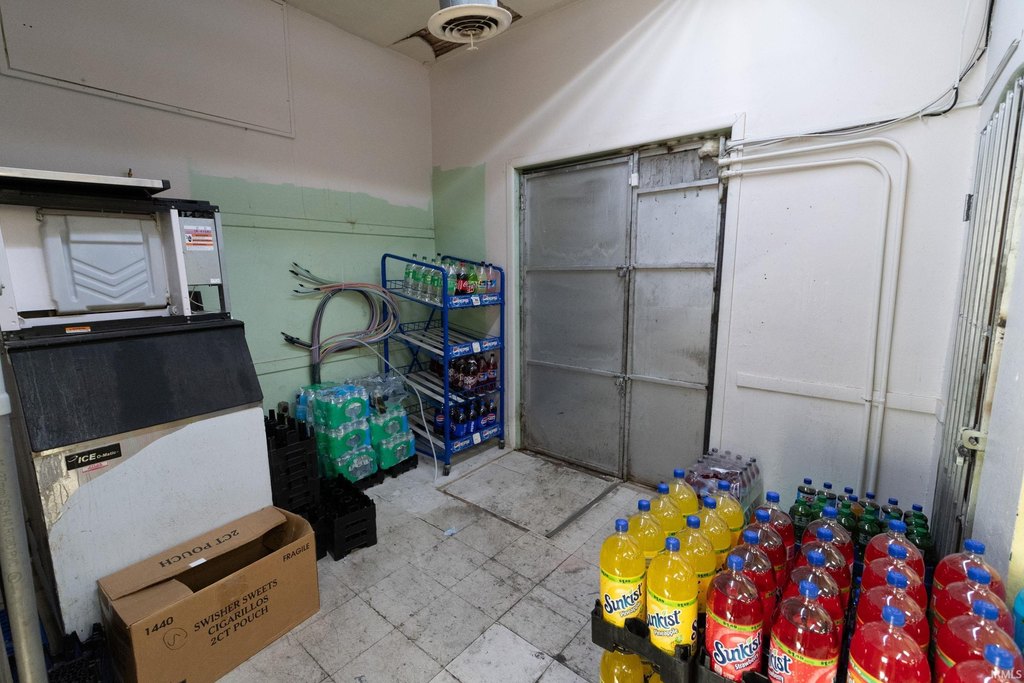
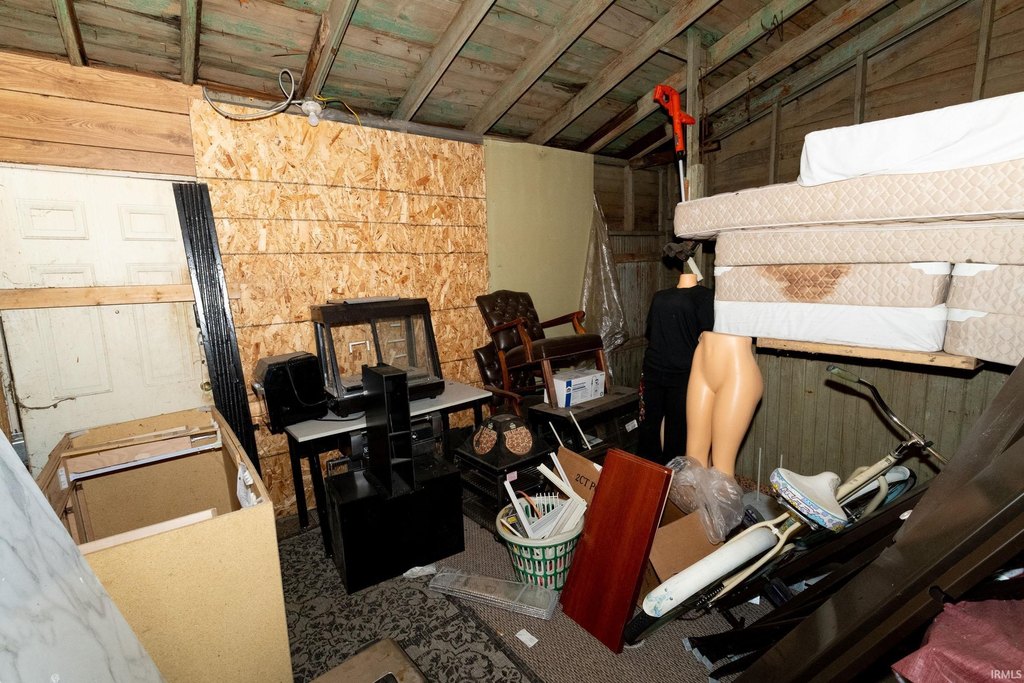
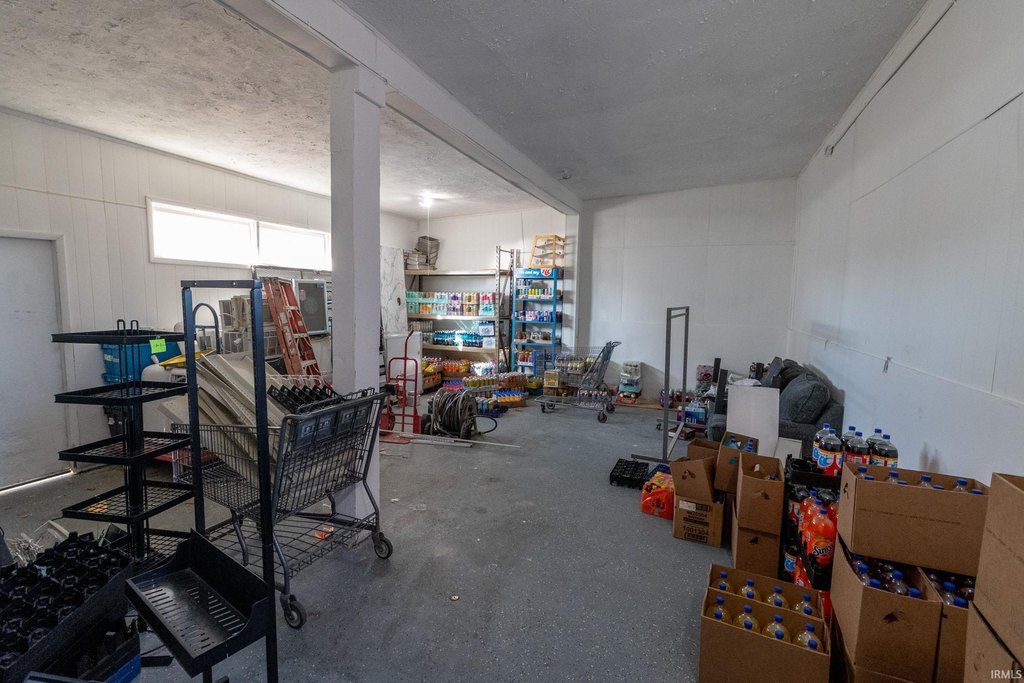
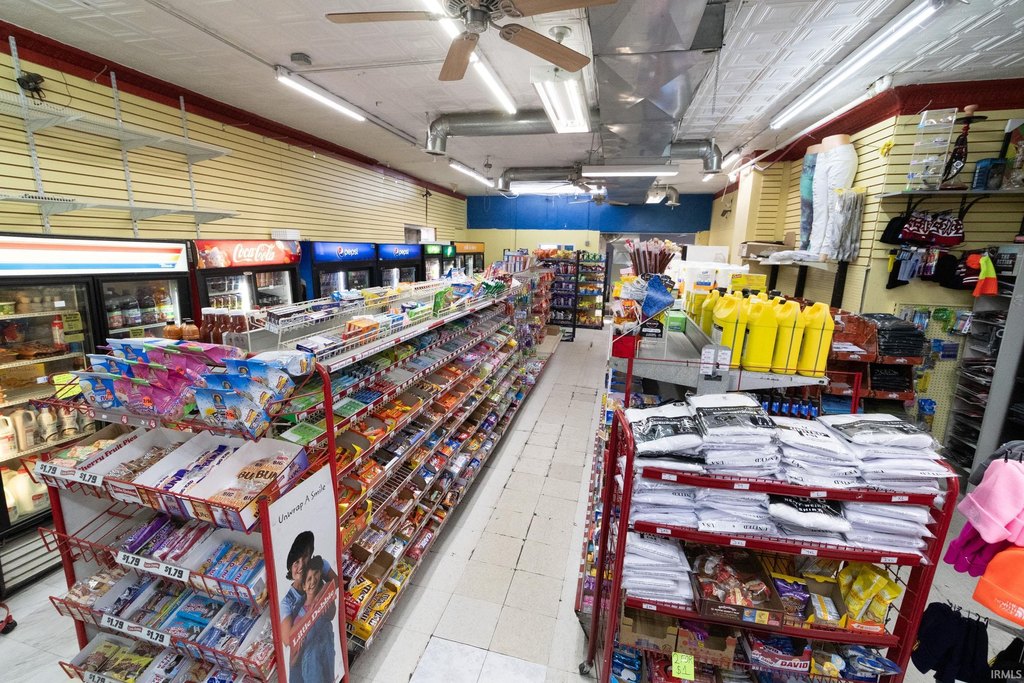
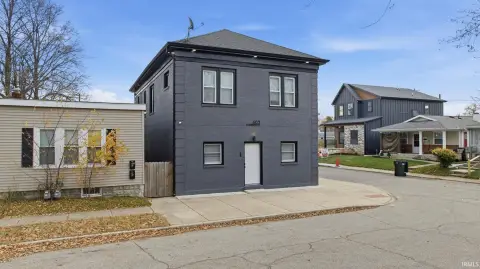
This 2-story brick mixed-use property combines an operating grocery and convenience store with residential space above. The main floor includes the retail area and 3 additional rooms that can serve as offices, storage, or added store area. A basement provides further storage capacity.
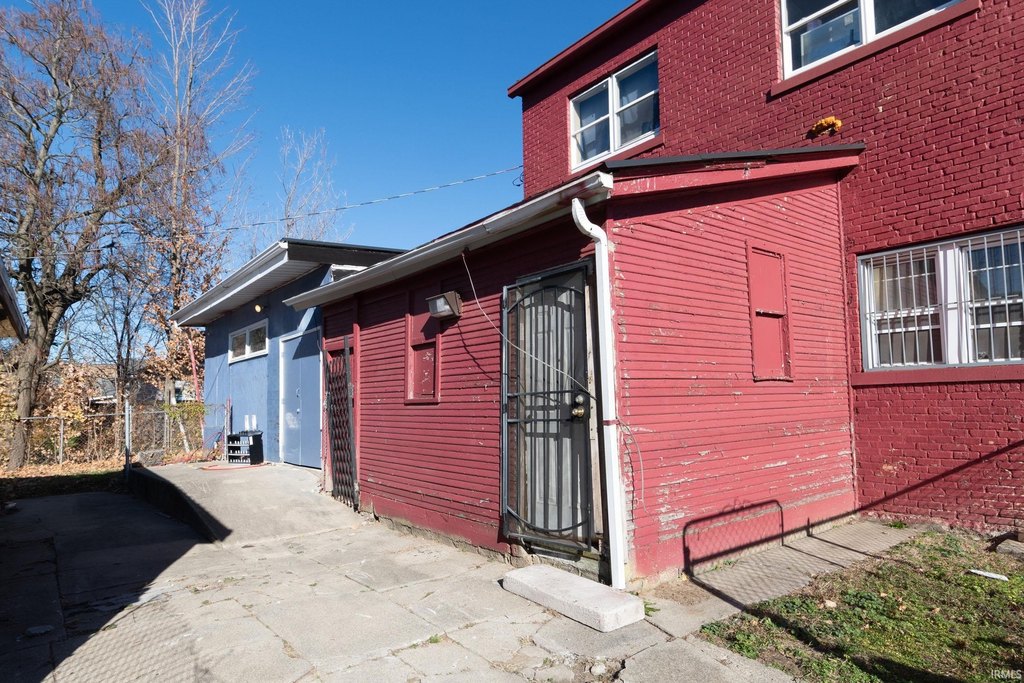
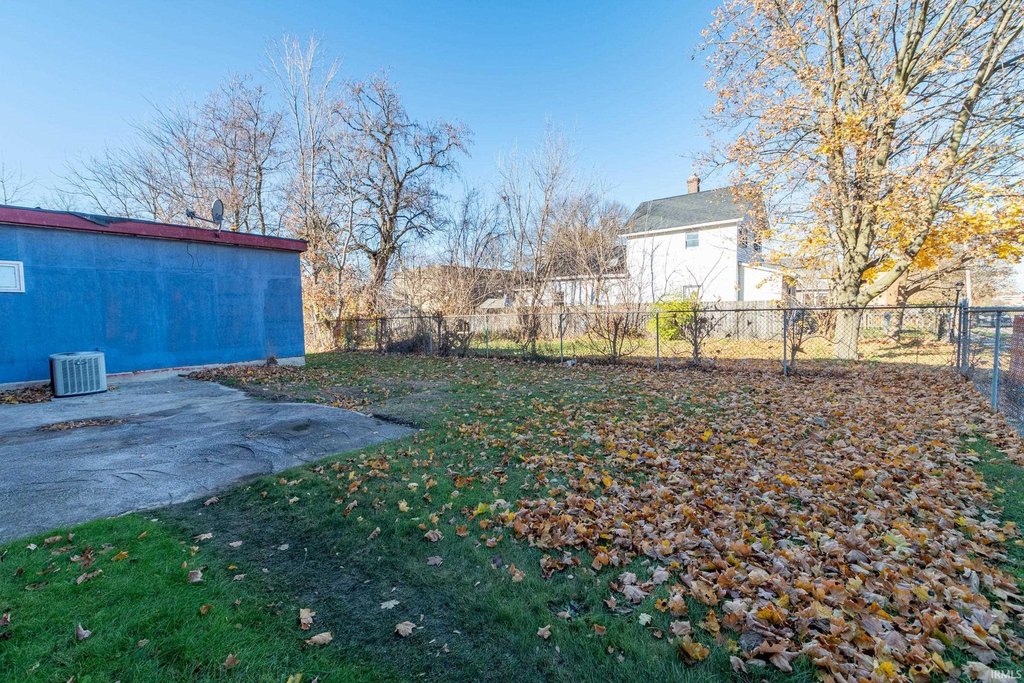
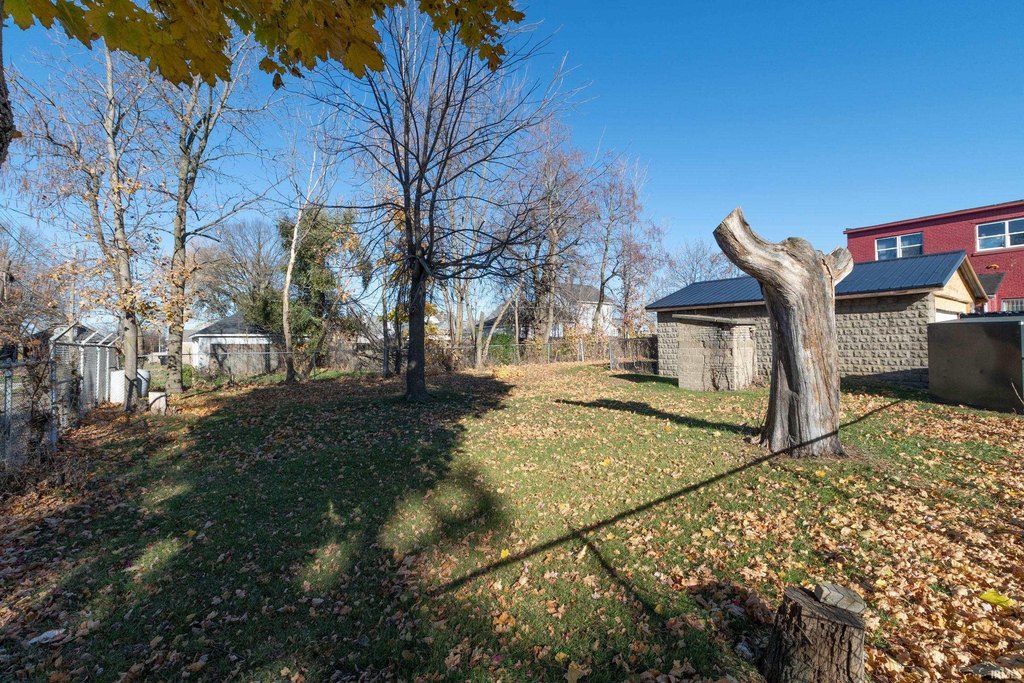
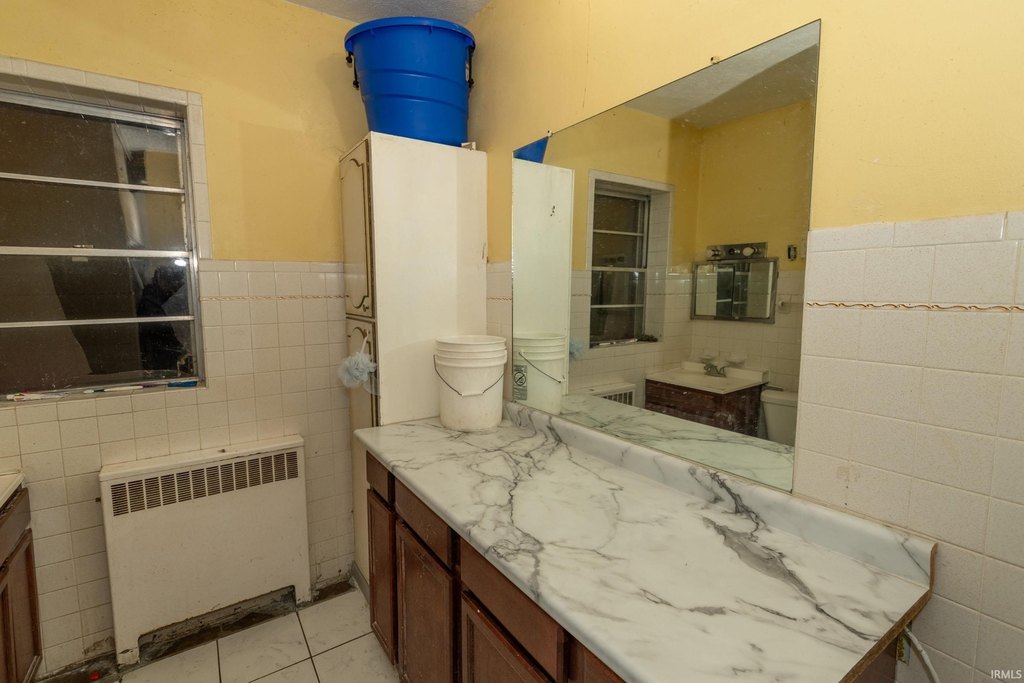
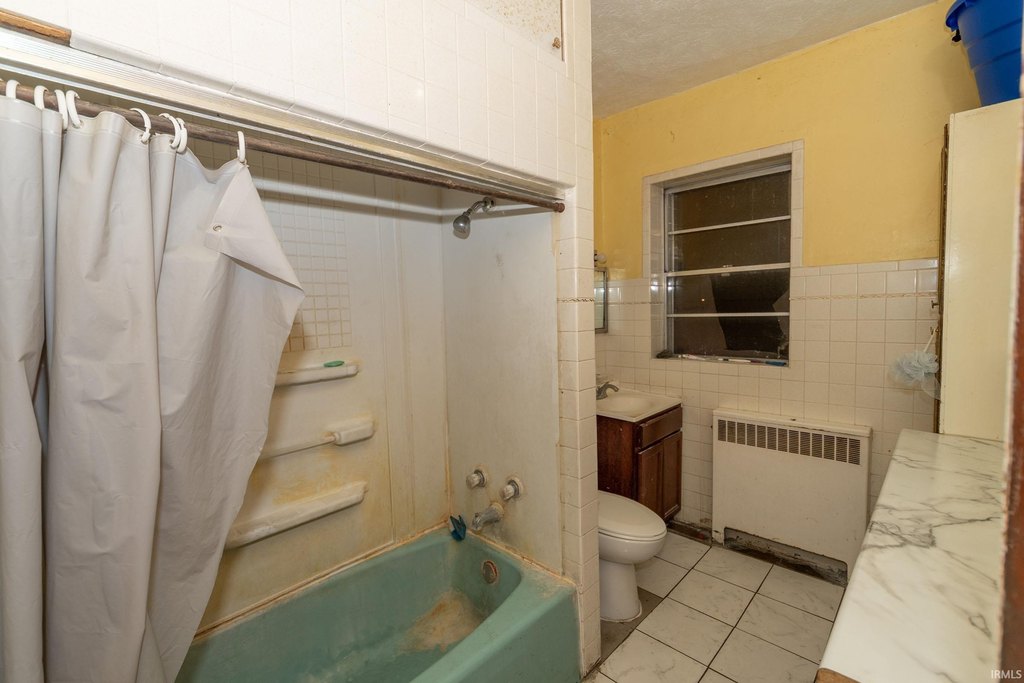
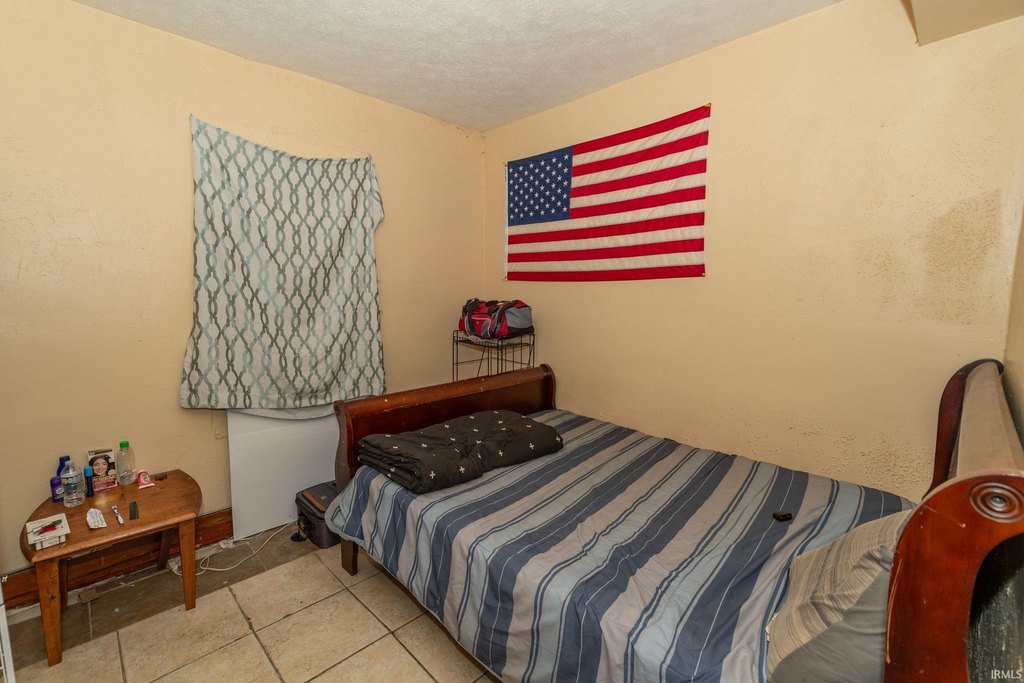
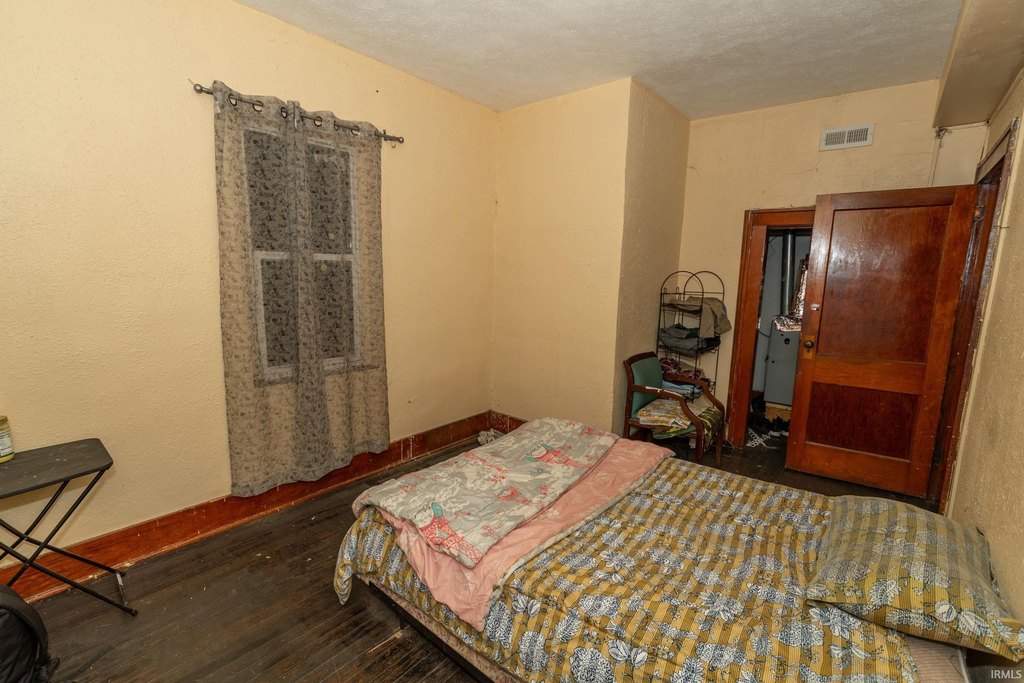
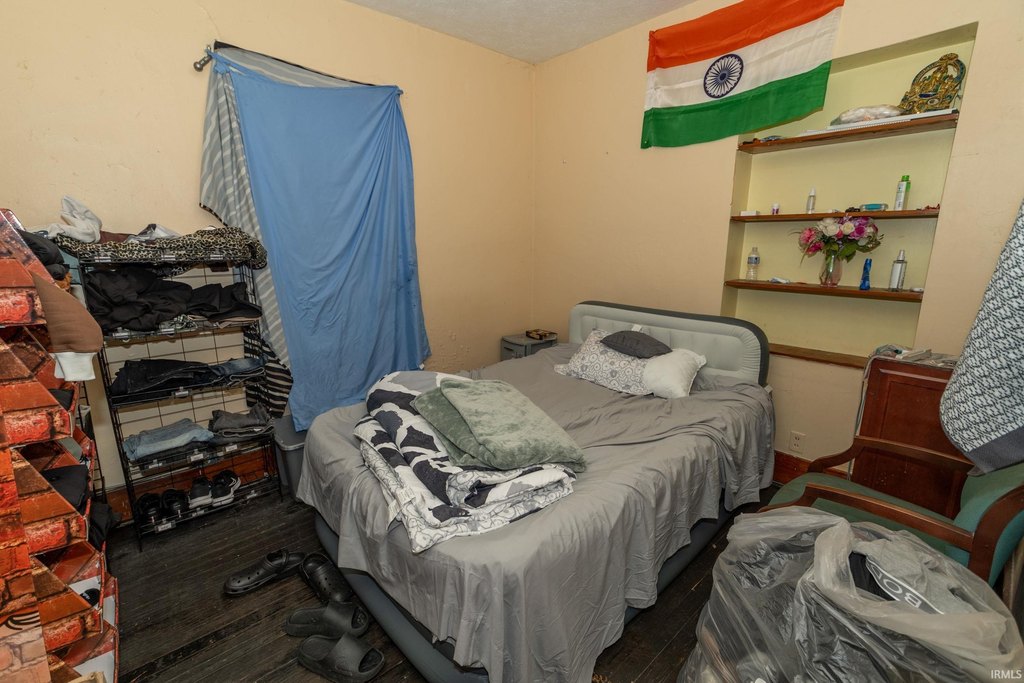
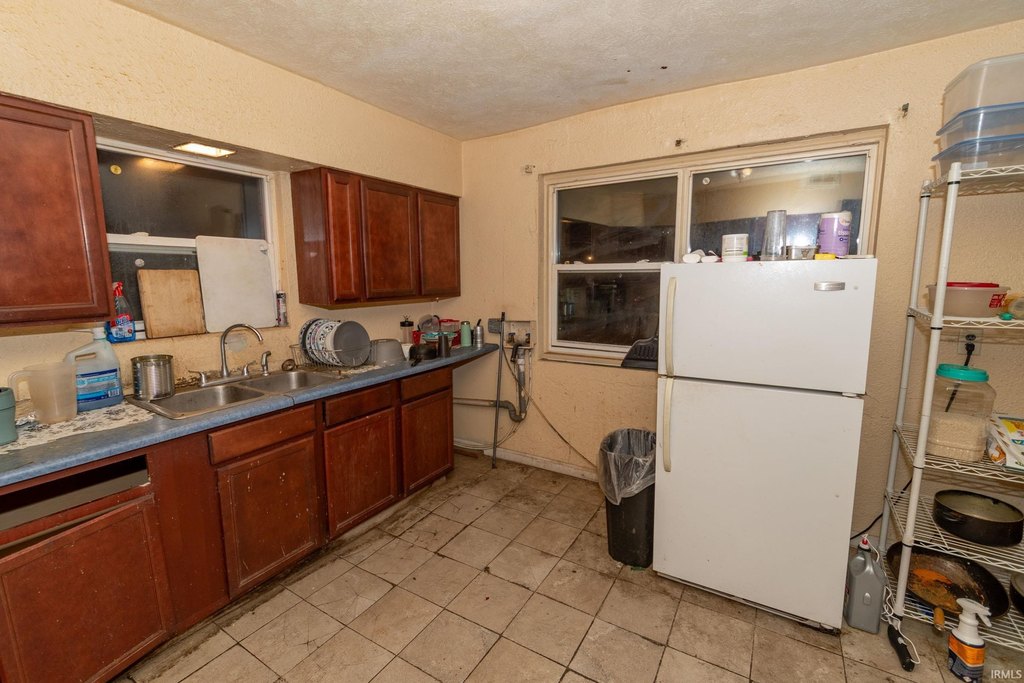
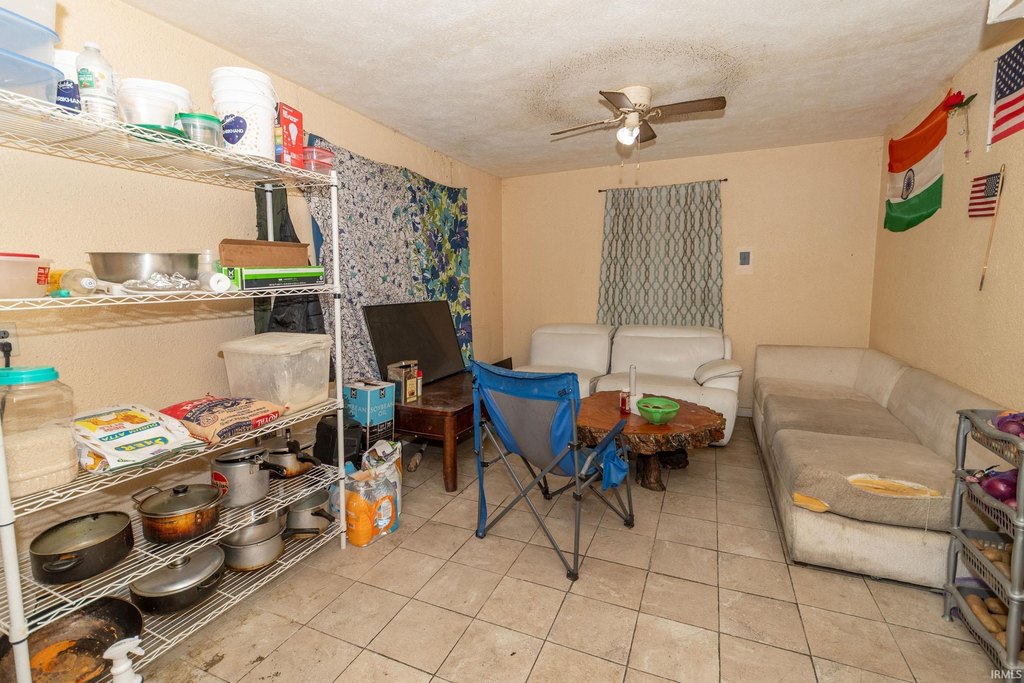
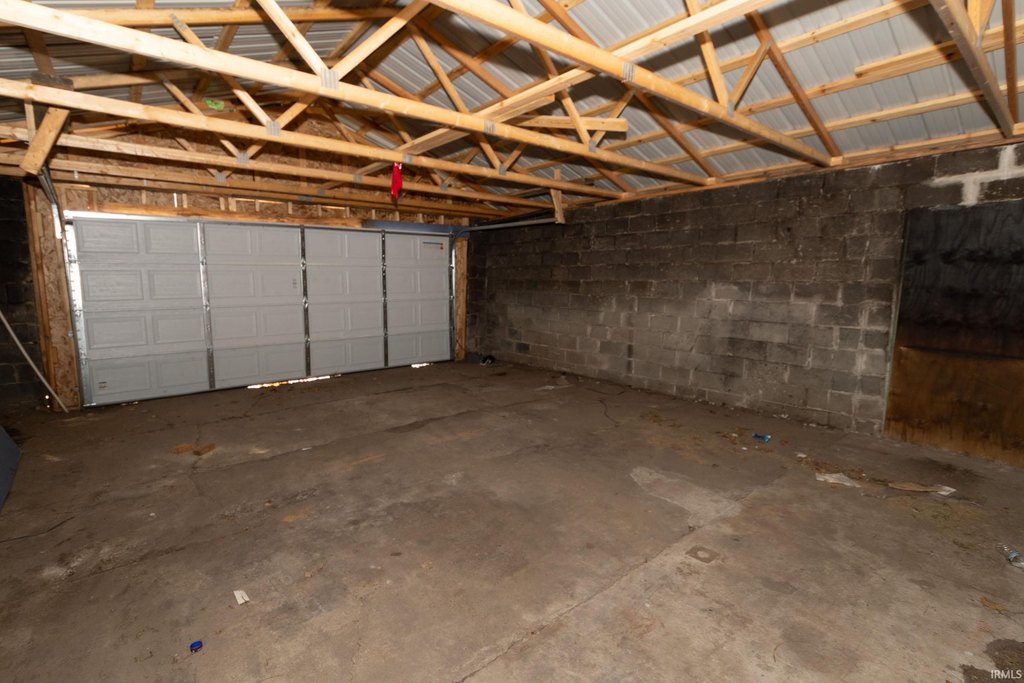
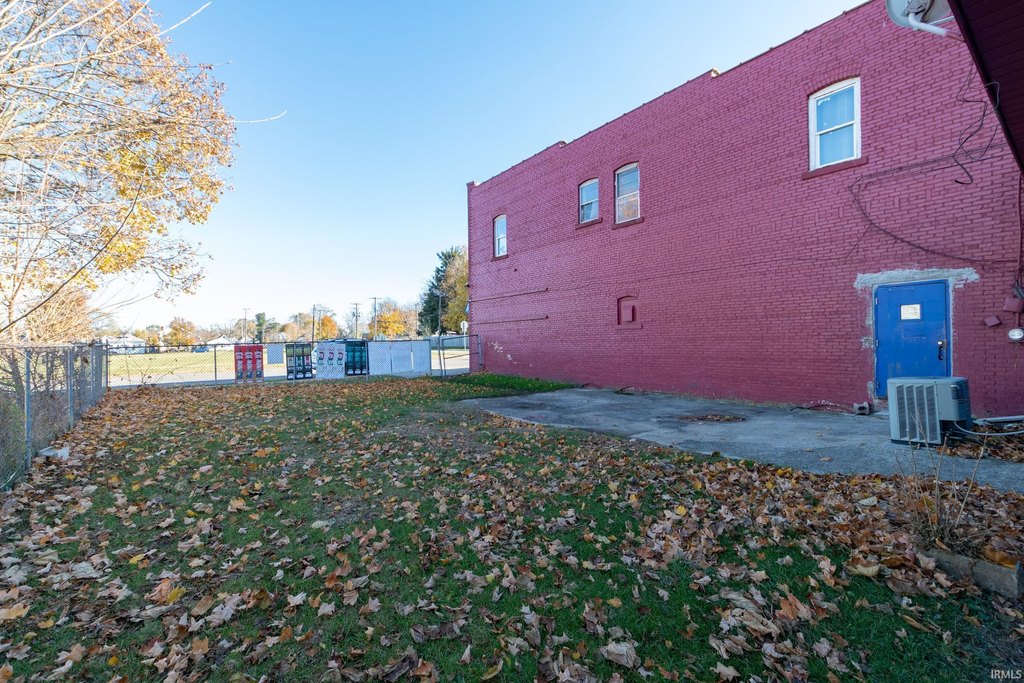
The second level contains 5 bedrooms, a living room, an eat-in kitchen, and a full bathroom. The property is being sold as-is and also includes a double-fenced lot plus a recently updated detached 2-car garage. Built in 1956, the building contains approximately 2,394 square feet on a 0.25-acre parcel at 1637 Kemble Ave in South Bend, Indiana.
The second level contains 5 bedrooms, a living room, an eat-in kitchen, and a full bathroom. The property is being sold as-is and also includes a double-fenced lot plus a recently updated detached 2-car garage. Built in 1956, the building contains approximately 2,394 square feet on a 0.25-acre parcel at 1637 Kemble Ave in South Bend, Indiana.
Key Highlights
- Mixed‑use property with operating grocery and convenience store
- 2‑story brick building built in 1956
- Approximately 2,394 square feet on a 0.25‑acre lot
Financial Insights
Estimated NOI and Cap Rate
NOI / Yr
$26,515
Cap Rate
9.14%
Suggested Prices Based on Cap Rates
Cap Rate 5%
$530,300
$530.3K
Cap Rate 7%
$378,786
$378.8K
Cap Rate 9%
$294,611
$294.6K
Market Conditions
NOI Build-Up for 2,394 SF
Gross rent
$47.4K $19.80/SF
− Vacancy
−$5.0K −$2.08/SF
EGI
$42.4K $17.72/SF
− OpEx
−$15.9K −$6.65/SF
NOI
$26.5K $11.08/SF
Area
South Bend, IN
Vacancy
10.50%
Lease Rate
$19.80 /SF/Yr
Expense Ratio
37.50%
Simulate Cap Rate and NOI
Suggested Prices Based on Cap Rates
Cap Rate 5%
$530,300
Cap Rate 7%
$378,786
Cap Rate 9%
$294,611
Alternative Uses
Best Use
Specialty Retail
$393.9K
$344.7K – $459.6K
NOI $27,575 @ 7.0% cap · market cap 9.51%
Second Best
Mixed Use
$378.8K
$331.4K – $441.9K
NOI $26,515 @ 7.0% cap · market cap 9.14%
Theoretical Best
Office A
$605.7K
$530.0K – $706.6K
NOI $42,396 @ 7.0% cap · market cap 14.62%
Zoning and permitted uses should be independently verified with authorities.
Property Analytics
Unlock full access to Insights
Subscribe to Realmo Intelligence
Open Analytics
Current Use
Lease Details
1
Residential units
Location Intelligence
Trade Area within ½ mile
247
Businesses Nearby
895
Monthly Visits Nearby
Explore this area
Business Placement
Foot Traffic Nearby
Home Improvements & Furnishings 100%
Ferguson
Home Improvements & Furnishings
895 visits/mo
0.3 miles
Demographics for 46613, IN
11,427
Population
4,758
Households
2.4
Avg Household Size
30
Median Age
13%
College-Educated
82%
High-School Grad
3.2 sq mi
ZIP Area
3,571
Density / Sq Mi
$41,625
Median Household Income
$23,984
Median Earnings
$991
Median Rent
$71,000
Median Home Value
Check the figures for this property
Cap Rate, Value Estimation, Potential NOI and more
View Realmo Analytics
Market
Vacancy Rate% for Retail in Midwest region

Questions? Ask Rey
Realmo’s AI knows this listing — price, zoning, demand, history. Ask anything.




Frequently Asked Questions
What type of property is this?
Mixed-use property - Convenience retail space combines with upper-level living quarters and additional rooms for office, storage, or expansion.
Where is this mixed-use property located?
The property is located at 1637 KEMBLE AVE South Bend, IN.
What is the asking price?
The asking price for this property is $290,000.
What are key features of this property?
This property features: Mixed‑use property with operating grocery and convenience store; 2‑story brick building built in 1956; Approximately 2,394 square feet on a 0.25‑acre lot


