
New search
Property profile & analytics
OFF-MARKET
Estimated value
$2,245,000
Showrooms
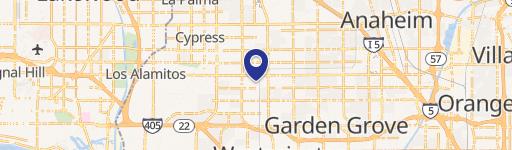
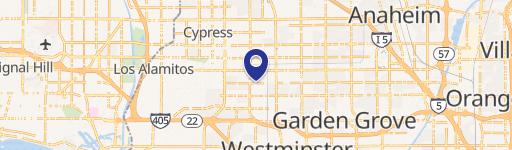
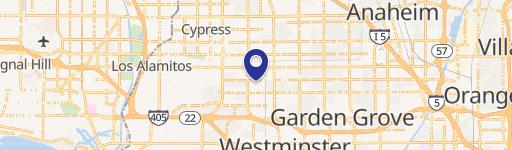
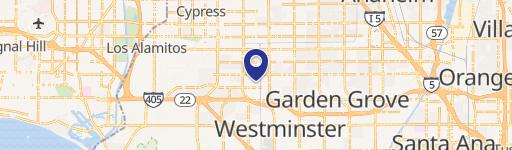
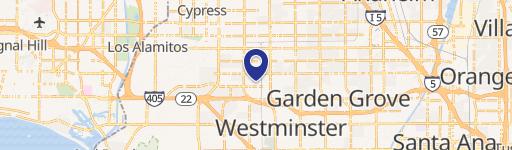
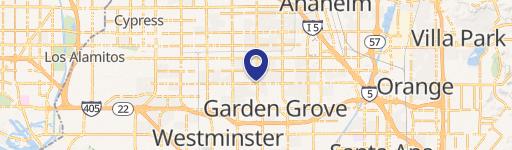
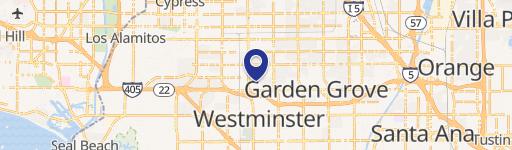
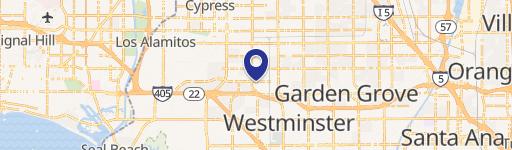
8050 Lampson Ave, Garden Grove, CA 92841-3140
Entity Owned
15-yr Hold
Absentee Owner
~
Est. High Equity
Property ID
US09-2967251
Property profile
Verified
Property type
Showrooms
Use group
SHOW ROOM, WAREHOUSE
Year built
1987
Total area
13,081 SF
Lot
0.75 ac (32,743 SF)
APN
131-491-11
UPID
US09-2967251
Cap rate & NOI
Priority signal for investors
Implied cap rate, NOI & suggested price
Cap rate vs submarket · NOI estimate · 3 price anchors
Implied cap rate, NOI & suggested price
Cap vs submarket · NOI estimate · 3 price anchors
Current use
Occupant on record · Public records
-
Subway Take-out & Catering
Value estimations
Realmo proprietary · 4 methods
AI Approach
AI
by Request
CAP Approach
CAP
$2.78M
Comparable Approach
Comparable
$1.41M
Blend (final)
Blend
$2.25M
Owner & transaction history
O & C Investments INC · 15 yrs held
O & C Investments INC
since 2010
7 recorded transactions
Zoning & alternative use
Permitted uses
Permitted uses
Allowed · conditional · prohibited
Cap rate
Implied · in-place · derived from last sale + estimated NOI
Implied Cap rate
#1
Implied · in-place · NOI ÷ last sale
In-place · derived from last sale + estimated NOI
Cap rate, NOI & submarket benchmark
Implied cap rate vs Garden Grove submarket · NOI estimate · Typical band, median & reading
Implied cap rate, NOI & submarket benchmark
Cap vs Garden Grove submarket · NOI estimate · typical band, median & reading
Refine your cap rate
8-question underwriting flow
1.
Property current status — Going-In vs Stabilized
2.
Price for denominator — asking / offer / market
3.
Leasing status & lease structure (NNN / Gross)
4.
Tenant risk profile & vacancy assumption
5.
Upload T12 / rent roll / OM (optional)
Refine in 60 seconds, get exact suggested price
T12 upload · Submarket benchmarks · Sensitivity grid
Suggested price · 3 cap rate anchors
Income approach @ 5% / 7% / 9% — aggressive / typical / conservative
Suggested price at 5% / 7% / 9% cap
Aggressive / typical / conservative · Implied $/SF per anchor · Sensitivity grid
Suggested price at 5% / 7% / 9% cap
Aggressive / typical / conservative · implied $/SF · sensitivity
Value
AI, CAP & Alternative Use estimations · Realmo proprietary blendValue Estimations
Based on Realmo’s proprietary methodology
AI Approach
Method
Estimation
Statistic approach
by Request
ML approach
by Request
CAP Approach
CAP Return
Estimation
6%
$3,010,000
6.5%
$2,775,000
7%
$2,580,000
Blend value · Realmo final
$2.25M
Range $2.02M – $2.47M · ±10%
Realmo estimate · informational only.
These numbers are calculated by our models from public records and may not reflect actual market value.
Not an appraisal.
Verify with a licensed appraiser before transacting. Realmo accepts no liability for divergence from real-world outcomes.
View the full estimation — every method, every assumption
Confidence drivers & risk notes · Custom comparable set · Free for first 3 / day
Full estimation methodology
Every method · every assumption · confidence drivers
Price per SF
Sale + rent benchmarks
Subject property
$172 / SF
Submarket sale & rent benchmarks
Median sale $/SF · Asking & closed rent · Submarket vacancy
Submarket sale & rent benchmarks
Median sale $/SF · asking & closed rent · submarket vacancy
Property tax & assessments
Tax year 2024Property tax & assessments
Tax year 2024
Tax billed
$43,774
Tax year 2024
Assessed value
$2,766,171
Assessed 2024
Previous assessed
$2,766,171
+0.0% YoY
Effective rate
1.58%
On assessed value
Assessed land
$1,155,653
Assessed improvement
$1,610,518
Applied tax rate
17.0000
Comparables
6 recent transactions · within 1.5 miComparable in this city
6 recent transactions
Comparable in this City


Similar Nearby for Sale
Similar Nearby for Lease

Recent comparable sales
Sale price & price/SF · Sale date & distance · Adjustments & confidence
Recent comparable sales
Sale price & $/SF · sale date & distance · adjustments
Property description
Physical attributes from public recordsBuilding & lot
Public records
Property type
Showrooms
Use group
SHOW ROOM, WAREHOUSE
Status
Off-Market
Year built
1987
Heating
NONE
Total area
13,081 SF
Lot
0.75 ac (32,743 SF)
APN
131-491-11
UPID
US09-2967251
Jurisdiction
ORANGE
Metro division
SANTA ANA-ANAHEIM-IRVINE, CA METROPOLITAN DIVISION
Zoning & alternative use
Zoning · permitted uses
Permitted & conditional uses
Allowed uses · Special-permit conditions · Prohibited uses
Permitted & conditional uses
Allowed · special-permit conditions · prohibited
Building & site characteristics
From public records
Year built
1987
Heating
NONE
Lot
0.75 ac
Current owner
From public records · entity-resolved
O & C Investments INC
Entity
Mailing address
2912 STANHOPE DR, SAN JOSE, CA 95121-1743
Mailing matches property
Different — outreach signal
Owner-occupied
No
Ownership since
2010
Owner contacts — direct phone, email, and related entities
Decision-maker phone · Verified email · Related entities & filings
Owner contacts
Email · phone · related entities
Sales History
12 recorded events · public records
Date
Price
Buyer
Seller
Deed Type
Mortgage
Dec 20, 2016
—
Q & C Investments INC
—
Deed
related
$1,955,000 · Bank Of The West
Sep 7, 2010
—
O & C Investments INC
Le Thu,x
Grant Deed
—
Apr 30, 2002
$1,200,000
Anaheim Kingsmen INC
Bl Pad D LLC
Grant Deed
$1,100,000 · Bl Pad D LLC
Oct 29, 2001
$925,000
American Spectrum Holding LLC
No-so INC
Grant Deed
related
—
Oct 31, 1997
$148,500
No.-so INC
Beach & Lampson Square Ltd
Grant Deed
related
—
Jun 29, 1992
$400,000
Beach Square
Idm Corp
Grant Deed
related
—
—
—
Thu X Le
—
Deed Of Trust
related
$1,330,000 · Bank Of East Asia
—
—
Sandra K Smith
—
Deed Of Trust
related
$900,000 · Herson Family Partnership
—
—
Thu X Le
—
Deed Of Trust
related
$1,900,000 · Bank Of East Asia
—
—
Q & C Investments INC
—
Loan Modification
related
—
—
—
Q & C Investments INC
—
Deed Of Trust
related
$1,645,000 · Bank Of East Asia
—
—
Q & C Investments INC
—
Deed Of Trust
related
$1,955,000 · Bank Of The West
Coming soon
Costs & Benchmarks
Operating expenses, capex projections, utility benchmarks, and submarket comparables — all in one view.
Coming soon
Risks
Flood, climate, environmental, title, and tenant-concentration risk — surfaced with mitigations and source citations.
Try Rey
Ask anything about this address in plain English.
“Is 15.6% cap rate sustainable?” · “Best tenant mix for BU1?” · “What’s the redev upside?”
You own 8050 Lampson Ave?
List it free. Reach 20,000 daily buyers.
We’ve already pulled the facts. Confirm photos + price and you’re live in 2 minutes.
List this address →
Full reports are paid
Unlock the full Property Analytics report
Start free for 7 days — no card required. Full owner contacts, all 4 valuations with methodology, refine flow, comparable adjustments, foot-traffic deep dive, export to PDF / CSV.


