
New search
Property profile & analytics
OFF-MARKET
Estimated value
$13,285,000
Industrial properties
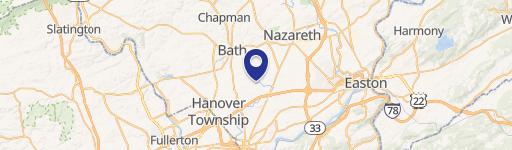
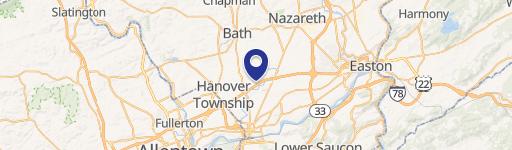
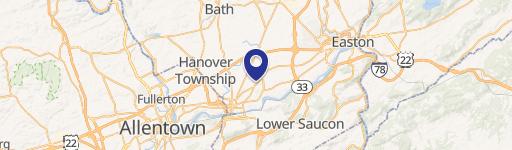
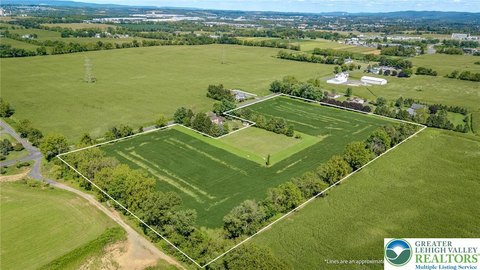
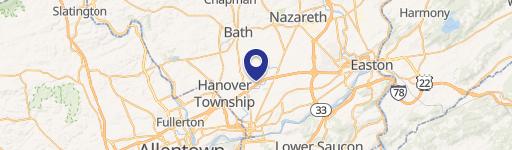
4275 Fritch Dr, Bethlehem, PA 18020-9413
Entity Owned
16-yr Hold
~
Est. High Equity
Property ID
US73-3042852
Property profile
Verified
Property type
Industrial properties
Use group
INDUSTRIAL PARK
Year built
2013
Total area
246,253 SF
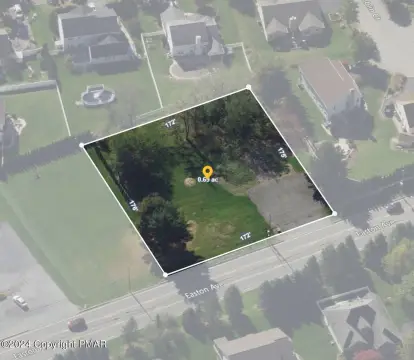
Lot
17.71 ac (771,448 SF)
Zoning code
A
APN
L7 10 2 0418
UPID
US73-3042852
Cap rate & NOI
Priority signal for investors
Implied cap rate, NOI & suggested price
Cap rate vs submarket · NOI estimate · 3 price anchors
Implied cap rate, NOI & suggested price
Cap vs submarket · NOI estimate · 3 price anchors
Current use
Occupant on record · Public records
-
Kuehne + Nagel - Allen Distribution Center Shipping Company Freight Service
-
Kuehne + Nagel Inc. Logistics Company Freight Service
-
Abbott Nutrition Warehouse & Storage
-
Griffin Land & Nurseries Inc Landscaping General Contractor
Value estimations
Realmo proprietary · 4 methods
AI Approach
AI
by Request
CAP Approach
CAP
by Request
Comparable Approach
Comparable
$17.80M
Blend (final)
Blend
$13.29M
Owner & transaction history
Bethlehem Holdings I Riverbend · 16 yrs held
Bethlehem Holdings I Riverbend
since 2010
7 recorded transactions
Zoning & alternative use
A · Bethlehem, PA
Permitted uses
Permitted uses
Allowed · conditional · prohibited
Cap rate
Implied · in-place · derived from last sale + estimated NOI
Implied Cap rate
#1
Implied · in-place · NOI ÷ last sale
In-place · derived from last sale + estimated NOI
Cap rate, NOI & submarket benchmark
Implied cap rate vs Bethlehem submarket · NOI estimate · Typical band, median & reading
Implied cap rate, NOI & submarket benchmark
Cap vs Bethlehem submarket · NOI estimate · typical band, median & reading
Refine your cap rate
8-question underwriting flow
1.
Property current status — Going-In vs Stabilized
2.
Price for denominator — asking / offer / market
3.
Leasing status & lease structure (NNN / Gross)
4.
Tenant risk profile & vacancy assumption
5.
Upload T12 / rent roll / OM (optional)
Refine in 60 seconds, get exact suggested price
T12 upload · Submarket benchmarks · Sensitivity grid
Suggested price · 3 cap rate anchors
Income approach @ 5% / 7% / 9% — aggressive / typical / conservative
Suggested price at 5% / 7% / 9% cap
Aggressive / typical / conservative · Implied $/SF per anchor · Sensitivity grid
Suggested price at 5% / 7% / 9% cap
Aggressive / typical / conservative · implied $/SF · sensitivity
Value
AI, CAP & Alternative Use estimations · Realmo proprietary blendValue Estimations
Based on Realmo’s proprietary methodology
AI Approach
Method
Estimation
Statistic approach
by Request
ML approach
by Request
CAP Approach
CAP Return
Estimation
6%
by Request
6.5%
by Request
7%
by Request
Blend value · Realmo final
$13.29M
Range $11.96M – $14.61M · ±10%
Realmo estimate · informational only.
These numbers are calculated by our models from public records and may not reflect actual market value.
Not an appraisal.
Verify with a licensed appraiser before transacting. Realmo accepts no liability for divergence from real-world outcomes.
View the full estimation — every method, every assumption
Confidence drivers & risk notes · Custom comparable set · Free for first 3 / day
Full estimation methodology
Every method · every assumption · confidence drivers
Price per SF
Sale + rent benchmarks
Subject property
$54 / SF
Submarket sale & rent benchmarks
Median sale $/SF · Asking & closed rent · Submarket vacancy
Submarket sale & rent benchmarks
Median sale $/SF · asking & closed rent · submarket vacancy
Property tax & assessments
Tax year 2024Property tax & assessments
Tax year 2024
Tax billed
$254,733
Tax year 2024
Assessed value
$3,498,600
Assessed 2024
Previous assessed
$3,498,600
+0.0% YoY
Effective rate
7.28%
On assessed value
Assessed land
$281,600
Assessed improvement
$3,217,000
Land market value
$563,200
Improvement market value
$6,434,000
Total market value
$6,997,200
Comparables
6 recent transactions · within 1.5 miComparable in this city
6 recent transactions
Comparable in this City


Similar Nearby for Sale


Similar Nearby for Lease


Recent comparable sales
Sale price & price/SF · Sale date & distance · Adjustments & confidence
Recent comparable sales
Sale price & $/SF · sale date & distance · adjustments
Property description
Physical attributes from public recordsBuilding & lot
Public records
Property type
Industrial properties
Use group
INDUSTRIAL PARK
Status
Off-Market
Year built
2013
Heating
YES
Cooling
CENTRAL
Total area
246,253 SF
Lot
17.71 ac (771,448 SF)
Zoning code
A
APN
L7 10 2 0418
UPID
US73-3042852
Jurisdiction
NORTHAMPTON
Zoning & alternative use
A · Bethlehem, PA
Zoning A · permitted uses
A · Bethlehem, PA
Permitted & conditional uses
Allowed uses · Special-permit conditions · Prohibited uses
Permitted & conditional uses
Allowed · special-permit conditions · prohibited
Bethlehem. Always verify with local authorities before improvements.
Building & site characteristics
From public records
Year built
2013
Heating
YES
Cooling
Yes
Lot
17.71 ac
Current owner
From public records · entity-resolved
Bethlehem Holdings I Riverbend
Entity
Mailing address
1735 MARKET STA400, PHILADELPHIA, PA 19103-7501
Ownership since
2010
Owner contacts — direct phone, email, and related entities
Decision-maker phone · Verified email · Related entities & filings
Owner contacts
Email · phone · related entities
Sales History
7 recorded events · public records
Date
Price
Buyer
Seller
Deed Type
Mortgage
Sep 3, 2025
—
Riverbend Bethlehem Holdings I LLC
—
Deed
related
$700,000,000 · Jpmorgan Chase Bank NA
Nov 19, 2024
—
Riverbend Bethlehem Holdings I LLC
—
Deed
related
$595,000 · Standard Chartered Bank
Jun 29, 2023
—
Riverbend Bethlehem Holdings I LLC
—
Deed
related
$475,000,000 · Standard Chartered Bank
Mar 22, 2010
$1,840,000
Bethlehem Holdings I Riverbend
Bethlehem Crossings IV LLC
Grant Deed
—
Jan 17, 2006
$4,704,550
Bethlehem Crossings IV LLC
Jaindl Realty
Grant Deed
—
—
—
Bethlehem Crossings IV LLC
—
Deed Of Trust
related
$4,736,000 · Bank Of America
—
—
Bethlehem Crossings IV LLC
—
Deed Of Trust
related
$14,500,000 · Bank Of America
Coming soon
Costs & Benchmarks
Operating expenses, capex projections, utility benchmarks, and submarket comparables — all in one view.
Coming soon
Risks
Flood, climate, environmental, title, and tenant-concentration risk — surfaced with mitigations and source citations.
Try Rey
Ask anything about this address in plain English.
“Is 15.6% cap rate sustainable?” · “Best tenant mix for BU1?” · “What’s the redev upside?”
You own 4275 Fritch Dr?
List it free. Reach 20,000 daily buyers.
We’ve already pulled the facts. Confirm photos + price and you’re live in 2 minutes.
List this address →
Full reports are paid
Unlock the full Property Analytics report
Start free for 7 days — no card required. Full owner contacts, all 4 valuations with methodology, refine flow, comparable adjustments, foot-traffic deep dive, export to PDF / CSV.


