
New search
Property profile & analytics
OFF-MARKET
Estimated value
$1,055,000
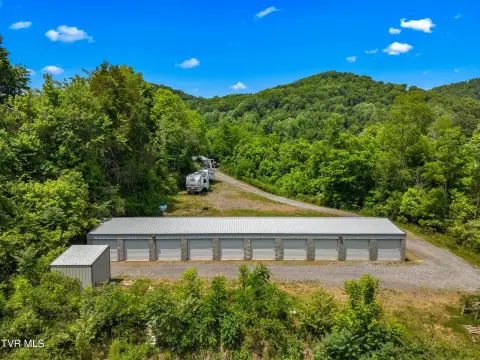
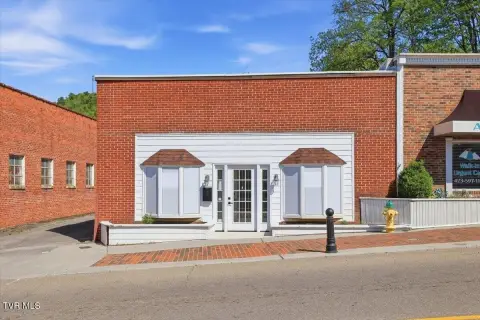
Manufacturing properties
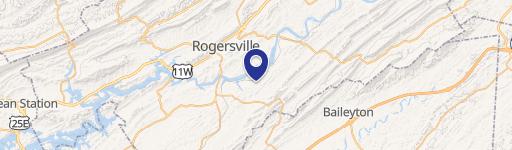
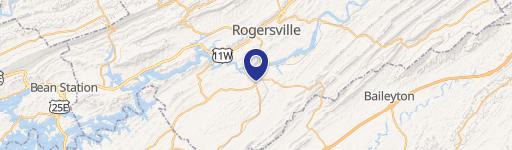
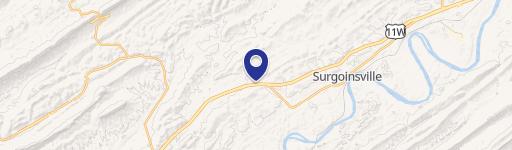
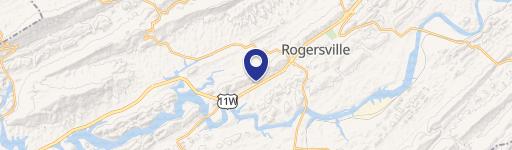
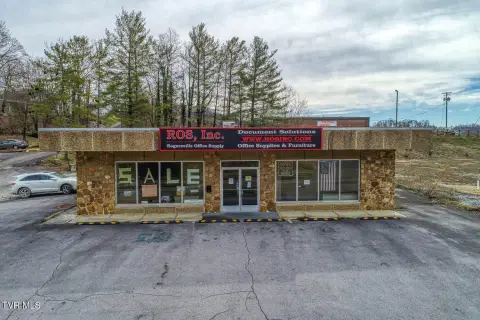
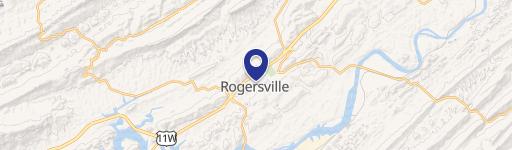
300 Industrial Park Dr, Rogersville, TN 37857-2121
Entity Owned
6-yr Hold
Free & Clear
Property ID
US80-3551825
Property profile
Verified
Property type
Manufacturing properties
Use group
MANUFACTURING (LIGHT)
Year built
1985
Construction
FRAME
Total area
84,660 SF
Lot
9.58 ac (417,305 SF)
Zoning code
R-1
APN
037113 03601
UPID
US80-3551825
Cap rate & NOI
Priority signal for investors
Implied cap rate, NOI & suggested price
Cap rate vs submarket · NOI estimate · 3 price anchors
Implied cap rate, NOI & suggested price
Cap vs submarket · NOI estimate · 3 price anchors
Value estimations
Realmo proprietary · 4 methods
AI Approach
AI
$760k
CAP Approach
CAP
by Request
Comparable Approach
Comparable
$1.36M
Blend (final)
Blend
$1.06M
Owner & transaction history
Sam Dong INC · 6 yrs held
Sam Dong INC
since 2019
3 recorded transactions
Zoning & alternative use
R-1 · Rogersville, TN
Permitted uses
Permitted uses
Allowed · conditional · prohibited
Cap rate
Implied · in-place · derived from last sale + estimated NOI
Implied Cap rate
#1
Implied · in-place · NOI ÷ last sale
In-place · derived from last sale + estimated NOI
Cap rate, NOI & submarket benchmark
Implied cap rate vs Rogersville submarket · NOI estimate · Typical band, median & reading
Implied cap rate, NOI & submarket benchmark
Cap vs Rogersville submarket · NOI estimate · typical band, median & reading
Refine your cap rate
8-question underwriting flow
1.
Property current status — Going-In vs Stabilized
2.
Price for denominator — asking / offer / market
3.
Leasing status & lease structure (NNN / Gross)
4.
Tenant risk profile & vacancy assumption
5.
Upload T12 / rent roll / OM (optional)
Refine in 60 seconds, get exact suggested price
T12 upload · Submarket benchmarks · Sensitivity grid
Suggested price · 3 cap rate anchors
Income approach @ 5% / 7% / 9% — aggressive / typical / conservative
Suggested price at 5% / 7% / 9% cap
Aggressive / typical / conservative · Implied $/SF per anchor · Sensitivity grid
Suggested price at 5% / 7% / 9% cap
Aggressive / typical / conservative · implied $/SF · sensitivity
Value
AI, CAP & Alternative Use estimations · Realmo proprietary blendValue Estimations
Based on Realmo’s proprietary methodology
AI Approach
Method
Estimation
Statistic approach
by Request
ML approach
$760,000
CAP Approach
CAP Return
Estimation
6%
by Request
6.5%
by Request
7%
by Request
Alternative Use
Use
Estimation
INDUSTRIAL (GENERAL)
$1,335,000
Current use
Blend value · Realmo final
$1.06M
Range $950k – $1.16M · ±10%
Realmo estimate · informational only.
These numbers are calculated by our models from public records and may not reflect actual market value.
Not an appraisal.
Verify with a licensed appraiser before transacting. Realmo accepts no liability for divergence from real-world outcomes.
View the full estimation — every method, every assumption
Confidence drivers & risk notes · Custom comparable set · Free for first 3 / day
Full estimation methodology
Every method · every assumption · confidence drivers
Price per SF
Sale + rent benchmarks
Subject property
$12 / SF
Submarket sale & rent benchmarks
Median sale $/SF · Asking & closed rent · Submarket vacancy
Submarket sale & rent benchmarks
Median sale $/SF · asking & closed rent · submarket vacancy
Property tax & assessments
Property tax & assessments
Assessed value
$806,840
Assessed 2023
Previous assessed
$806,840
+0.0% YoY
Assessed land
$57,480
Assessed improvement
$749,360
Land market value
$143,700
Improvement market value
$1,873,400
Total market value
$2,017,100
Applied tax rate
37.0000
Comparables
6 recent transactions · within 1.5 miComparable in this city
6 recent transactions
Comparable in this City
Similar Nearby for Sale


Similar Nearby for Lease

Recent comparable sales
Sale price & price/SF · Sale date & distance · Adjustments & confidence
Recent comparable sales
Sale price & $/SF · sale date & distance · adjustments
Property description
Physical attributes from public recordsBuilding & lot
Public records
Property type
Manufacturing properties
Use group
MANUFACTURING (LIGHT)
Status
Off-Market
Year built
1985
Construction
FRAME
Heating
NONE
Cooling
NONE
Buildings
4
Stories
1
Units
1
Bathrooms
6
Total area
84,660 SF
Lot
9.58 ac (417,305 SF)
Zoning code
R-1
APN
037113 03601
UPID
US80-3551825
Jurisdiction
HAWKINS
Zoning & alternative use
R-1 · Rogersville, TN
Zoning R-1 · permitted uses
R-1 · Rogersville, TN
Permitted & conditional uses
Allowed uses · Special-permit conditions · Prohibited uses
Permitted & conditional uses
Allowed · special-permit conditions · prohibited
Rogersville. Always verify with local authorities before improvements.
Alternative use value scenarios
Repositioning upside vs current use
INDUSTRIAL (GENERAL) Current
Est. value
$1.3M
INDUSTRIAL (GENERAL) Current
Alternative use deep dive — conversion cost, permits, timeline
Conversion cost estimate · Permit path & risks · Stabilized NOI per option
Alternative use deep dive
Conversion cost · permit path · stabilized NOI per option
Building & site characteristics
From public records
Year built
1985
Construction
FRAME
Heating
NONE
Cooling
Yes
Stories
1
Buildings
4
Units
1
Bathrooms
6
Lot
9.58 ac
Current owner
From public records · entity-resolved
Sam Dong INC
Entity
Free & Clear · 6 yrs held
Mailing address
300 INDUSTRIAL PARK DR, ROGERSVILLE, TN 37857-2121
Mailing matches property
Yes
Owner-occupied
Yes
Ownership since
2019
Owner contacts — direct phone, email, and related entities
Decision-maker phone · Verified email · Related entities & filings
Owner contacts
Email · phone · related entities
Sales History
3 recorded events · public records
Date
Price
Buyer
Seller
Deed Type
Mortgage
Sep 26, 2019
—
Sam Dong INC
Industrial Dev Board For Hawki
Quit Claim Deed
related
—
Dec 30, 2008
—
Industrial Dev Board Of Hawkins C
Sam Dong INC
Quit Claim Deed
related
—
Sep 18, 2007
$825,000
Sam Dong INC
Leggett & Platt INC
Grant Deed
—
Coming soon
Costs & Benchmarks
Operating expenses, capex projections, utility benchmarks, and submarket comparables — all in one view.
Coming soon
Risks
Flood, climate, environmental, title, and tenant-concentration risk — surfaced with mitigations and source citations.
Try Rey
Ask anything about this address in plain English.
“Is 15.6% cap rate sustainable?” · “Best tenant mix for BU1?” · “What’s the redev upside?”
You own 300 Industrial Park Dr?
List it free. Reach 20,000 daily buyers.
We’ve already pulled the facts. Confirm photos + price and you’re live in 2 minutes.
List this address →
Full reports are paid
Unlock the full Property Analytics report
Start free for 7 days — no card required. Full owner contacts, all 4 valuations with methodology, refine flow, comparable adjustments, foot-traffic deep dive, export to PDF / CSV.


