Commercial Real Estate Market in East Falmouth, MA
Updated monthly: sale, lease, property records, location trend, and more… · Last update: September 30
82 active listings and 900 off-market properties in East Falmouth, MA. Commercial property asks $554/SF to buy and $29.18/SF/Yr to lease.
Market Trends
East Falmouth, MA spans 27.4 square miles in Barnstable County, Massachusetts. Figures below refresh monthly; last updated 30 September 2026.
Office
Office space in East Falmouth, MA asks $294/SF to buy. Vacancy runs 19.9% across the Northeast region in 2025, up from 13.1% in 2019.
Average Sale Price $/SF
Listings
Vacancy Rate % in Northeast region
Retail
Retail space in East Falmouth, MA asks $411/SF to buy. Vacancy runs 6% across the Northeast region in 2025, little changed from 6% in 2019. Down from a 2020 peak of 7.1%.
Average Sale Price $/SF
Listings
Vacancy Rate % in Northeast region
Industrial
Industrial vacancy in East Falmouth, MA runs 7.6% across the Northeast region in 2025, up from 5.4% in 2019. Nearly 2.4x the 2021 low of 3.2%.
Vacancy Rate % in Northeast region
Multifamily
Multifamily space in East Falmouth, MA asks $572/SF to buy. Vacancy runs 5.6% across the Northeast region in 2025, up from 4% in 2022.
Average Sale Price $/SF
Listings
Vacancy Rate % in Northeast region

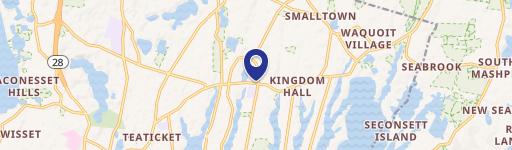
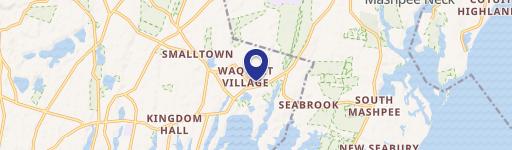
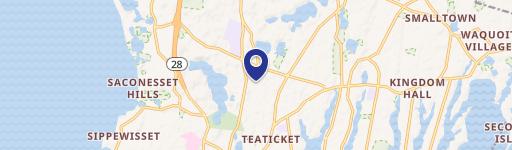
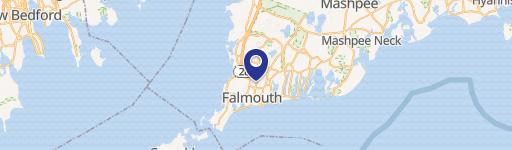
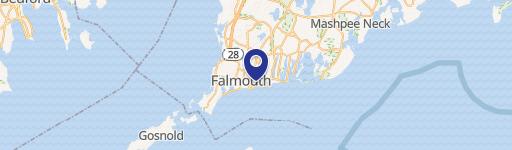
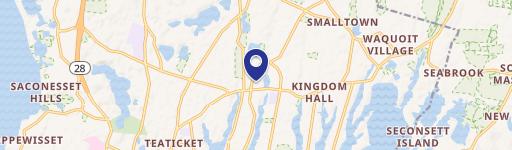
Market overview
Demographics & Economy
East Falmouth, MA has 19,993 residents in 12,151 households. Density runs 731 people per square mile. Median household income here is $95,295 and median gross rent $1,473 a month.
19,993
Population
12,151
Households
1.6
Avg Household Size
53
Median Age
45%
College-Educated
95%
High-School Grad
27.4 sq mi
ZIP Area
731
Density / Sq Mi
$95,295
Median Household Income
$52,868
Median Earnings
$1,473
Median Rent
$496,500
Median Home Value
Tools
Lease vs Buy Breakeven
At $29.18/SF/Yr lease vs $554/SF buy → buying wins if held > 8.4 years.
At a 5.3% gross asking yield the payback reads short relative to leasing. Assumes 30% down at 6.5% fixed, 2% a year in taxes and upkeep, 3% appreciation, 5% opportunity cost, 2% closing plus 5% selling costs, and a 3% annual rent escalator.
Nearby Markets
| Market | Average Sale Price, $/SF | Average Lease Price, $/SF/Yr |
|---|---|---|
| Falmouth | — | $29.18 |
| Mashpee | — | — |
| Sandwich | — | $19.83 |
| Tisbury | — | — |
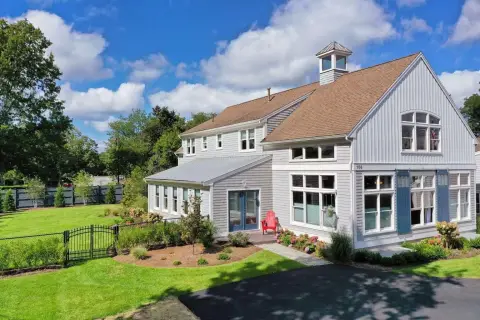
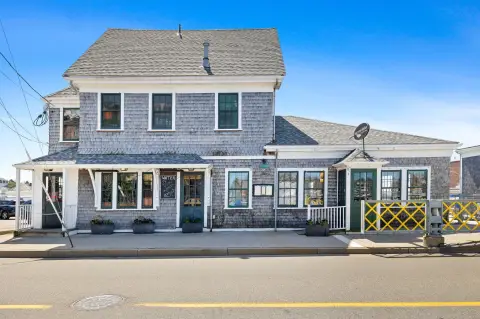
Commercial property in East Falmouth, MA asks $554/SF.

Frequently Asked Questions
What is the average price per square foot for commercial property in East Falmouth?
Commercial property in East Falmouth, MA asks an average of $554 per square foot. The 3 most recent recorded sales traded at a median of $127/SF, so asking sits 338% above the achieved median. Multifamily carries the highest asking price at $572/SF.
How much does it cost to lease commercial space in East Falmouth?
Asking lease rates in East Falmouth, MA average $29.18 per square foot per year.
Is it cheaper to lease or buy commercial space in East Falmouth?
Buying beats leasing in East Falmouth, MA if the property is held longer than 8.4 years, comparing $29.18/SF/Yr asking rent with $554/SF asking price. The model assumes 30% down at 6.5% fixed, 2% of value per year in taxes and upkeep, 3% appreciation, 5% opportunity cost on the cash and a 3% annual rent escalator.
Where does Realmo's East Falmouth market data come from?
Realmo compiles East Falmouth, MA figures from 4 recent recorded sales, 54 active sale listings, 28 active lease listings, 900 tracked off-market properties. Sale and lease figures refresh monthly; vacancy annually. Last updated 30 September 2026.
Methodology & data sources
- Asking prices and averages
- Computed from 54 active for-sale and 28 active for-lease listings in East Falmouth, MA. These are ASKING figures from live listings, not closed-transaction prices, and a segment carried by a handful of listings reads as indicative rather than an average.
- Vacancy rates
- Published per-sector market series, taken at the metro level where one exists and otherwise at the Census-region level — a chart reading "in <region> region" is a regional number, not this city's.
- Refresh
- The monthly aggregates close at the end of the previous month, so 30 September 2026 — not today — is the honest last update.
- Known limitations
- office vacancy is reported at Northeast region level, retail vacancy is reported at Northeast region level, industrial vacancy is reported at Northeast region level and asking prices run materially above recent closed pricing.
- Coverage
- Metrics below the 10-observation threshold fall back one geographic level. The geography used is named on each figure.
Compiled by the Realmo Data team · reviewed 30 September 2026 · How Realmo checks market page data · Report a data issue