Commercial Real Estate Market in S Fort Myers, FL
Updated monthly: sale, lease, property records, location trend, and more… · Last update: October 31
1,796 active listings and 7,970 off-market properties in S Fort Myers, FL. Commercial property asks $321/SF to buy and $19.39/SF/Yr to lease.
Market Trends
Figures below refresh monthly; last updated 31 October 2026.
Office
Office vacancy in S Fort Myers, FL runs 20.2% across the South region in 2025, up from 14.4% in 2019.
Vacancy Rate % in South region
Retail
Retail vacancy in S Fort Myers, FL runs 5.4% across the South region in 2025, down from 7% in 2020.
Vacancy Rate % in South region
Industrial
Industrial space in S Fort Myers, FL asks $16.49/SF/Yr to lease. Vacancy runs 7.9% across the South region in 2025, up from 6% in 2019. Nearly 2.3x the 2022 low of 3.5%.
Average Lease Price $/SF/Yr
Listings
Vacancy Rate % in South region
Multifamily
Multifamily space in S Fort Myers, FL asks $191/SF to buy. Vacancy runs 11.3% across the South region in 2025, up from 8.5% in 2022.
Average Sale Price $/SF
Listings
Vacancy Rate % in South region


Market overview
Tools
Lease vs Buy Breakeven
At $19.39/SF/Yr lease vs $321/SF buy → buying wins if held > 5.1 years.
At a 6% gross asking yield the payback reads short relative to leasing. Assumes 30% down at 6.5% fixed, 2% a year in taxes and upkeep, 3% appreciation, 5% opportunity cost, 2% closing plus 5% selling costs, and a 3% annual rent escalator.
Nearby Markets
| Market | Average Sale Price, $/SF | Average Lease Price, $/SF/Yr |
|---|---|---|
| Fort Myers | — | $19.39 |
| Estero | — | — |
| Fort Myers Beach | — | $49.03 |
| North Fort Myers | — | $20.50 |
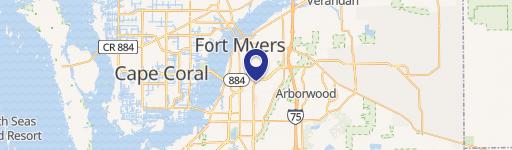
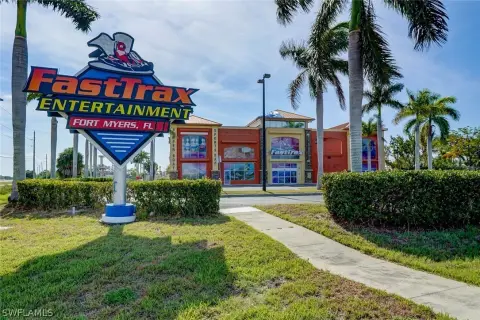
Commercial property in S Fort Myers, FL asks $321/SF.





Frequently Asked Questions
What is the average price per square foot for commercial property in S Fort Myers?
Commercial property in S Fort Myers, FL asks an average of $321 per square foot. The 7 most recent recorded sales traded at a median of $271/SF, so asking sits 19% above the achieved median. Multifamily carries the highest asking price at $191/SF.
How much does it cost to lease commercial space in S Fort Myers?
Asking lease rates in S Fort Myers, FL average $19.39 per square foot per year. Industrial asks $16.49/SF/Yr as of Q2 26, down from $17.75/SF/Yr in Q1 26.
Is it cheaper to lease or buy commercial space in S Fort Myers?
Buying beats leasing in S Fort Myers, FL if the property is held longer than 5.1 years, comparing $19.39/SF/Yr asking rent with $321/SF asking price. The model assumes 30% down at 6.5% fixed, 2% of value per year in taxes and upkeep, 3% appreciation, 5% opportunity cost on the cash and a 3% annual rent escalator.
Where does Realmo's S Fort Myers market data come from?
Realmo compiles S Fort Myers, FL figures from 7 recent recorded sales, 1,450 active sale listings, 346 active lease listings, 7,970 tracked off-market properties. Sale and lease figures refresh monthly; vacancy annually. Last updated 31 October 2026.
Methodology & data sources
- Asking prices and averages
- Computed from 1,450 active for-sale and 346 active for-lease listings in S Fort Myers, FL. These are ASKING figures from live listings, not closed-transaction prices, and a segment carried by a handful of listings reads as indicative rather than an average.
- Vacancy rates
- Published per-sector market series, taken at the metro level where one exists and otherwise at the Census-region level — a chart reading "in <region> region" is a regional number, not this city's.
- Refresh
- The monthly aggregates close at the end of the previous month, so 31 October 2026 — not today — is the honest last update.
- Known limitations
- office vacancy is reported at South region level, retail vacancy is reported at South region level and industrial vacancy is reported at South region level.
- Coverage
- Metrics below the 10-observation threshold fall back one geographic level. The geography used is named on each figure.
Compiled by the Realmo Data team · reviewed 31 October 2026 · How Realmo checks market page data · Report a data issue