Auto Shop with Service
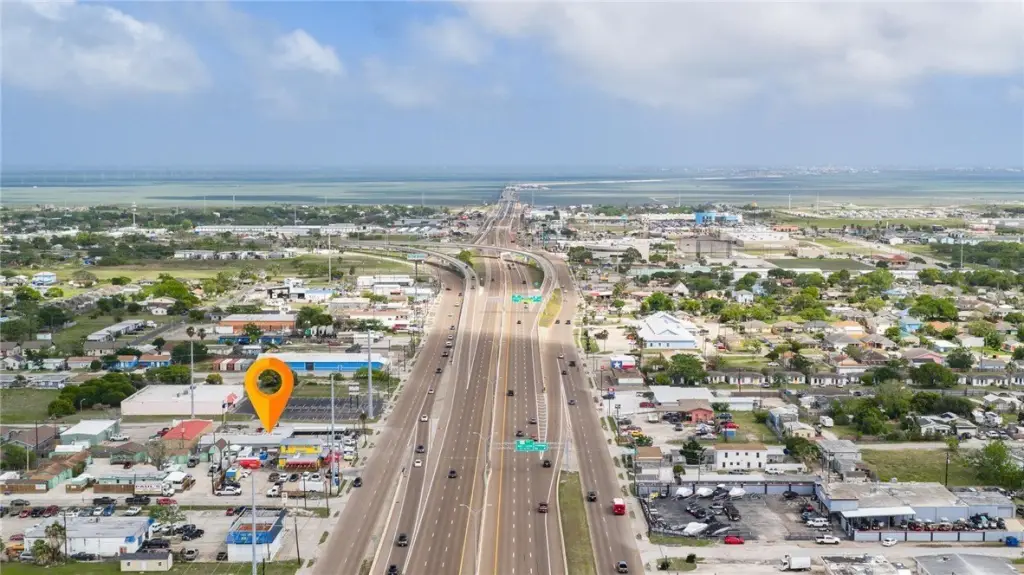
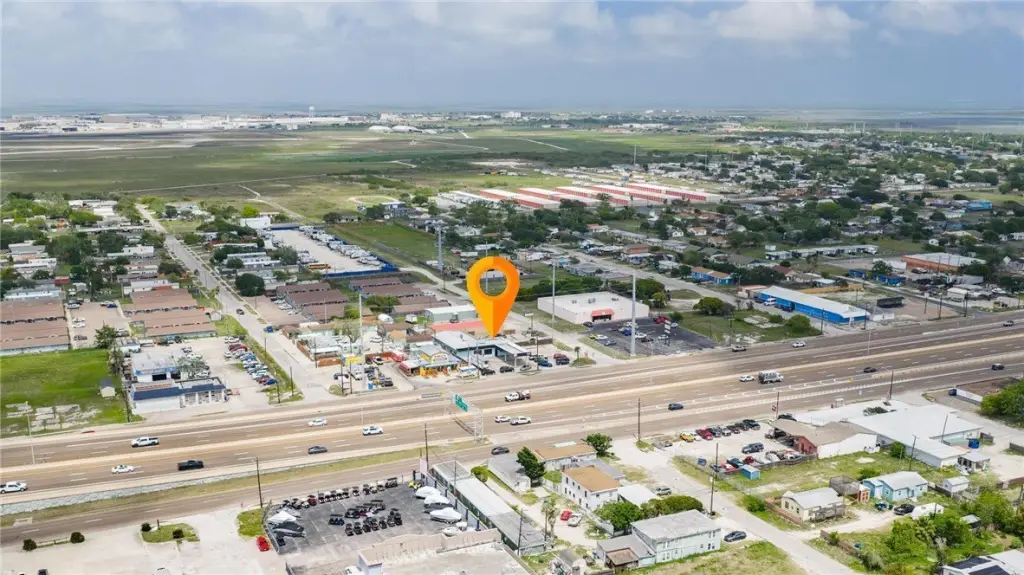
For Sale
$699,000
Pending
9818 S Padre Island Drive, Corpus Christi, TX 78418
CommercialSale, Corpus Christi, TX
Property Size3,796 SF
Lot Size0.49 Acres
Days on Market182
Property Features for 9818 S Padre Island Drive
General Information
Property type
Commercial Sale
Property subtype
Other
Parking features
Garage
Subdivision
Flour Bluff Park
Lot features
Interior Lot, Level
Standard status
Pending
APN
254000150480
Size
3,796 SF
Lot size
0.49 Acres
Taxes and HOA fees
Tax Description
FLOUR BLUFF PARK BLK 15 LTS W/2 OF LTS 48, 49, 50 & A
Legal Description
FLOUR BLUFF PARK BLK 15 LTS W/2 OF LTS 48, 49, 50 & A
Utilities
Sewer type
Public Sewer
Heating system
Central, Electric (Heating)
Cooling system
Central Air
Water source
Public
Amenities
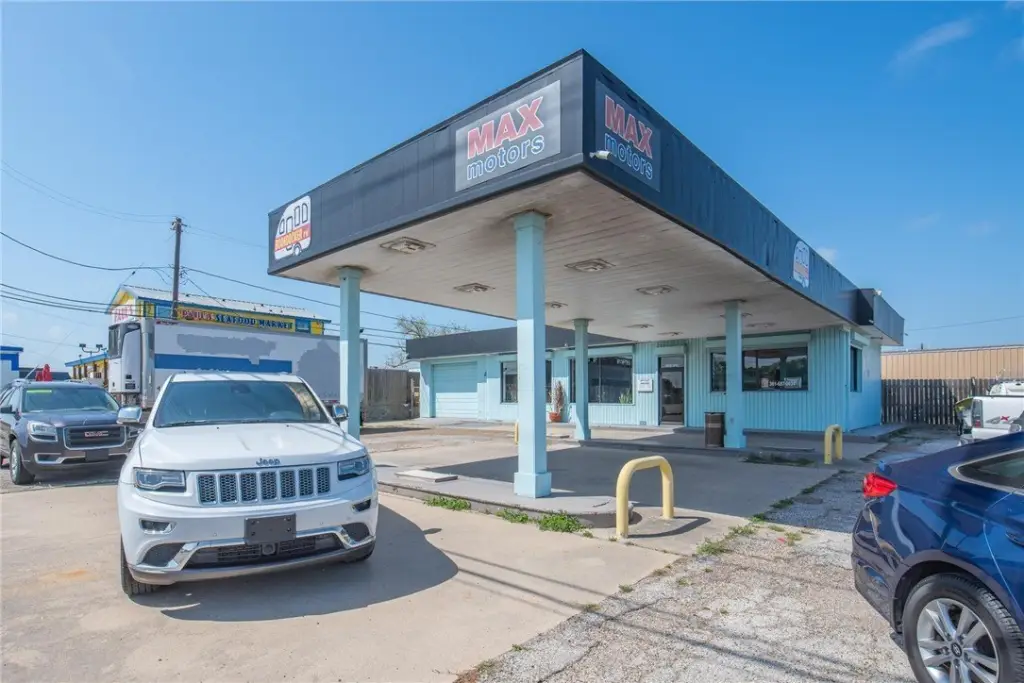
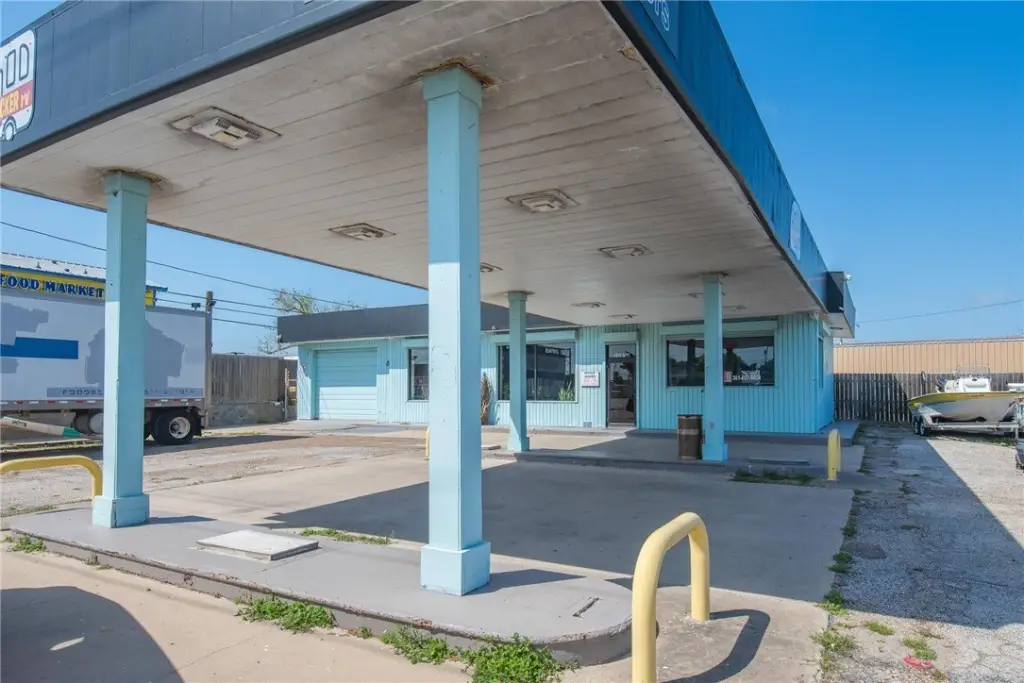
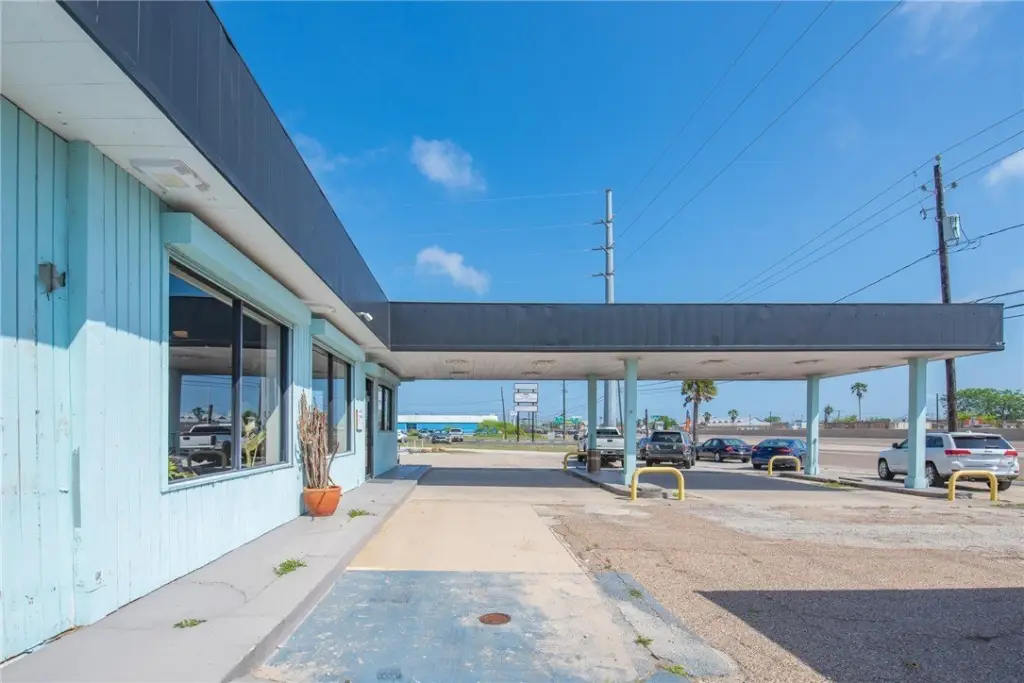
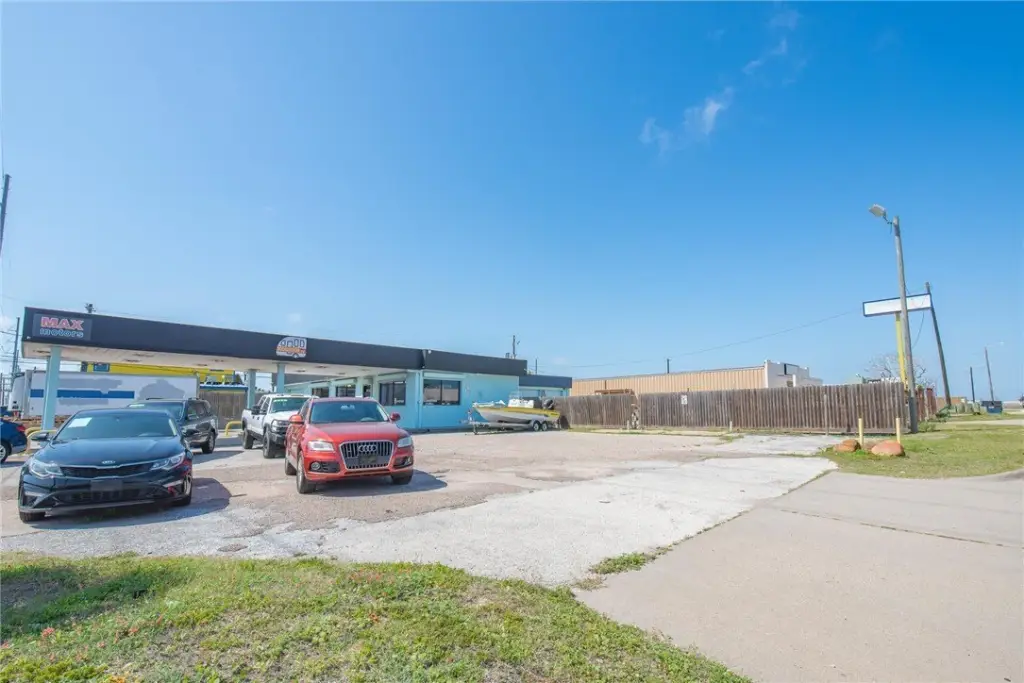
covered drive-through canopy
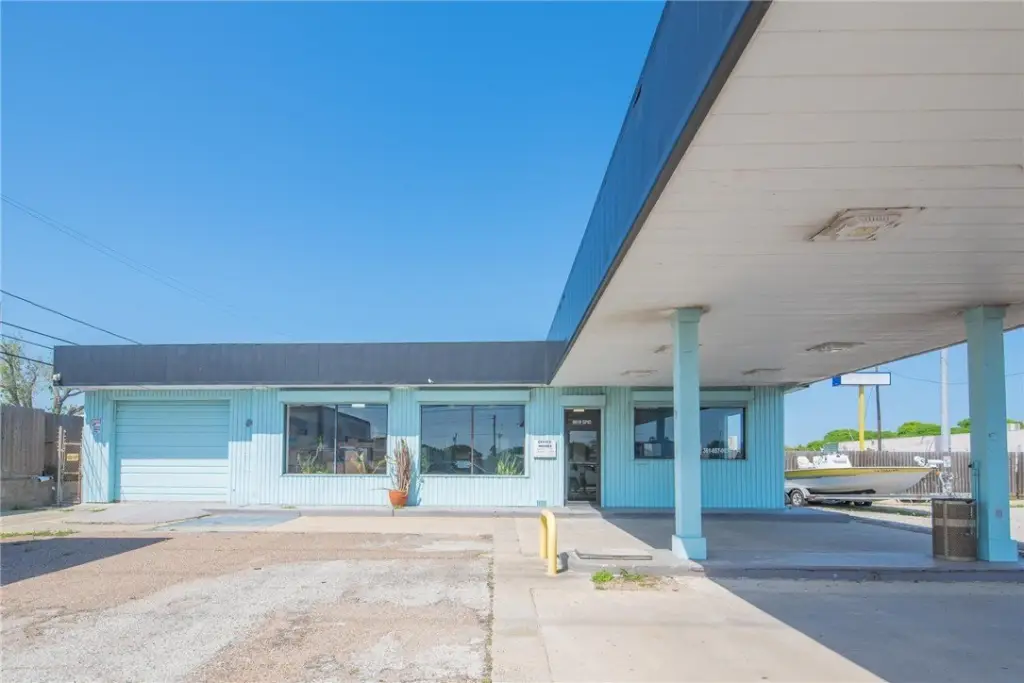
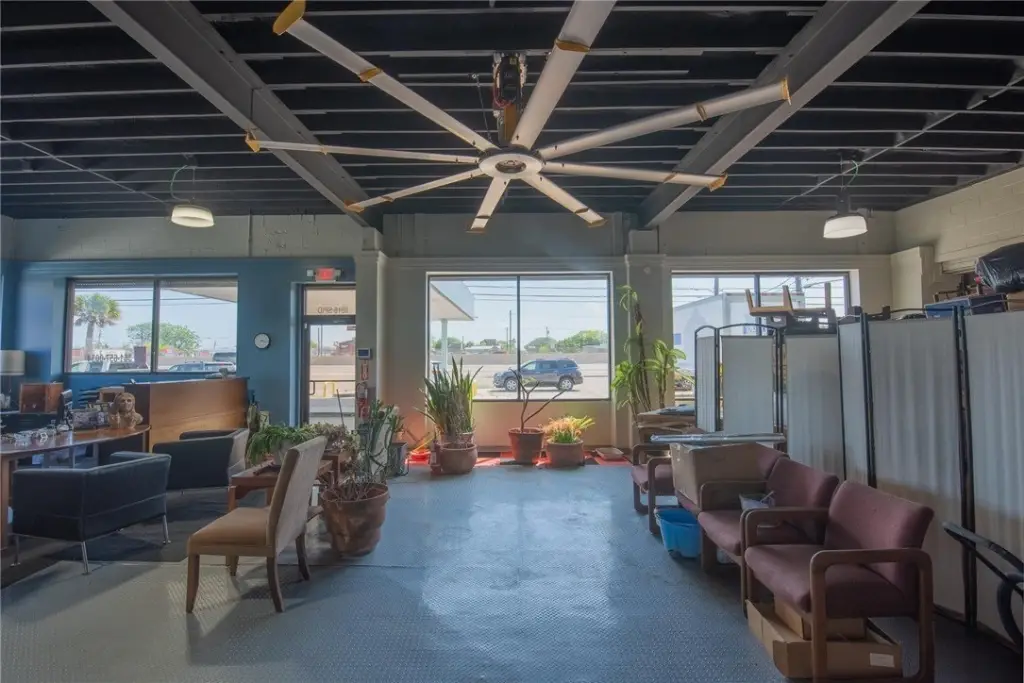
large front-facing windows
open reception area
private office potential
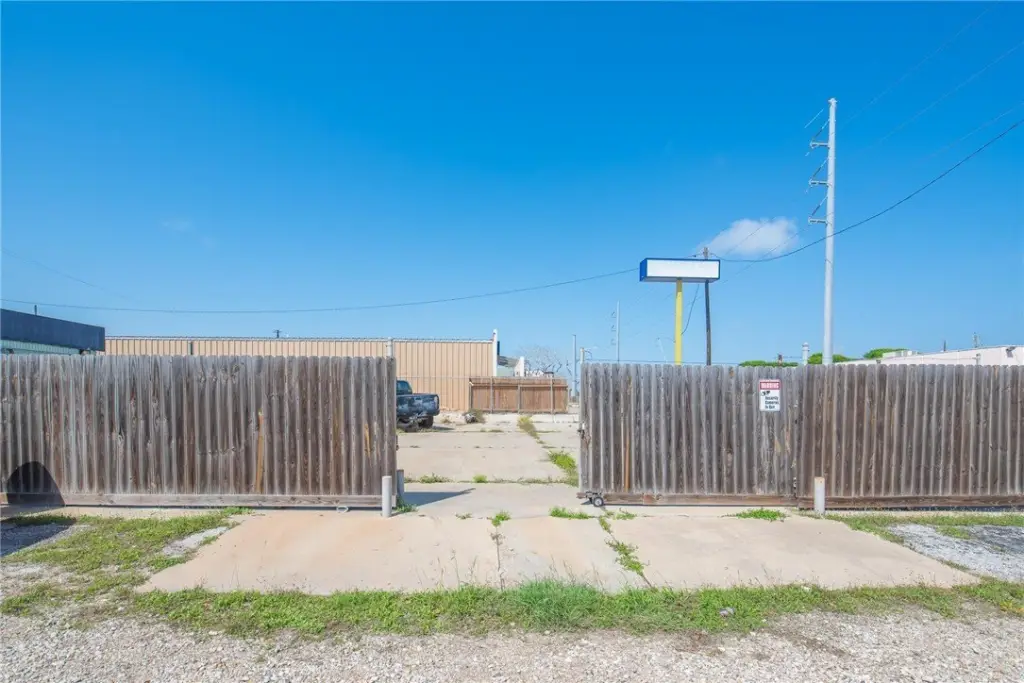
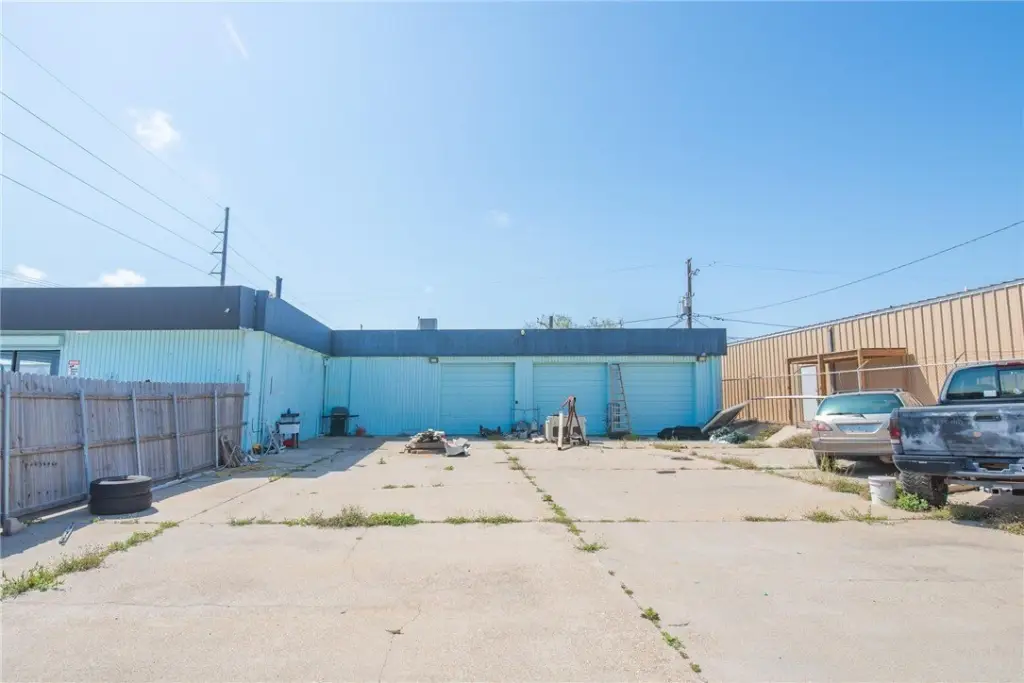
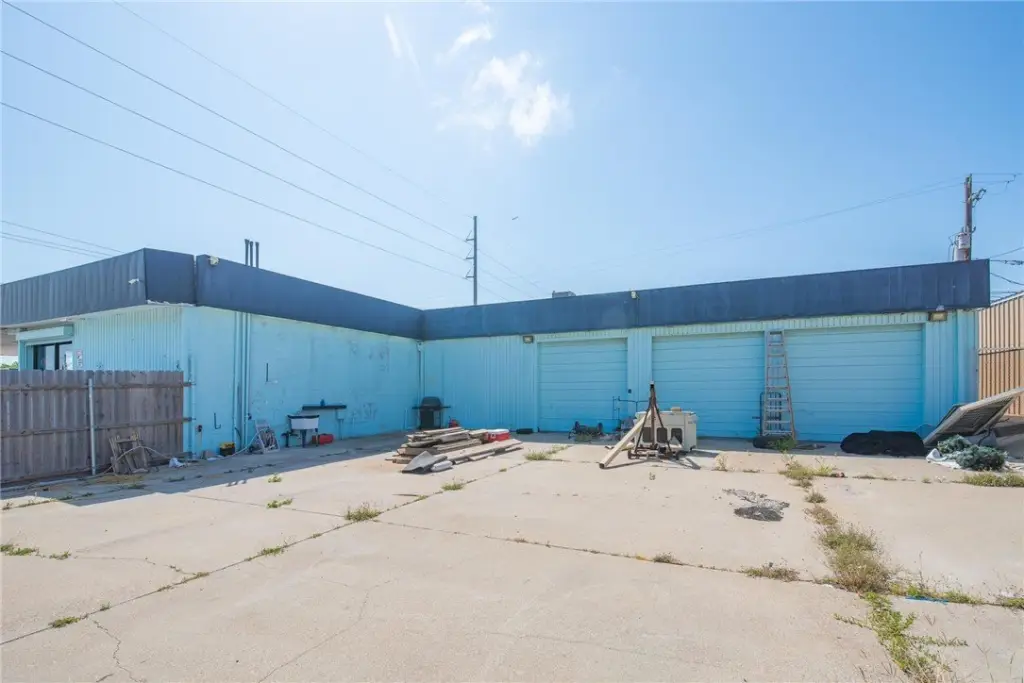
expansive concrete yard
Building Details
Year built
1988
Floors in Building
1
Listing Agency:
Keller Williams Coastal Bend · Keller Williams Realty
(361) 225-7900
Listed By:
Victor Rivera · License #0679506
(214) 293-0684
Added: Apr 16
Changed: Oct 9
Last Checked: Oct 14 at 7:06AM
MLS# 474891
Copyright © 2026 South Texas Multiple Listing Service, LLC. All rights reserved. All information provided by the listing agent/broker is deemed reliable but is not guaranteed and should be independently verified.
Investment Insights
Based on property information with market context.
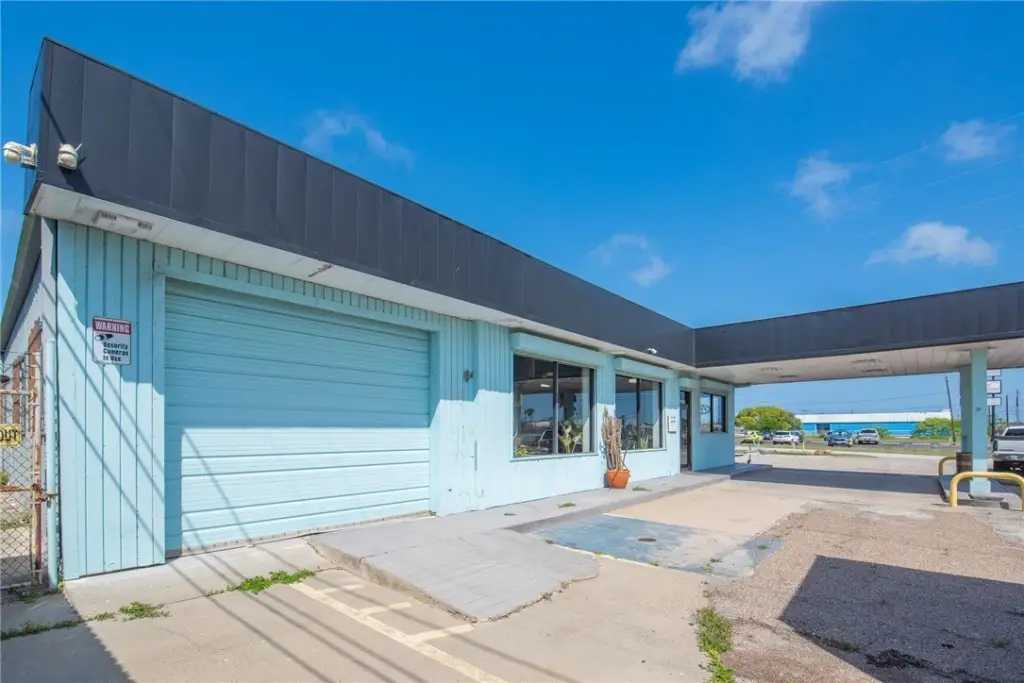
This 3,796-square-foot auto shop, built in 1988, combines a front office and showroom with multiple service bays fitted with roll-up doors. Large front windows provide natural light and street-facing exposure, while the covered drive-through canopy supports vehicle intake, display, or customer drop-off. The property also includes central heating and central air, a garage, public water, and public sewer.
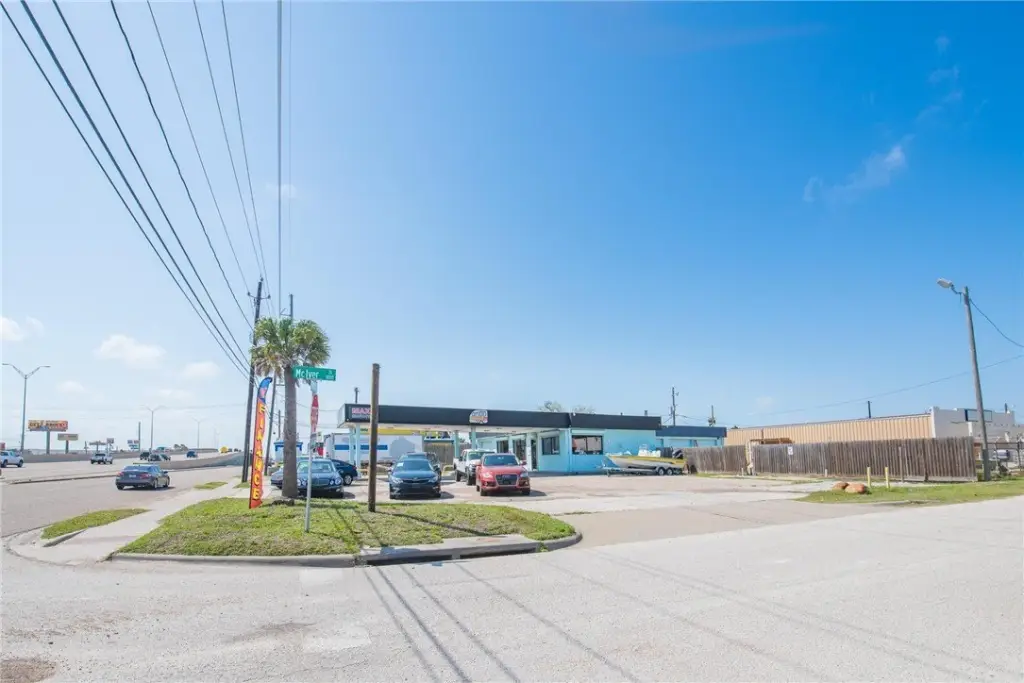
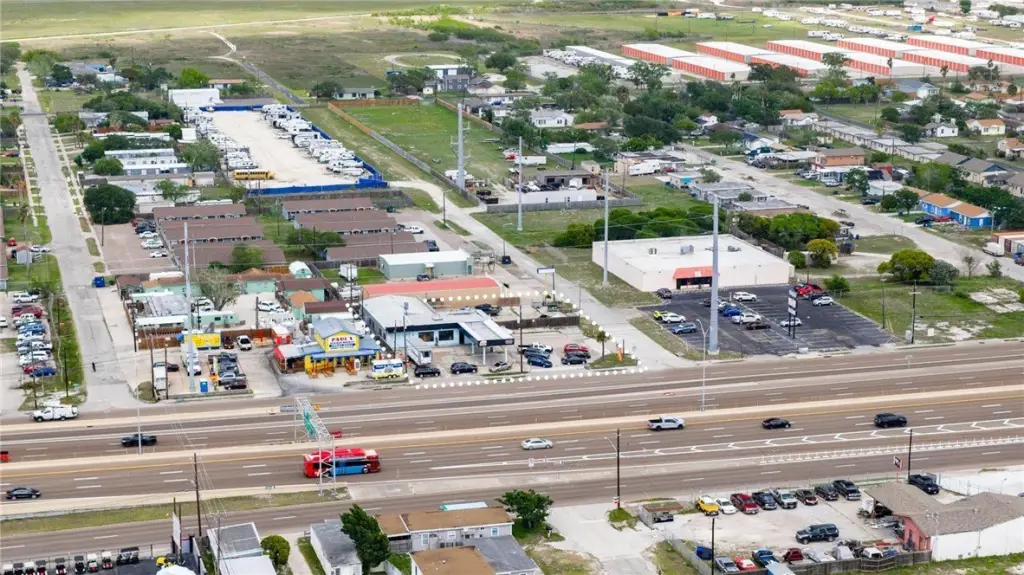
The 0.4917-acre site occupies a corner at 9818 S Padre Island Drive in Corpus Christi, near NAS-CC. A concrete yard provides space for equipment storage or fleet parking, and a fenced rear section offers controlled-access storage. Convenient ingress and egress connect the property with surrounding residential and commercial areas, as well as nearby coastal access.
The 0.4917-acre site occupies a corner at 9818 S Padre Island Drive in Corpus Christi, near NAS-CC. A concrete yard provides space for equipment storage or fleet parking, and a fenced rear section offers controlled-access storage. Convenient ingress and egress connect the property with surrounding residential and commercial areas, as well as nearby coastal access.
Key Highlights
- 3,796‑square‑foot auto shop on a 0.4917‑acre site
- Built in 1988 with front office and showroom space
- Multiple service bays with roll‑up doors
Financial Insights
Estimated NOI and Cap Rate
NOI / Yr
$43,764
Cap Rate
6.26%
Suggested Prices Based on Cap Rates
Cap Rate 5%
$875,280
$875.3K
Cap Rate 7%
$625,200
$625.2K
Cap Rate 9%
$486,267
$486.3K
Market Conditions
NOI Build-Up for 3,796 SF
Gross rent
$68.3K $18.00/SF
− Vacancy
−$5.8K −$1.53/SF
EGI
$62.5K $16.47/SF
− OpEx
−$18.8K −$4.94/SF
NOI
$43.8K $11.53/SF
Area
ZIP 78418
Vacancy
8.50%
Lease Rate
$18.00 /SF/Yr
Expense Ratio
30.00%
Simulate Cap Rate and NOI
Suggested Prices Based on Cap Rates
Cap Rate 5%
$875,280
Cap Rate 7%
$625,200
Cap Rate 9%
$486,267
Alternative Uses
Best Use
Retail
$625.2K
$547.1K – $729.4K
NOI $43,764 @ 7.0% cap · market cap 6.26%
Second Best
Industrial
$363.2K
$317.8K – $423.7K
NOI $25,423 @ 7.0% cap · market cap 3.64%
Theoretical Best
Office A
$1.45M
$1.27M – $1.69M
NOI $101,578 @ 7.0% cap · market cap 14.53%
Zoning and permitted uses should be independently verified with authorities.
How Realmo checks its estimates
Property Analytics
Unlock full access to Insights
Subscribe to Realmo Intelligence
Open Analytics
Current Use
Lease Details
Yes
Fenced yard
Yes
Paved road access
Location Intelligence
Trade Area within ½ mile
470
Businesses Nearby
Well-served
Demand for This Use
Explore this area
Business Placement
Demographics for 78418, TX
31,787
Population
16,171
Households
2
Avg Household Size
42
Median Age
33%
College-Educated
91%
High-School Grad
73.3 sq mi
ZIP Area
434
Density / Sq Mi
$91,443
Median Household Income
$51,914
Median Earnings
$1,301
Median Rent
$274,800
Median Home Value
Check the figures for this property
Cap Rate, Value Estimation, Potential NOI and more
View Realmo Analytics
Market
Vacancy Rate% for Retail in South region

Questions? Ask Rey
Realmo’s AI knows this listing — price, zoning, demand, history. Ask anything.
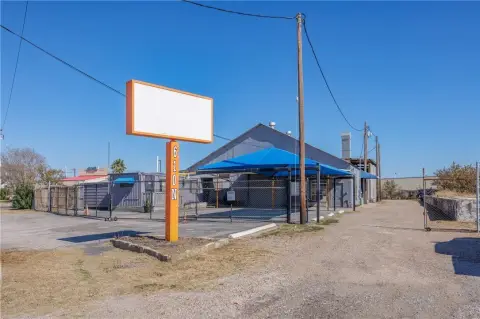

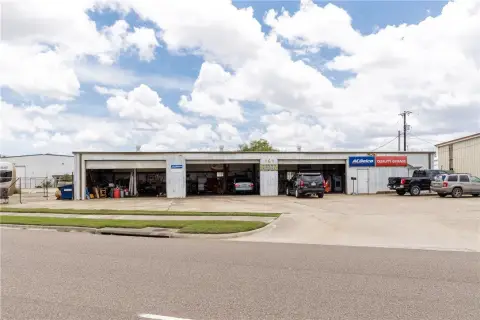


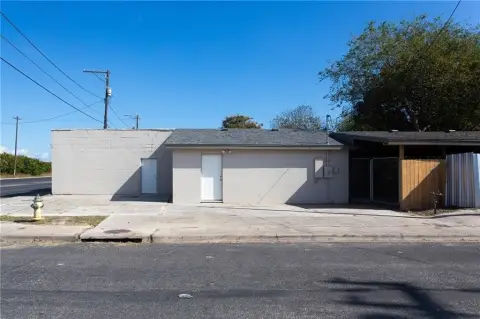

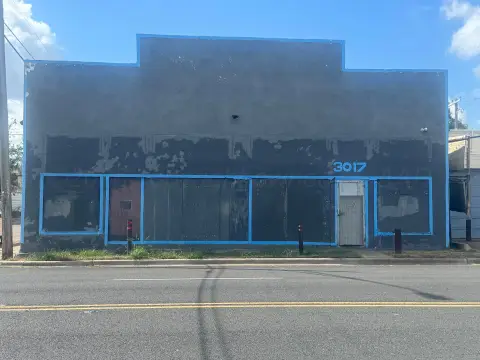
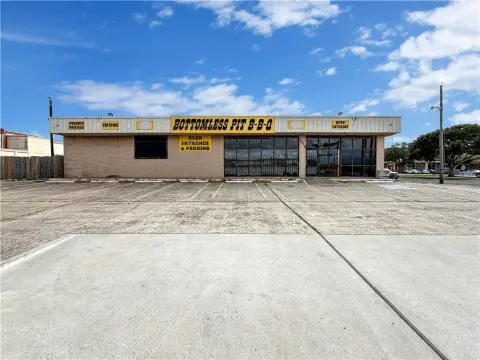

Similar Off Market Nearby
- Coastal performance — 1126 Cline St, Corpus Christi, TX 78418
- Take 5 Oil Change — 1237 Waldron Rd, Corpus Christi, TX 78418
- The Mechanic Shop — 1109 Cline St, Corpus Christi, TX 78418
- SV Auto and Fleet Service .................s&vautogroupllc — 1118 Cline St, Corpus Christi, TX 78418
- SV Auto and Fleet Service — 1118 Cline St, Corpus Christi, TX 78418
Frequently Asked Questions
What type of property is this?
Auto shop - Showroom and service configuration with a covered drive-through canopy and fenced rear storage area.
Where is this auto shop located?
The property is located at 9818 S Padre Island Drive Corpus Christi, TX.
What is the asking price?
The asking price for this property is $699,000.
What are key features of this property?
This property features: 3,796‑square‑foot auto shop on a 0.4917‑acre site; Built in 1988 with front office and showroom space; Multiple service bays with roll‑up doors


