Elkhart Industrial Property For
For Sale
Contact for pricing
57909 IN-19, Elkhart, IN 46517
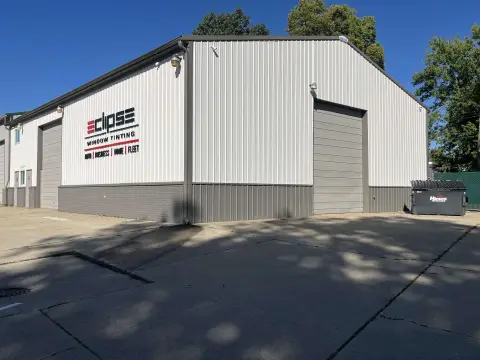
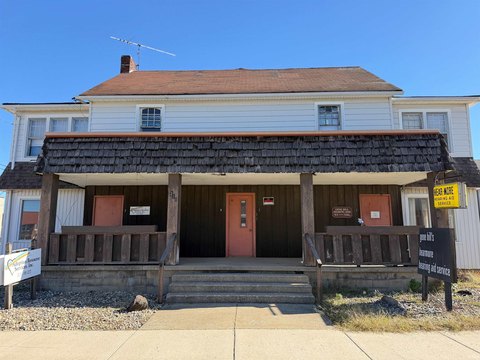
Three-building industrial property suitable for automotive use in Elkhart, IN.
Property Size5,660 SF
Price / SF$66.25
Days on Market772
Property Features for 57909 IN-19
General Information
Standard status
Active
Size
5,660 SF
Property subtype
Industrial
Zoning
PUD M-1
Listing Agency:
NAI Cressy - Mishawaka
Listed By:
Jonah Davey · License #LIC RB21000300
Source:
Crexi
Added: Sep 9, 2024
Changed: Oct 16
Last Checked: Oct 19 at 4:54AM
Displayed information is deemed reliable but is not guaranteed and should be independently verified. All listing content including descriptions, pricing, images are the copyrighted material of NAI Cressy - Mishawaka

Ask AI about this property
Review the available facts, identify missing information and prepare questions for the agent.
Investment Insights
Based on property information with market context.
This industrial property comprises three buildings, offering potential for automotive and other commercial uses. Building 1 features 3,200 square feet of space, including a main level office, an upstairs loft with three offices, and four large garage doors suitable for accommodating large trucks or RVs. Building 2 provides 2,400 square feet of space, complemented by an additional 480 square foot canopy or overhang. Building 3 offers 600 square feet of space. The property is located on SR 19, south of the St. Joe County River in Elkhart, Indiana, with the nearest major intersection being US 20.
Key Highlights
- Three‑building industrial property suitable for automotive use
- Building 1 features 3,200 SF with a main level office, 3 upstairs offices, and 4 large garage doors
- Four large garage doors can accommodate large trucks or RVs**
Financial Insights
Estimated NOI and Cap Rate
NOI / Yr
$33,916
Cap Rate
9.04%
Suggested Prices Based on Cap Rates
Cap Rate 5%
$678,320
$678.3K
Cap Rate 7%
$484,514
$484.5K
Cap Rate 9%
$376,844
$376.8K
Market Conditions
NOI Build-Up for 5,660 SF
Gross rent
$53.7K $9.48/SF
− Vacancy
−$5.2K −$0.92/SF
EGI
$48.5K $8.56/SF
− OpEx
−$14.5K −$2.57/SF
NOI
$33.9K $5.99/SF
Area
Elkhart County, IN
Vacancy
9.70%
Lease Rate
$9.48 /SF/Yr
Expense Ratio
30.00%
Simulate Cap Rate and NOI
Suggested Prices Based on Cap Rates
Cap Rate 5%
$678,320
Cap Rate 7%
$484,514
Cap Rate 9%
$376,844
Alternative Uses
Best Use
Retail
$1.04M
$908.1K – $1.21M
NOI $72,647 @ 7.0% cap · market cap 19.37%
Second Best
Industrial
$484.5K
$424.0K – $565.3K
NOI $33,916 @ 7.0% cap · market cap 9.04%
Theoretical Best
Specialty Retail
$1.05M
$916.9K – $1.22M
NOI $73,354 @ 7.0% cap · market cap 19.56%
Zoning and permitted uses should be independently verified with authorities.
How Realmo checks its estimates
Property Analytics
Current Use
Location Intelligence
Trade Area within ½ mile
30
Businesses Nearby
Well-served
Demand for This Use
Explore this area
Business Placement
Demographics for 46517, IN
24,006
Population
9,915
Households
2.4
Avg Household Size
36
Median Age
15%
College-Educated
81%
High-School Grad
36.9 sq mi
ZIP Area
651
Density / Sq Mi
$53,263
Median Household Income
$34,649
Median Earnings
$942
Median Rent
$168,500
Median Home Value
Market
Vacancy Rate% for Retail in Midwest region





Frequently Asked Questions
What type of property is this?
Automotive property - Three-building industrial property suitable for automotive use in Elkhart, IN.
Where is this automotive property located?
The property is located at 57909 IN-19 Elkhart, IN.
What is the asking price?
The asking price for this property is $375,000.
What are key features of this property?
This property features: Three‑building industrial property suitable for automotive use; Building 1 features 3,200 SF with a main level office, 3 upstairs offices, and **4 large garage doors**; Four large garage doors can accommodate large trucks or RVs**


