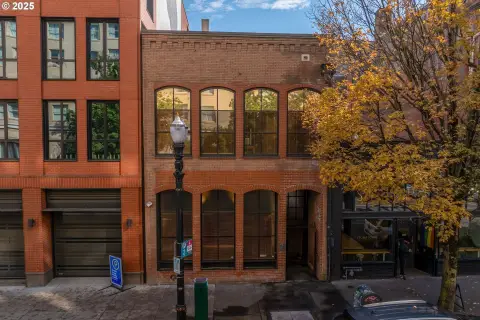
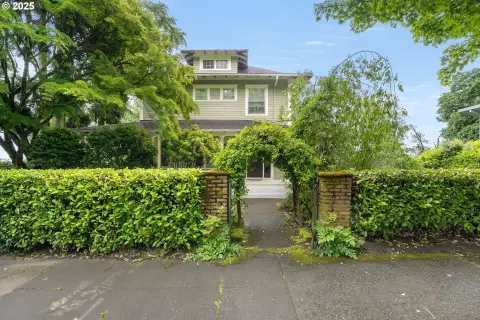
Modern Office Building with
For Sale
Contact for pricing
4504 S Corbett Ave, Portland, OR 97239
Office building with river and mountain views near downtown.
Property Size15,720 SF
Price / SF$149.49
Days on Market1468
Property Features for 4504 S Corbett Ave
General Information
Standard status
Active
Size
15,720 SF
Class
B
Total Parking Spaces
15
Property subtype
Office
Zoning
Commercial
Occupancy
100%
Lease Type
Gross
Investment Type
Owner/User
Building Details
Year Built
1954
Year Renovated
1985
Buildings
1
Stories
3
Units
10
Tenancy
Multi
Listing Agency:
Graham Realty Group LLC
Listed By:
Galen Graham · License #OR200702032
Source:
Crexi
Added: Sep 30, 2022
Changed: Sep 14
Last Checked: Oct 5 at 5:09PM
Displayed information is deemed reliable but is not guaranteed and should be independently verified. All listing content including descriptions, pricing, images are the copyrighted material of Graham Realty Group LLC
Investment Insights
Based on property information with market context.
The Panorama Building is a modern office complex suitable for an owner-user or investment property. It features views of the Willamette River and Mount Hood, situated in a quiet neighborhood. The building has undergone recent capital improvements, including a new roof and HVAC systems throughout. Tenant improvements have been completed in 90% of the suites. The building is elevator-served and equipped with a fire sprinkler system, a security alarm system, and key card access available 24 hours per day. Additional amenities include a tenant break room, a shower suite, and an on-site parking garage, with off-site permit parking also available. Large windows enhance the neighborhood, Mount Hood, and Willamette River views, providing natural lighting. The Panorama Building is located minutes from downtown Portland, with easy access to Barbur Blvd., Interstate 5, and HWY 99.
Key Highlights
- Excellent views of the Willamette River and Mount Hood.
- Recent capital improvements: new roof and HVAC systems.
- Modern design with large windows and excellent natural lighting.
Financial Insights
Estimated NOI and Cap Rate
NOI / Yr
$203,491
Cap Rate
8.66%
Suggested Prices Based on Cap Rates
Cap Rate 5%
$4,069,820
$4.1M
Cap Rate 7%
$2,907,014
$2.9M
Cap Rate 9%
$2,261,011
$2.3M
Market Conditions
NOI Build-Up for 15,720 SF
Gross rent
$358.4K $22.80/SF
− Vacancy
−$87.1K −$5.54/SF
EGI
$271.3K $17.26/SF
− OpEx
−$67.8K −$4.31/SF
NOI
$203.5K $12.94/SF
Area
Portland, OR
Vacancy
24.30%
Lease Rate
$22.80 /SF/Yr
Expense Ratio
25.00%
Simulate Cap Rate and NOI
Suggested Prices Based on Cap Rates
Cap Rate 5%
$4,069,820
Cap Rate 7%
$2,907,014
Cap Rate 9%
$2,261,011
Alternative Uses
Best Use
Office B
$2.91M
$2.54M – $3.39M
NOI $203,491 @ 7.0% cap · market cap 8.66%
Second Best
—
—
no second resolved use
Theoretical Best
Office A
$4.41M
$3.86M – $5.15M
NOI $309,019 @ 7.0% cap · market cap 13.15%
Zoning and permitted uses should be independently verified with authorities.
Property Analytics
Unlock full access to Insights
Subscribe to Realmo Intelligence
Open Analytics
Current Use
Location Intelligence
Trade Area within ½ mile
4,739
Businesses Nearby
Explore this area
Business Placement
Demographics for 97239, OR
18,323
Population
9,963
Households
1.8
Avg Household Size
39
Median Age
74%
College-Educated
99%
High-School Grad
3.6 sq mi
ZIP Area
5,090
Density / Sq Mi
$108,795
Median Household Income
$67,384
Median Earnings
$1,749
Median Rent
$713,100
Median Home Value
Check the figures for this property
Cap Rate, Value Estimation, Potential NOI and more
View Realmo Analytics
Market
Vacancy Rate% for Office in Portland, OR

Questions? Ask Rey
Realmo’s AI knows this listing — price, zoning, demand, history. Ask anything.



Frequently Asked Questions
What type of property is this?
Office building - Office building with river and mountain views near downtown.
Where is this office building located?
The property is located at 4504 S Corbett Ave Portland, OR.
What is the asking price?
The asking price for this property is $2,350,000.
What are key features of this property?
This property features: Excellent views of the Willamette River and Mount Hood.; Recent capital improvements: new roof and HVAC systems.; Modern design with large windows and excellent natural lighting.


