Former Restaurant in Sterling
For Sale
Contact for pricing
33875 Van Dyke Ave, Sterling Heights, MI 48312
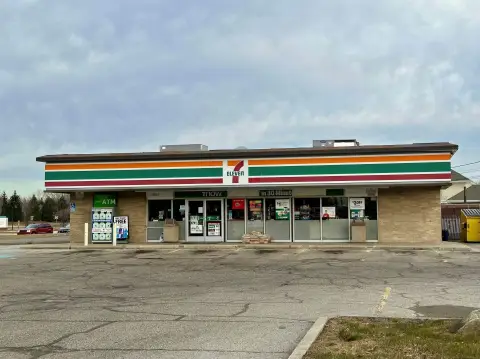
Former restaurant located in Sterling Ponds Shopping Center.
Property Size4,997 SF
Price / SF$190.11
Days on Market2517
Property Features for 33875 Van Dyke Ave
General Information
Standard status
Active
Size
4,997 SF
Total Parking Spaces
60
Property subtype
Retail
Zoning
Retail
Building Details
Year Built
2000
Stories
1
Listing Agency:
Transwestern Detroit
Listed By:
Charles Howard · License #MI 6506044836
(248) 440-1447
Source:
Crexi
Added: Dec 5, 2019
Changed: Oct 13
Last Checked: Oct 24 at 3:50PM
Displayed information is deemed reliable but is not guaranteed and should be independently verified. All listing content including descriptions, pricing, images are the copyrighted material of Transwestern Detroit

Ask AI about this property
Review the available facts, identify missing information and prepare questions for the agent.
Investment Insights
Based on property information with market context.
Located on the west side of Van Dyke Avenue, north of 14 Mile Road, this 4,997-square-foot former restaurant is situated in the Sterling Ponds Shopping Center, anchored by Walmart. The site is surrounded by numerous commercial businesses. The building retains existing hoods and coolers. The dining area has been gutted and is ready for design. Ownership is seeking the building's next tenant.
Key Highlights
- Located in Sterling Ponds Shopping Center anchored by Walmart.
- High‑traffic location on Van Dyke Avenue, north of 14 Mile Road.
- Surrounded by many commercial businesses.
Financial Insights
Estimated NOI and Cap Rate
NOI / Yr
$64,341
Cap Rate
6.77%
Suggested Prices Based on Cap Rates
Cap Rate 5%
$1,286,820
$1.3M
Cap Rate 7%
$919,157
$919.2K
Cap Rate 9%
$714,900
$714.9K
Market Conditions
NOI Build-Up for 4,997 SF
Gross rent
$92.9K $18.60/SF
− Vacancy
−$7.2K −$1.43/SF
EGI
$85.8K $17.17/SF
− OpEx
−$21.4K −$4.29/SF
NOI
$64.3K $12.88/SF
Area
Sterling Heights, MI
Vacancy
7.70%
Lease Rate
$18.60 /SF/Yr
Expense Ratio
25.00%
Simulate Cap Rate and NOI
Suggested Prices Based on Cap Rates
Cap Rate 5%
$1,286,820
Cap Rate 7%
$919,157
Cap Rate 9%
$714,900
Alternative Uses
Best Use
Specialty Retail
$919.2K
$804.3K – $1.07M
NOI $64,341 @ 7.0% cap · market cap 6.77%
Second Best
—
—
no second resolved use
Theoretical Best
Office A
$1.10M
$964.6K – $1.29M
NOI $77,165 @ 7.0% cap · market cap 8.12%
Zoning and permitted uses should be independently verified with authorities.
How Realmo checks its estimates
Property Analytics
Who owns this building?
See the owner, sales and loan history
Open Analytics
Current Use
Location Intelligence
Trade Area within ½ mile
399
Businesses Nearby
245k
Monthly Visits Nearby
Under-served
Demand for This Use
Explore this area
Business Placement
Foot Traffic Nearby
Superstores 56%
Dining 25%
Groceries 10%
Shops & Services 7%
Walmart
Superstores
136,501 visits/mo
0.5 miles
McDonald's
Dining
25,024 visits/mo
0.5 miles
Aldi
Groceries
24,072 visits/mo
0.1 miles
Tim Hortons
Dining
11,445 visits/mo
0.5 miles
Exxon
Shops & Services
9,369 visits/mo
0.5 miles
Demographics for 48312, MI
34,854
Population
14,282
Households
2.4
Avg Household Size
42
Median Age
31%
College-Educated
87%
High-School Grad
11.1 sq mi
ZIP Area
3,140
Density / Sq Mi
$71,266
Median Household Income
$40,488
Median Earnings
$1,176
Median Rent
$253,700
Median Home Value
Check the figures for this property
Cap Rate, Value Estimation, Potential NOI and more
View Realmo Analytics
Market
Vacancy Rate% for Retail in Midwest region


Frequently Asked Questions
What type of property is this?
Restaurant - Former restaurant located in Sterling Ponds Shopping Center.
Where is this restaurant located?
The property is located at 33875 Van Dyke Ave Sterling Heights, MI.
What is the asking price?
The asking price for this property is $950,000.
What are key features of this property?
This property features: Located in Sterling Ponds Shopping Center anchored by Walmart.; High‑traffic location on Van Dyke Avenue, north of 14 Mile Road.; Surrounded by many commercial businesses.


