High-Bay Flex/Industrial
For Sale
$6,000,000
6384 Via Real, Carpinteria, CA 93013
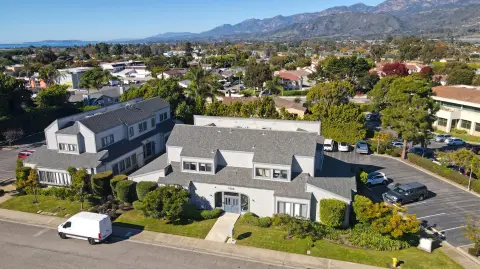
Remodeled flex/industrial building with freeway access and scenic views.
Property Size24,030 SF
Price / SF$249.69
Days on Market1491
Property Features for 6384 Via Real
General Information
Standard status
Active
Size
24,030 SF
Listing Agency:
Hayes Commercial Group
Listed By:
Francois DeJohn · License #CA01144570
(805) 898-4365
Source:
Exprealty
Added: Sep 8, 2022
Changed: Sep 10
Last Checked: Oct 6 at 12:15AM
Displayed information is deemed reliable but is not guaranteed and should be independently verified. All listing content including descriptions, pricing, images are the copyrighted material of Hayes Commercial Group
Investment Insights
Based on property information with market context.
This high-bay flex/industrial building offers a rare opportunity for either an owner-user or investor. The property features easy freeway access and scenic views overlooking the Carpinteria bluffs. The landlord recently completed an extensive remodel of the exterior and shell of the property, with approximately $1.5 million invested. Renovations include new exterior paint, landscaping, roll-up doors, hardscape, new parking, new HVAC units, and skylights. The property, totaling 24,030 square feet, features dedicated parking, heavy power, one grade-level loading door, and one truck well loading door. It also includes high ceilings and potential to construct creative office, life science, R&D, or industrial space.
Key Highlights
- Extensive recent remodel (approximately $1.5 million) including new exterior paint, landscaping, roll‑up doors, hardscape, new parking, new HVAC units, and skylights.
- Easy freeway access and scenic views overlooking the Carpinteria bluffs.
- High‑bay flex/industrial building suitable for owner‑user or investor.
Financial Insights
Estimated NOI and Cap Rate
NOI / Yr
$308,123
Cap Rate
5.14%
Suggested Prices Based on Cap Rates
Cap Rate 5%
$6,162,460
$6.2M
Cap Rate 7%
$4,401,757
$4.4M
Cap Rate 9%
$3,423,589
$3.4M
Market Conditions
NOI Build-Up for 24,030 SF
Gross rent
$490.2K $20.40/SF
− Vacancy
−$16.2K −$0.67/SF
EGI
$474.0K $19.73/SF
− OpEx
−$165.9K −$6.90/SF
NOI
$308.1K $12.82/SF
Area
Santa Barbara County, CA
Vacancy
3.30%
Lease Rate
$20.40 /SF/Yr
Expense Ratio
35.00%
Simulate Cap Rate and NOI
Suggested Prices Based on Cap Rates
Cap Rate 5%
$6,162,460
Cap Rate 7%
$4,401,757
Cap Rate 9%
$3,423,589
Alternative Uses
Best Use
Flex RnD
$4.40M
$3.85M – $5.14M
NOI $308,123 @ 7.0% cap · market cap 5.14%
Second Best
Industrial
$2.10M
$1.84M – $2.45M
NOI $147,159 @ 7.0% cap · market cap 2.45%
Theoretical Best
Multifamily LT 5
$7.54M
$6.60M – $8.80M
NOI $527,942 @ 7.0% cap · market cap 8.80%
Zoning and permitted uses should be independently verified with authorities.
Property Analytics
Unlock full access to Insights
Subscribe to Realmo Intelligence
Open Analytics
Current Use
Location Intelligence
Trade Area within ½ mile
170
Businesses Nearby
Under-served
Demand for This Use
Explore this area
Business Placement
Demographics for 93013, CA
16,299
Population
7,640
Households
2.1
Avg Household Size
45
Median Age
46%
College-Educated
87%
High-School Grad
41.4 sq mi
ZIP Area
394
Density / Sq Mi
$115,633
Median Household Income
$49,017
Median Earnings
$2,331
Median Rent
$1,074,600
Median Home Value
Check the figures for this property
Cap Rate, Value Estimation, Potential NOI and more
View Realmo Analytics
Market
Vacancy Rate% for Industrial in West region

Questions? Ask Rey
Realmo’s AI knows this listing — price, zoning, demand, history. Ask anything.




Frequently Asked Questions
What type of property is this?
Flex space - Remodeled flex/industrial building with freeway access and scenic views.
Where is this flex space located?
The property is located at 6384 Via Real Carpinteria, CA.
What is the asking price?
The asking price for this property is $6,000,000.
What are key features of this property?
This property features: Extensive recent remodel (approximately $1.5 million) including new exterior paint, landscaping, roll‑up doors, hardscape, new parking, new HVAC units, and skylights.; Easy freeway access and scenic views overlooking the Carpinteria bluffs.; High‑bay flex/industrial building suitable for owner‑user or investor.



