Four-Story Mixed-Use Corner
For Sale
$15,000,000
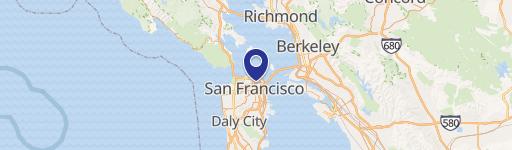
935 Kearny Street, San Francisco, CA 94133
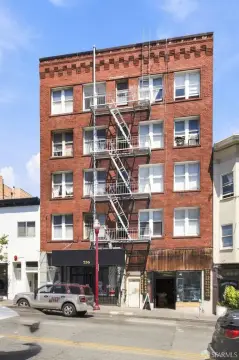
Central San Francisco property combines SRO units, tourist rooms, and commercial space in a building constructed in 1907.
Property Size36,700 SF
Days on Market82
Property Features for 935 Kearny Street
General Information
Standard status
Active
Size
36,700 SF
Property subtype
Mixed Use
Units
Unit Mix
125 x SRO
Multifamily Units
125
Additional Details
Furnished
Yes
Building Details
Building Size
36,700 SF
Year Built
1907
Buildings
1
Stories
4
Tenancy
Multi
Listing Agency:
Colliers International
Listed By:
Brad Lagomarsino · License #01058500
(415) 288-7847
Source:
Swanngroupsf
Added: Jul 27
Changed: Oct 11
Last Checked: Oct 15 at 6:44AM
Displayed information is deemed reliable but is not guaranteed and should be independently verified. All listing content including descriptions, pricing, images are the copyrighted material of Colliers International

Ask AI about this property
Review the available facts, identify missing information and prepare questions for the agent.
Investment Insights
Based on property information with market context.
Built in 1907, this 36,700-square-foot, four-story corner property brings together 125 SRO units, 20 tourist rooms, and six commercial units. The furnished residential accommodations include engineered wood flooring, natural light, mini refrigerators, microwaves, sinks, and limestone countertops. The varied configuration supports residential, hospitality, and commercial occupancy within one building.
The property fronts Columbus Avenue near the intersection of San Francisco’s Financial District, North Beach, and Chinatown. Restaurants, nightlife, shopping, and neighborhood services are within the surrounding area, while Downtown, the Embarcadero, and SOMA are accessible for commuters. Broadway, Stockton Street, and Pacific Avenue provide nearby transportation connections, and several recognized destinations—including Coit Tower, Washington Square Park, the Ferry Building, and the Exploratorium—are within walking distance.
The property fronts Columbus Avenue near the intersection of San Francisco’s Financial District, North Beach, and Chinatown. Restaurants, nightlife, shopping, and neighborhood services are within the surrounding area, while Downtown, the Embarcadero, and SOMA are accessible for commuters. Broadway, Stockton Street, and Pacific Avenue provide nearby transportation connections, and several recognized destinations—including Coit Tower, Washington Square Park, the Ferry Building, and the Exploratorium—are within walking distance.
Key Highlights
- 36,700‑square‑foot, four‑story mixed‑use building constructed in 1907
- 125 SRO units, 20 tourist rooms, and six commercial units
- Corner location along Columbus Avenue near the Financial District, North Beach, and Chinatown
Financial Insights
Estimated NOI and Cap Rate
NOI / Yr
$1,191,541
Cap Rate
7.94%
Suggested Prices Based on Cap Rates
Cap Rate 5%
$23,830,820
$23.8M
Cap Rate 7%
$17,022,014
$17.0M
Cap Rate 9%
$13,239,344
$13.2M
Market Conditions
NOI Build-Up for 36,700 SF
Gross rent
$2.31M $63.00/SF
− Vacancy
−$145.7K −$3.97/SF
EGI
$2.17M $59.03/SF
− OpEx
−$974.9K −$26.56/SF
NOI
$1.19M $32.47/SF
Area
San Francisco, CA
Vacancy
6.30%
Lease Rate
$63.00 /SF/Yr
Expense Ratio
45.00%
Simulate Cap Rate and NOI
Suggested Prices Based on Cap Rates
Cap Rate 5%
$23,830,820
Cap Rate 7%
$17,022,014
Cap Rate 9%
$13,239,344
Alternative Uses
Best Use
Retail
$167.31M
$146.40M – $195.20M
NOI $11,711,943 @ 7.0% cap · market cap 78.08%
Second Best
Apartment 5plus
$17.02M
$14.89M – $19.86M
NOI $1,191,541 @ 7.0% cap · market cap 7.94%
Theoretical Best
Specialty Retail
$179.26M
$156.86M – $209.14M
NOI $12,548,510 @ 7.0% cap · market cap 83.66%
Zoning and permitted uses should be independently verified with authorities.
How Realmo checks its estimates
Property Analytics
Unlock full access to Insights
Subscribe to Realmo Intelligence
Open Analytics
Current Use
Lease Details
125
Residential units
Multi-tenant
Tenancy
Location Intelligence
Trade Area within ½ mile
27,734
Businesses Nearby
Explore this area
Business Placement
Demographics for 94133, CA
26,751
Population
15,733
Households
1.7
Avg Household Size
41
Median Age
55%
College-Educated
80%
High-School Grad
0.7 sq mi
ZIP Area
38,216
Density / Sq Mi
$83,025
Median Household Income
$78,478
Median Earnings
$1,985
Median Rent
$1,519,100
Median Home Value
Check the figures for this property
Cap Rate, Value Estimation, Potential NOI and more
View Realmo Analytics
Market
Vacancy Rate% for Multifamily in West region





Frequently Asked Questions
What type of property is this?
Mixed-use property - Central San Francisco property combines SRO units, tourist rooms, and commercial space in a building constructed in 1907.
Where is this mixed-use property located?
The property is located at 935 Kearny Street San Francisco, CA.
What is the asking price?
The asking price for this property is $15,000,000.
What are key features of this property?
This property features: 36,700‑square‑foot, four‑story mixed‑use building constructed in 1907; 125 SRO units, 20 tourist rooms, and six commercial units; Corner location along Columbus Avenue near the Financial District, North Beach, and Chinatown


