Short-Term Rental
For Sale
$449,900
925 Iowa, Boise, ID 83706
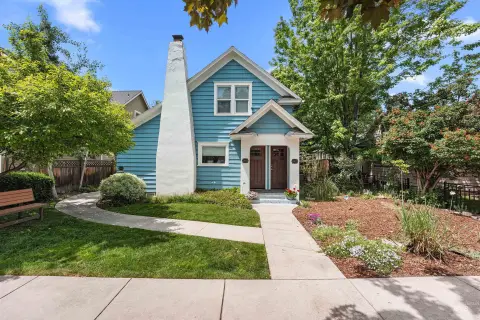
Vacant townhouse with flexible workspace, included appliances, and no HOA or CCRs.
Property Size1,552 SF
Price / SF$289.88
Days on Market141
Property Features for 925 Iowa
General Information
Standard status
Active
Size
1,552 SF
Property subtype
Multi-Family
Additional Details
Multifamily Units
1
Building Details
Year Built
2007
Listing Agency:
Homes of Idaho
Listed By:
Andrew Yates · License #SP43983
(208) 322-7653
Source:
208doors
Added: May 29
Changed: Sep 18
Last Checked: Oct 7 at 1:05PM
Displayed information is deemed reliable but is not guaranteed and should be independently verified. All listing content including descriptions, pricing, images are the copyrighted material of Homes of Idaho

Ask AI about this property
Review the available facts, identify missing information and prepare questions for the agent.
Investment Insights
Based on property information with market context.
This 1,552-square-foot townhouse offers two master suites along with a separate office or flex room, creating a practical layout for short-term rental use or live-work occupancy. The property was built in 2007, received a new roof and interior paint in 2022, and includes all appliances. It is currently vacant and available for easy showings.
The home is positioned near downtown Boise, BSU, and Micron, with central access suited to the short- and mid-term rental market. The property also has no HOA and no CCRs. A small 5,999-square-foot lot, city services, and one-car parking complete the offering.
The home is positioned near downtown Boise, BSU, and Micron, with central access suited to the short- and mid-term rental market. The property also has no HOA and no CCRs. A small 5,999-square-foot lot, city services, and one-car parking complete the offering.
Key Highlights
- 1,552‑square‑foot townhouse with two master suites
- Office or flex room supports live‑work use
- New roof and interior paint completed in 2022
Financial Insights
Estimated NOI and Cap Rate
NOI / Yr
$21,022
Cap Rate
4.67%
Suggested Prices Based on Cap Rates
Cap Rate 5%
$420,440
$420.4K
Cap Rate 7%
$300,314
$300.3K
Cap Rate 9%
$233,578
$233.6K
Market Conditions
NOI Build-Up for 1,552 SF
Gross rent
$32.6K $21.00/SF
− Vacancy
−$4.6K −$2.94/SF
EGI
$28.0K $18.06/SF
− OpEx
−$7.0K −$4.52/SF
NOI
$21.0K $13.54/SF
Area
Ada County, ID
Vacancy
14.00%
Lease Rate
$21.00 /SF/Yr
Expense Ratio
25.00%
Simulate Cap Rate and NOI
Suggested Prices Based on Cap Rates
Cap Rate 5%
$420,440
Cap Rate 7%
$300,314
Cap Rate 9%
$233,578
Alternative Uses
Best Use
Office B
$300.3K
$262.8K – $350.4K
NOI $21,022 @ 7.0% cap · market cap 4.67%
Second Best
Mixed Use
$275.4K
$241.0K – $321.3K
NOI $19,276 @ 7.0% cap · market cap 4.28%
Theoretical Best
Office A
$428.6K
$375.0K – $500.1K
NOI $30,003 @ 7.0% cap · market cap 6.67%
Zoning and permitted uses should be independently verified with authorities.
How Realmo checks its estimates
Property Analytics
Unlock full access to Insights
Subscribe to Realmo Intelligence
Open Analytics
Current Use
Lease Details
1
Residential units
Location Intelligence
Trade Area within ½ mile
615
Businesses Nearby
Explore this area
Business Placement
Demographics for 83706, ID
34,446
Population
15,992
Households
2.2
Avg Household Size
31
Median Age
57%
College-Educated
95%
High-School Grad
7.4 sq mi
ZIP Area
4,655
Density / Sq Mi
$81,101
Median Household Income
$33,331
Median Earnings
$1,378
Median Rent
$488,900
Median Home Value
Check the figures for this property
Cap Rate, Value Estimation, Potential NOI and more
View Realmo Analytics
Market
Vacancy Rate% for Office in Boise, ID






Frequently Asked Questions
What type of property is this?
Short term rental property - Vacant townhouse with flexible workspace, included appliances, and no HOA or CCRs.
Where is this short term rental property located?
The property is located at 925 Iowa Boise, ID.
What is the asking price?
The asking price for this property is $449,900.
What are key features of this property?
This property features: 1,552‑square‑foot townhouse with two master suites; Office or flex room supports live‑work use; New roof and interior paint completed in 2022


