Versatile Commercial Property in
For Sale
Contact for pricing
3516 Greensboro Ave, Tuscaloosa, AL 35401
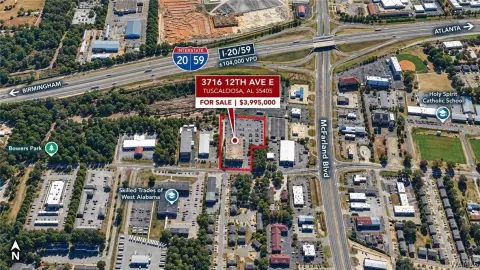
47,000+ SF improvements on 5.75 acres near I-30/59.
Property Size29,000 SF
Lot Size5.75 Acres
Price / SF$86.21
Days on Market783
Property Features for 3516 Greensboro Ave
General Information
Standard status
Active
Size
29,000 SF
Lot size
5.75 Acres
Property subtype
Industrial, Office
Zoning
ML
Building Details
Year Built
1965
Year Renovated
2020
Buildings
7
Stories
2
Units
7
Listing Agency:
Pritchett Moore Real Estate
Listed By:
Steven Deal · License #AL 000093505
(205) 349-6500
Source:
Crexi
Added: Aug 28, 2024
Changed: Oct 18
Last Checked: Oct 19 at 3:33AM
Displayed information is deemed reliable but is not guaranteed and should be independently verified. All listing content including descriptions, pricing, images are the copyrighted material of Pritchett Moore Real Estate

Ask AI about this property
Review the available facts, identify missing information and prepare questions for the agent.
Investment Insights
Based on property information with market context.
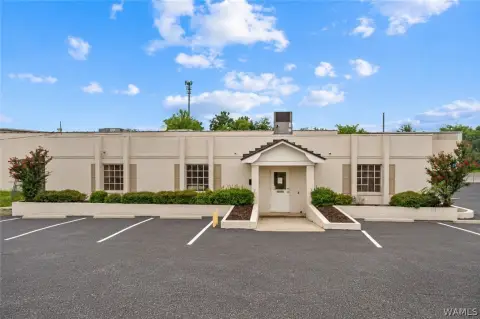
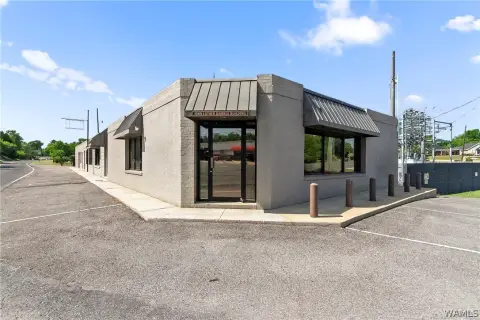
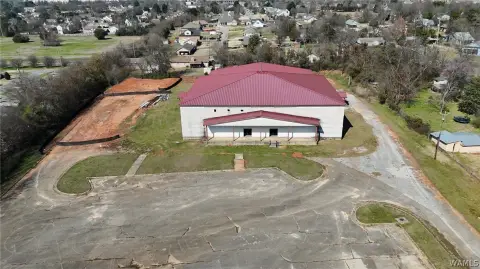
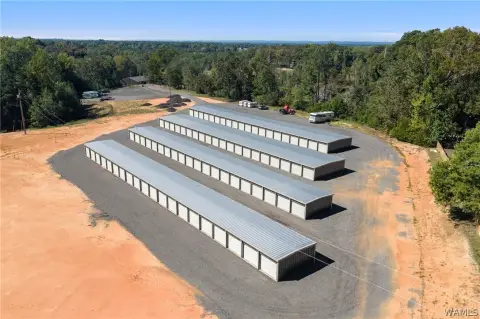
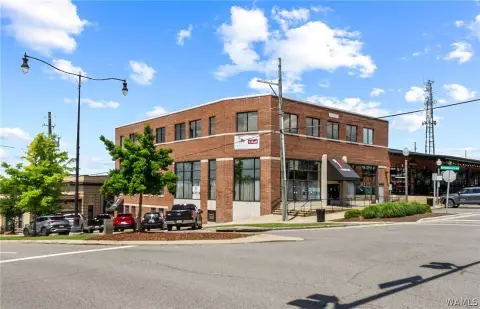
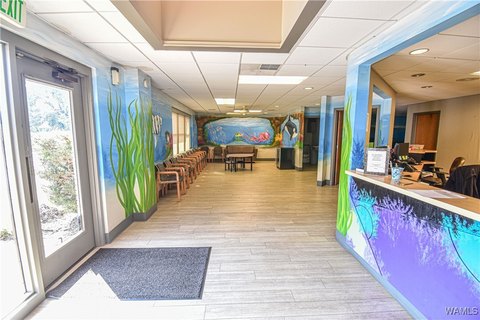
This commercial property features over 47,000 square feet of improvements on 5.75 acres, with convenient access to I-30/59. The property, formerly the site of TTL, includes four office buildings and three storage buildings. The primary structure is a 20,000-square-foot, two-story office building constructed in 2000 and continuously renovated. It can accommodate over 70 employees in a combination of open workspace and private offices, complemented by modern conference rooms, breakrooms, and bathrooms. An original 6,500-square-foot building fronts Greensboro Avenue, and an additional 4,400-square-foot office building is located at the rear of the property with its own access to 11th Avenue. Multiple storage buildings throughout the property provide a total of 17,000 square feet of shop space. The property can be divided.
Key Highlights
- 47,000+ SF of improvements on 5.75 acres.
- Prime location with close proximity to I‑30/59.
- Includes a 20,000 SF two‑story office building renovated to accommodate 70+ employees.
Financial Insights
Estimated NOI and Cap Rate
NOI / Yr
$224,447
Cap Rate
8.98%
Suggested Prices Based on Cap Rates
Cap Rate 5%
$4,488,940
$4.5M
Cap Rate 7%
$3,206,386
$3.2M
Cap Rate 9%
$2,493,856
$2.5M
Market Conditions
NOI Build-Up for 29,000 SF
Gross rent
$365.4K $12.60/SF
− Vacancy
−$20.1K −$0.69/SF
EGI
$345.3K $11.91/SF
− OpEx
−$120.9K −$4.17/SF
NOI
$224.4K $7.74/SF
Area
Tuscaloosa, AL
Vacancy
5.50%
Lease Rate
$12.60 /SF/Yr
Expense Ratio
35.00%
Simulate Cap Rate and NOI
Suggested Prices Based on Cap Rates
Cap Rate 5%
$4,488,940
Cap Rate 7%
$3,206,386
Cap Rate 9%
$2,493,856
Alternative Uses
Best Use
Flex RnD
$3.21M
$2.81M – $3.74M
NOI $224,447 @ 7.0% cap · market cap 8.98%
Second Best
Industrial
$1.99M
$1.74M – $2.33M
NOI $139,583 @ 7.0% cap · market cap 5.58%
Theoretical Best
Office A
$6.97M
$6.10M – $8.13M
NOI $487,826 @ 7.0% cap · market cap 19.51%
Zoning and permitted uses should be independently verified with authorities.
How Realmo checks its estimates
Property Analytics
Unlock full access to Insights
Subscribe to Realmo Intelligence
Open Analytics
Current Use
Location Intelligence
Trade Area within ½ mile
307
Businesses Nearby
Under-served
Demand for This Use
Explore this area
Business Placement
Demographics for 35401, AL
41,852
Population
19,517
Households
2.1
Avg Household Size
26
Median Age
27%
College-Educated
85%
High-School Grad
40.1 sq mi
ZIP Area
1,044
Density / Sq Mi
$30,031
Median Household Income
$13,041
Median Earnings
$911
Median Rent
$141,100
Median Home Value
Check the figures for this property
Cap Rate, Value Estimation, Potential NOI and more
View Realmo Analytics
Market
Vacancy Rate% for Industrial in South region




Similar Off Market Nearby
- Casual Class Bar Services — 3108 25th Ave Suite B, Tuscaloosa, AL 35401
Frequently Asked Questions
What type of property is this?
Flex space - 47,000+ SF improvements on 5.75 acres near I-30/59.
Where is this flex space located?
The property is located at 3516 Greensboro Ave Tuscaloosa, AL.
What is the asking price?
The asking price for this property is $2,500,000.
What are key features of this property?
This property features: 47,000+ SF of improvements on 5.75 acres.; Prime location with close proximity to I‑30/59.; Includes a **20,000 SF two‑story office building renovated to accommodate 70+ employees.**


