Freestanding Office
For Sale
$790,000
908 East North Street, Greenville, SC 29601
Flexible interior arrangement with a dedicated conference room and on-site parking supports office operations.
Property Size2,485 SF
Days on Market48
Property Features for 908 East North Street
General Information
Standard status
Active
Size
2,485 SF
Class
B
Total Parking Spaces
7
Property subtype
Multi Tenant Office
Site & Location
Highway Access
Yes
Road Access
Yes
Building Details
Building Size
2,485 SF
Listing Agency:
KW Commercial
Listed By:
Brent Edgerton
(864) 422-9510
Source:
Thebrokerlist
Added: Aug 20
Changed: Sep 7
Last Checked: Oct 5 at 3:09PM
Displayed information is deemed reliable but is not guaranteed and should be independently verified. All listing content including descriptions, pricing, images are the copyrighted material of KW Commercial
Investment Insights
Based on property information with market context.
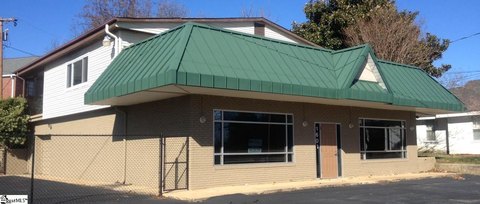
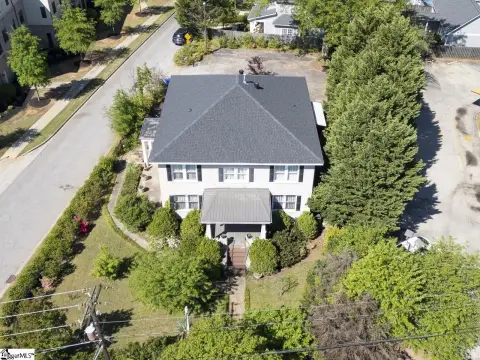
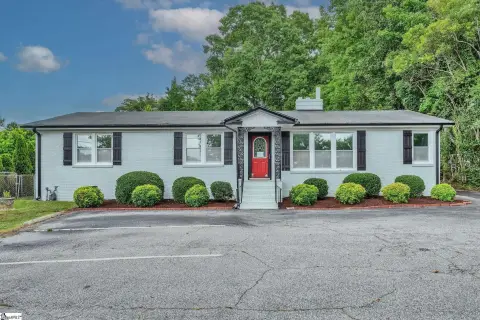
This freestanding Class B office property features an open interior layout with a private conference room. The configuration provides a practical setting for office occupancy and is positioned within Greenville’s historic district.
The property fronts East North Street in a busy commercial corridor, with Bon Secours Arena directly across the street. Access to I-385, Downtown Greenville, and the interstate network is convenient. Seven on-site parking spaces are included, adding dedicated parking for occupants and visitors.
The property fronts East North Street in a busy commercial corridor, with Bon Secours Arena directly across the street. Access to I-385, Downtown Greenville, and the interstate network is convenient. Seven on-site parking spaces are included, adding dedicated parking for occupants and visitors.
Key Highlights
- Freestanding Class B office property in Greenville’s historic district
- Open floor plan with a private conference room
- Seven on‑site parking spaces
Financial Insights
Estimated NOI and Cap Rate
NOI / Yr
$38,217
Cap Rate
4.84%
Suggested Prices Based on Cap Rates
Cap Rate 5%
$764,340
$764.3K
Cap Rate 7%
$545,957
$546.0K
Cap Rate 9%
$424,633
$424.6K
Market Conditions
NOI Build-Up for 2,485 SF
Gross rent
$57.3K $23.04/SF
− Vacancy
−$6.3K −$2.53/SF
EGI
$51.0K $20.51/SF
− OpEx
−$12.7K −$5.13/SF
NOI
$38.2K $15.38/SF
Area
Greenville County, SC
Vacancy
11.00%
Lease Rate
$23.04 /SF/Yr
Expense Ratio
25.00%
Simulate Cap Rate and NOI
Suggested Prices Based on Cap Rates
Cap Rate 5%
$764,340
Cap Rate 7%
$545,957
Cap Rate 9%
$424,633
Alternative Uses
Best Use
Office B
$546.0K
$477.7K – $637.0K
NOI $38,217 @ 7.0% cap · market cap 4.84%
Second Best
—
—
no second resolved use
Theoretical Best
Office A
$1.06M
$929.0K – $1.24M
NOI $74,322 @ 7.0% cap · market cap 9.41%
Zoning and permitted uses should be independently verified with authorities.
Property Analytics
Current Use
Lease Details
Yes
Highway access
Yes
Paved road access
Location Intelligence
Trade Area within ½ mile
3,461
Businesses Nearby
Explore this area
Business Placement
Demographics for 29601, SC
13,261
Population
8,067
Households
1.6
Avg Household Size
38
Median Age
52%
College-Educated
89%
High-School Grad
4.2 sq mi
ZIP Area
3,157
Density / Sq Mi
$73,321
Median Household Income
$55,727
Median Earnings
$1,406
Median Rent
$583,200
Median Home Value
Market
Vacancy Rate% for Office in Greenville, SC

Questions? Ask Rey
Realmo’s AI knows this listing — price, zoning, demand, history. Ask anything.




Frequently Asked Questions
What type of property is this?
Office building - Flexible interior arrangement with a dedicated conference room and on-site parking supports office operations.
Where is this office building located?
The property is located at 908 East North Street Greenville, SC.
What is the asking price?
The asking price for this property is $790,000.
What are key features of this property?
This property features: Freestanding Class B office property in Greenville’s historic district; Open floor plan with a private conference room; Seven on‑site parking spaces



