Value-Add Quadplex on Corner
For Sale
$1,549,900
9019 S San Pedro, Los Angeles, CA 90003
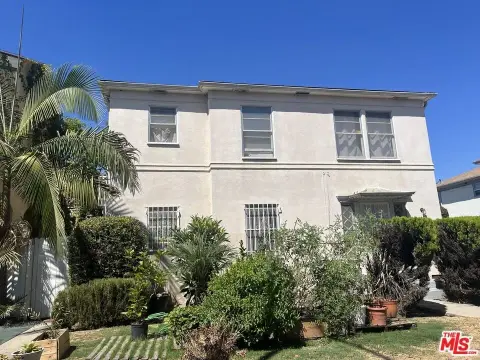
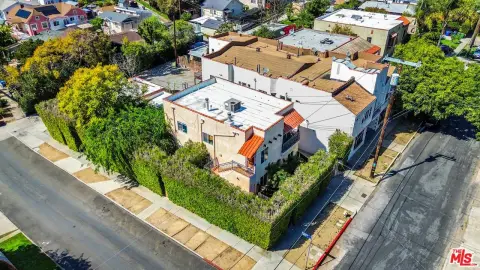
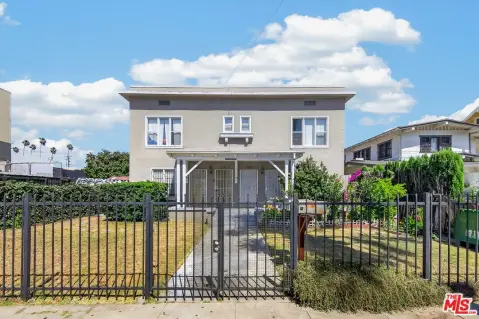
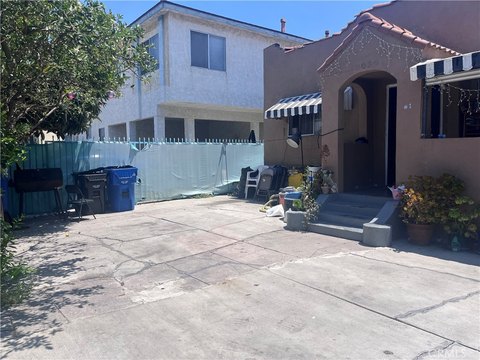
Four-unit residential property on a corner lot with access from San Pedro Street and an adjacent alley, subject to LA RSO.
Property Size3,750 SF
Lot Size0.14 Acres
Days on Market105
Property Features for 9019 S San Pedro
General Information
Standard status
Active
Size
3,750 SF
Lot size
0.14 Acres
Property subtype
Quadruplex
Additional Details
Road Access
Yes
Multifamily Units
4
Building Details
Building Size
3,750 SF
Year Built
1921
Listing Agency:
REALTY ONE GROUP HOMELINK
Listed By:
Alexia Hassan · License #01216375
(951) 426-2116
Source:
Truthrealty
Added: Jul 9
Changed: Oct 12
Last Checked: Oct 19 at 4:25PM
Displayed information is deemed reliable but is not guaranteed and should be independently verified. All listing content including descriptions, pricing, images are the copyrighted material of REALTY ONE GROUP HOMELINK

Ask AI about this property
Review the available facts, identify missing information and prepare questions for the agent.
Investment Insights
Based on property information with market context.
This quadplex is offered for value-add redevelopment and includes a four-unit residential building on a corner lot. The property’s current residential use is subject to the Los Angeles Rent Stabilization Ordinance (RSO).
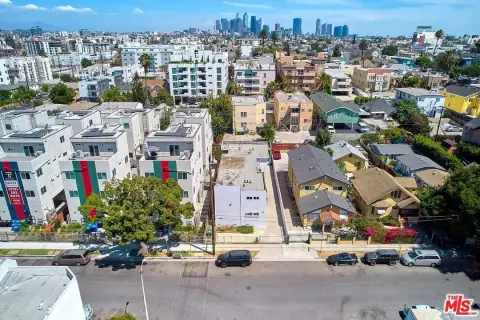
The site has access from both San Pedro Street and the adjacent alley, creating flexibility to consider future site access, parking design, and building layout. The property is located less than two blocks from the transit corridor along Manchester Avenue.
Developers may wish to review potential redevelopment pathways that could include California’s AB 1287 Stacked Density Bonus Law and City of Los Angeles TOC Tier 1 program concepts, which the remarks describe as potentially allowing up to 8 units in a four-story building and potential parking reductions under AB 2097, subject to City approval and applicable regulations.
The site has access from both San Pedro Street and the adjacent alley, creating flexibility to consider future site access, parking design, and building layout. The property is located less than two blocks from the transit corridor along Manchester Avenue.
Developers may wish to review potential redevelopment pathways that could include California’s AB 1287 Stacked Density Bonus Law and City of Los Angeles TOC Tier 1 program concepts, which the remarks describe as potentially allowing up to 8 units in a four-story building and potential parking reductions under AB 2097, subject to City approval and applicable regulations.
Key Highlights
- 4‑unit residential building on a corner lot at 9019 S San Pedro St, built in 1921
- 6,000 SF corner lot with access from both San Pedro Street and the adjacent alley
- Property is currently subject to the Los Angeles Rent Stabilization Ordinance (RSO)
Financial Insights
Estimated NOI and Cap Rate
NOI / Yr
$84,893
Cap Rate
5.48%
Suggested Prices Based on Cap Rates
Cap Rate 5%
$1,697,860
$1.7M
Cap Rate 7%
$1,212,757
$1.2M
Cap Rate 9%
$943,256
$943.3K
Market Conditions
NOI Build-Up for 3,750 SF
Gross rent
$123.8K $33.00/SF
− Vacancy
−$2.5K −$0.66/SF
EGI
$121.3K $32.34/SF
− OpEx
−$36.4K −$9.70/SF
NOI
$84.9K $22.64/SF
Area
ZIP 90003
Vacancy
2.00%
Lease Rate
$33.00 /SF/Yr
Expense Ratio
30.00%
Simulate Cap Rate and NOI
Suggested Prices Based on Cap Rates
Cap Rate 5%
$1,697,860
Cap Rate 7%
$1,212,757
Cap Rate 9%
$943,256
Alternative Uses
Best Use
Apartment 5plus
$66.30M
$58.01M – $77.35M
NOI $4,640,828 @ 7.0% cap · market cap 299.43%
Second Best
Multifamily LT 5
$1.21M
$1.06M – $1.41M
NOI $84,893 @ 7.0% cap · market cap 5.48%
Theoretical Best
—
—
same as Best Use
Zoning and permitted uses should be independently verified with authorities.
How Realmo checks its estimates
Property Analytics
Unlock full access to Insights
Subscribe to Realmo Intelligence
Open Analytics
Lease Details
4
Residential units
Yes
Paved road access
Location Intelligence
Trade Area within ½ mile
1,146
Businesses Nearby
Explore this area
Business Placement
Demographics for 90003, CA
72,764
Population
18,349
Households
4
Avg Household Size
30
Median Age
7%
College-Educated
53%
High-School Grad
3.6 sq mi
ZIP Area
20,212
Density / Sq Mi
$54,781
Median Household Income
$30,132
Median Earnings
$1,515
Median Rent
$547,600
Median Home Value
Check the figures for this property
Cap Rate, Value Estimation, Potential NOI and more
View Realmo Analytics
Market
Vacancy Rate% for Multifamily in West region





Frequently Asked Questions
What type of property is this?
Quadplex - Four-unit residential property on a corner lot with access from San Pedro Street and an adjacent alley, subject to LA RSO.
Where is this quadplex located?
The property is located at 9019 S San Pedro Los Angeles, CA.
What is the asking price?
The asking price for this property is $1,549,900.
What are key features of this property?
This property features: 4‑unit residential building on a corner lot at 9019 S San Pedro St, built in 1921; 6,000 SF corner lot with access from both San Pedro Street and the adjacent alley; Property is currently subject to the Los Angeles Rent Stabilization Ordinance (RSO)


