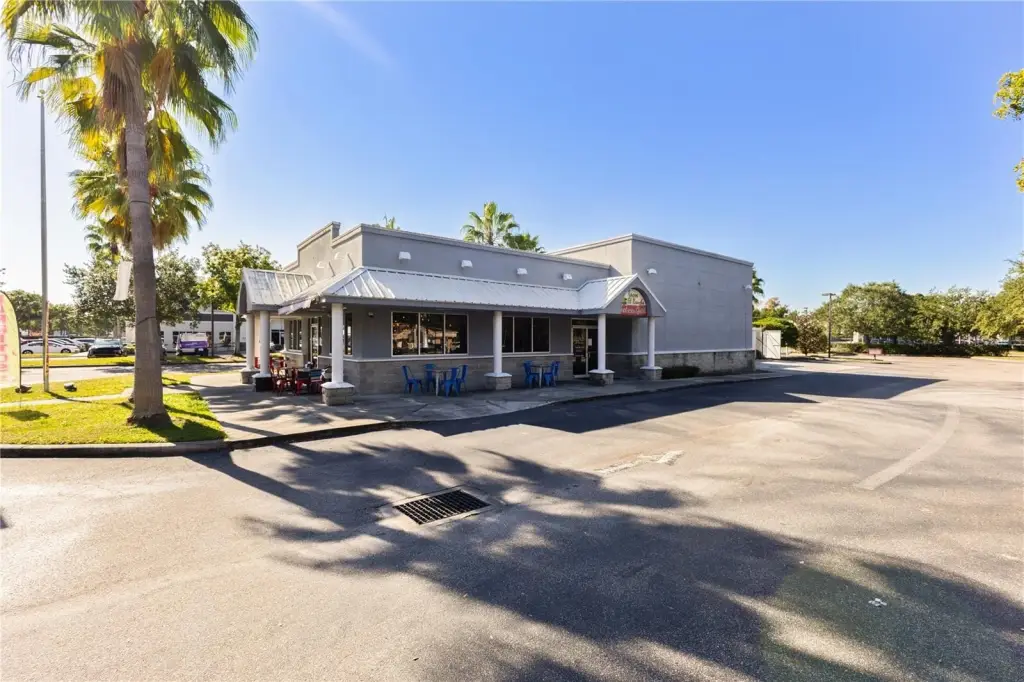
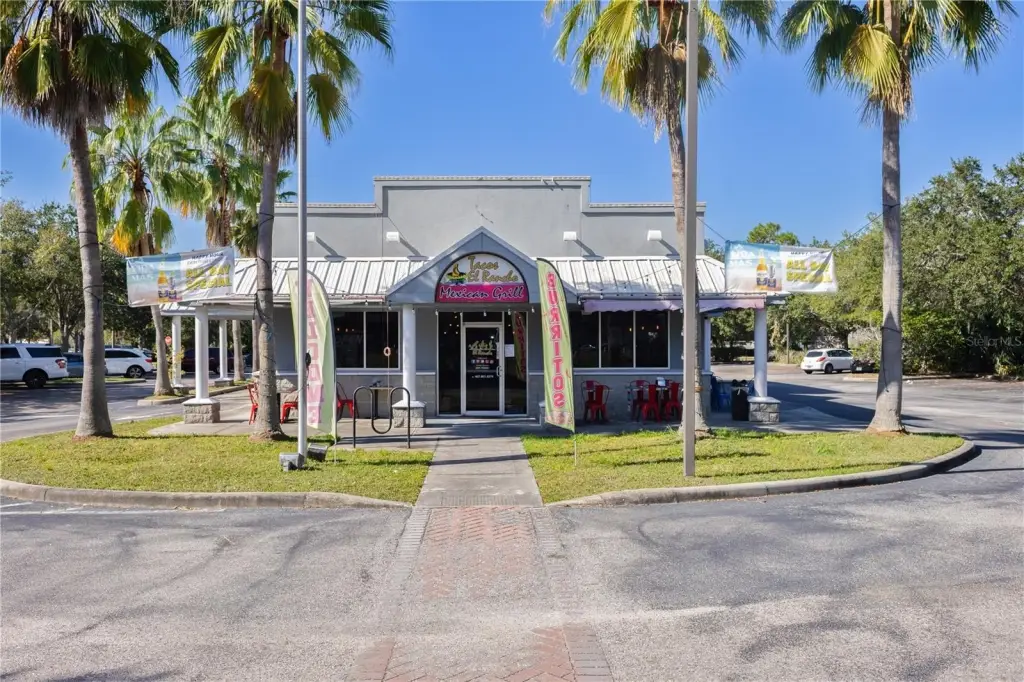
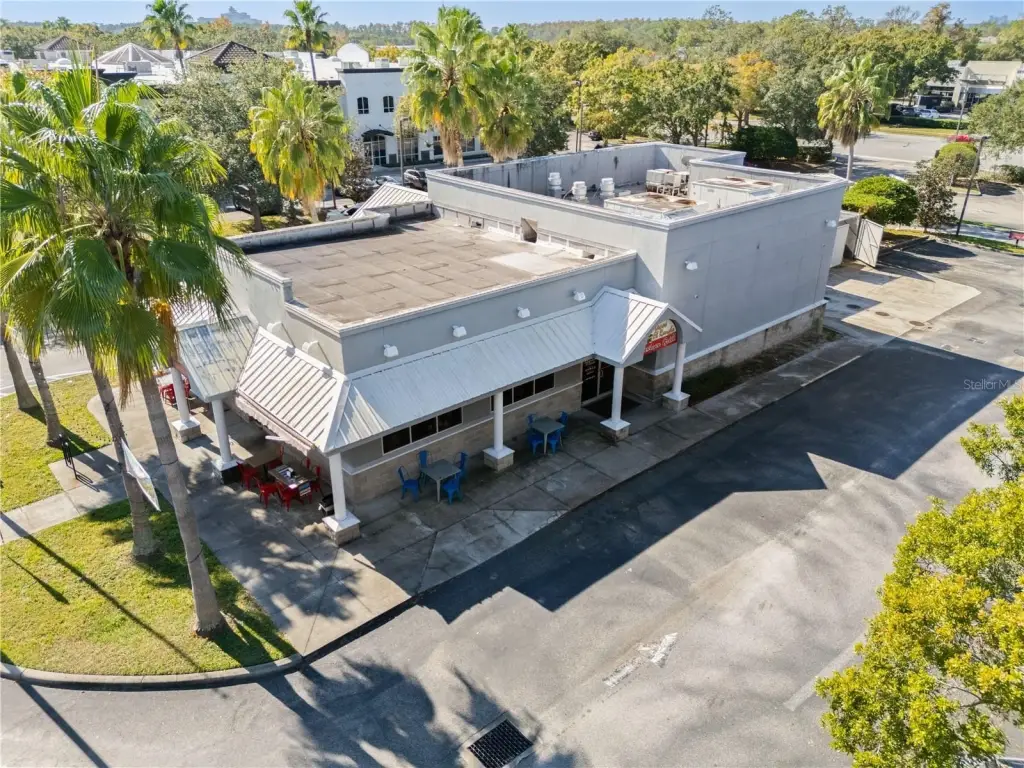
Freestanding Drive-Through
For Sale
$2,750,000
8841 COMMODITY Circle, Orlando, FL 32819
Commercial Sale, ORLANDO, FL
Property Size4,055 SF
Lot Size1.37 Acres
Price / SF$678.18
Days on Market149
Property Features for 8841 COMMODITY Circle
General Information
Property type
Commercial Sale
Property subtype
Other
Zoning
IND-2/IND-
Subdivision
SOUTH PARK
Directions
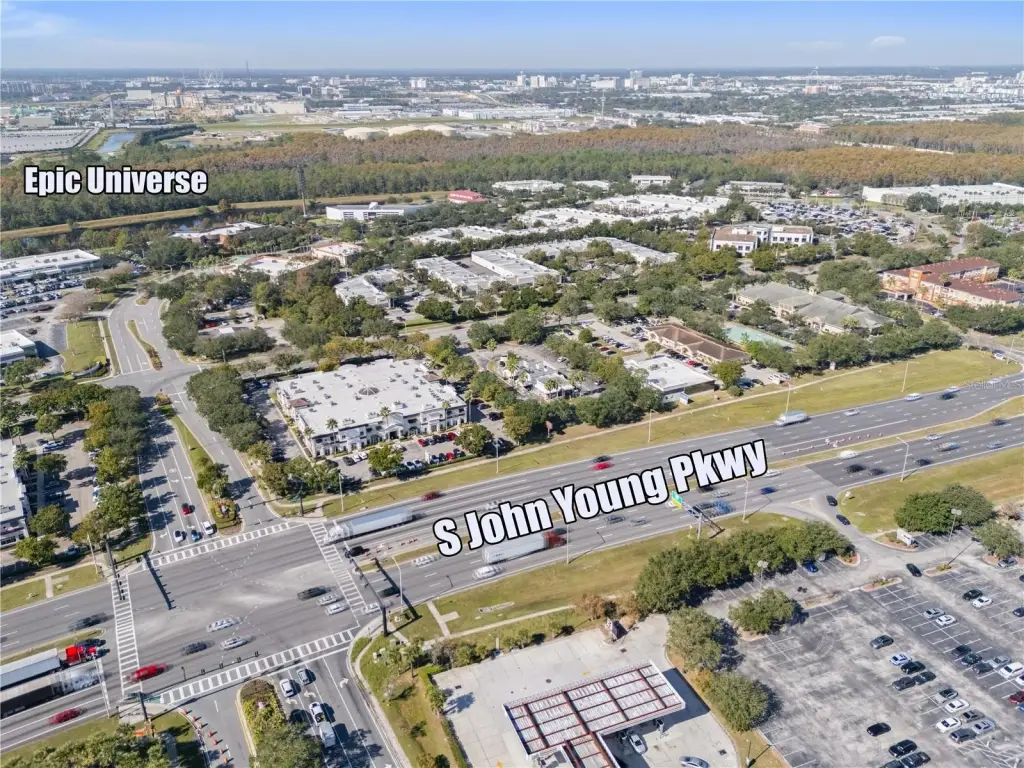
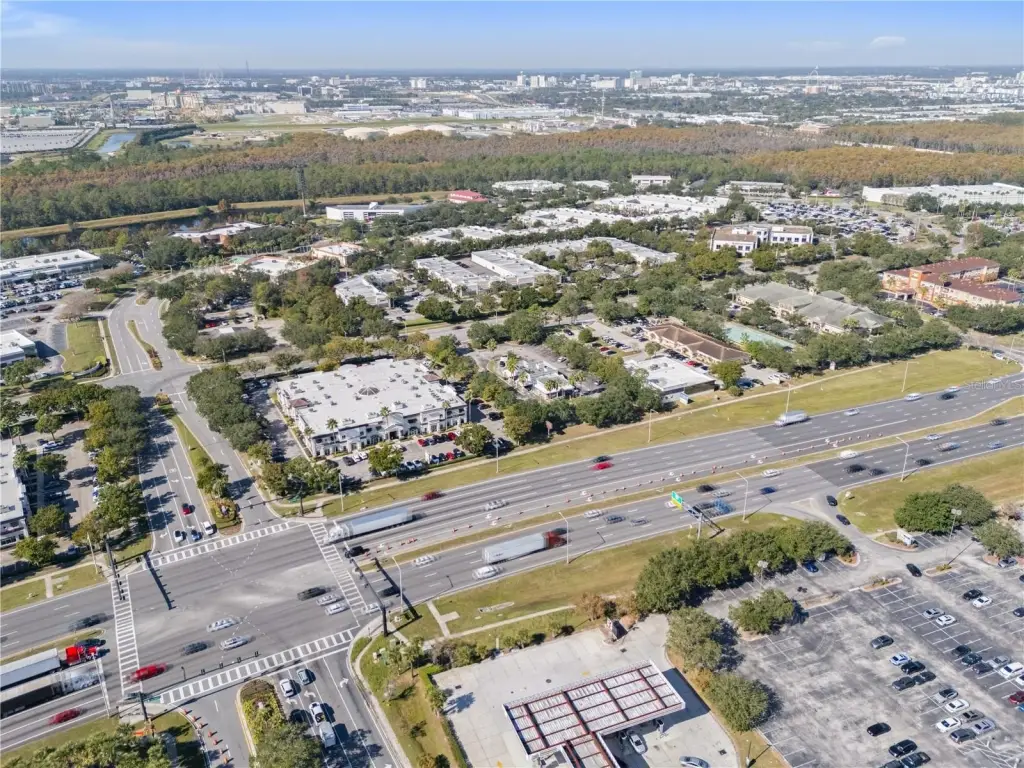
From Interstate 4 (I-4) exit to go East on Sand Lake Road then Turn Right going South on John Young Parkway then Turn Right on Commodity Circle and the Property will be on the Right Side.
Standard status
Active
APN
32-23-29-8207-01-100
Size
4,055 SF
Lot size
1.37 Acres
Taxes and HOA fees
Tax Year
2025
Tax Description
SOUTHPARK UNIT FOUR 20/137 PT OF BLK A DESC AS BEG INT OF S LINE OF NE1/4 OF SEC32-23-29 & WLY BOUNDARY BLK A TH RUN N06-09-59W 20.70 FT N83-50-04E 350 FT S06-09-59E 170 FT S83-50-04W 350 FT N06-09-59W 149.30 FT TO POB
Tax Annual Amount
25754
Legal Description
SOUTHPARK UNIT FOUR 20/137 PT OF BLK A DESC AS BEG INT OF S LINE OF NE1/4 OF SEC32-23-29 & WLY BOUNDARY BLK A TH RUN N06-09-59W 20.70 FT N83-50-04E 350 FT S06-09-59E 170 FT S83-50-04W 350 FT N06-09-59W 149.30 FT TO POB
Utilities
Cooling system
Central Air
Building Details
Year built
2005
Floors in Building
1
Building materials
Block
Listing Agency:
COMMERCIAL REAL ESTATE PROF IN
Listed By:
Mark Allen
(407) 737-9797
Added: May 14
Changed: Sep 29
Last Checked: Oct 9 at 9:06PM
MLS# O6407897
Copyright © 2026 Stellar MLS. All rights reserved. All information provided by the listing agent/broker is deemed reliable but is not guaranteed and should be independently verified.
Investment Insights
Based on property information with market context.
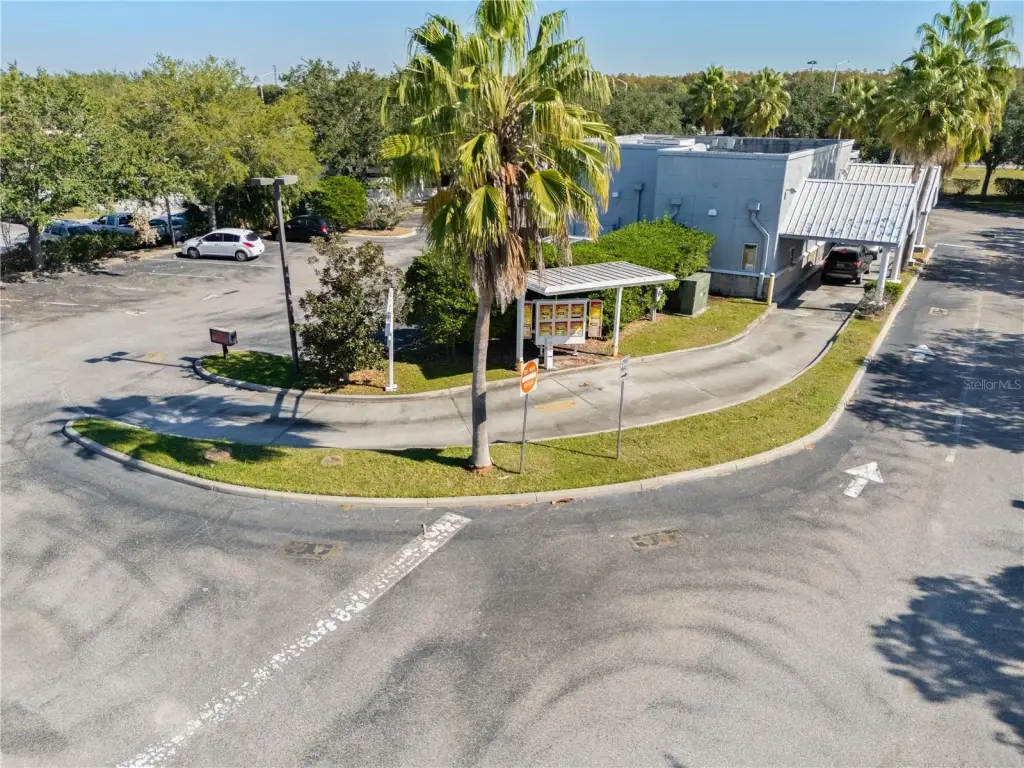
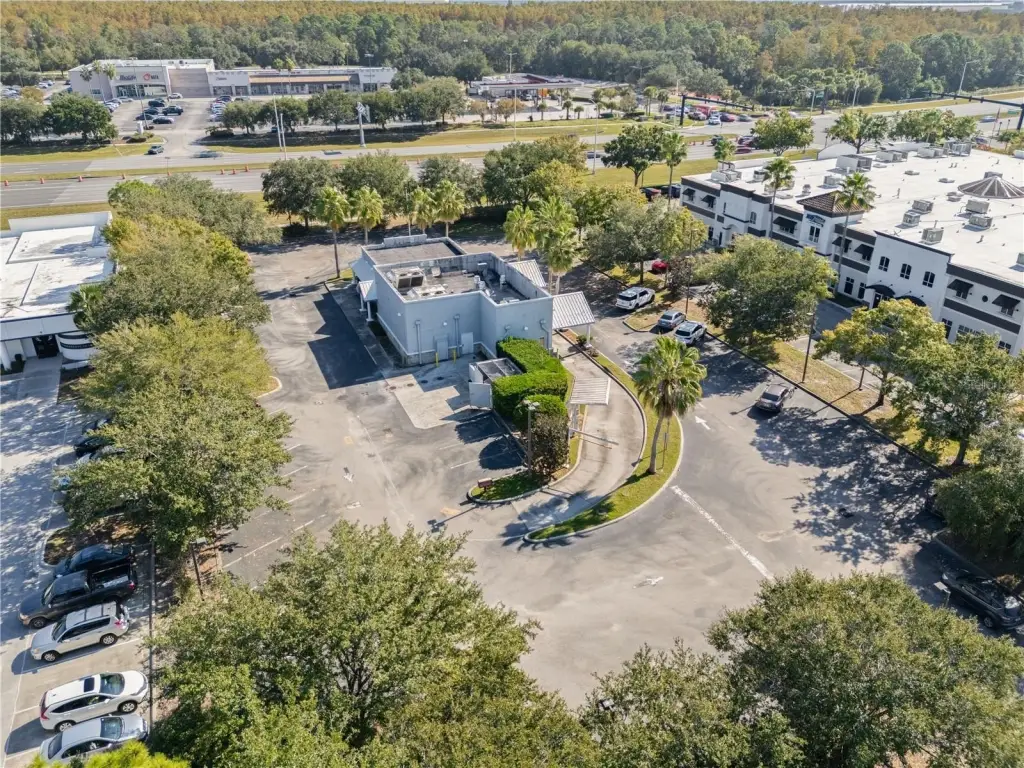
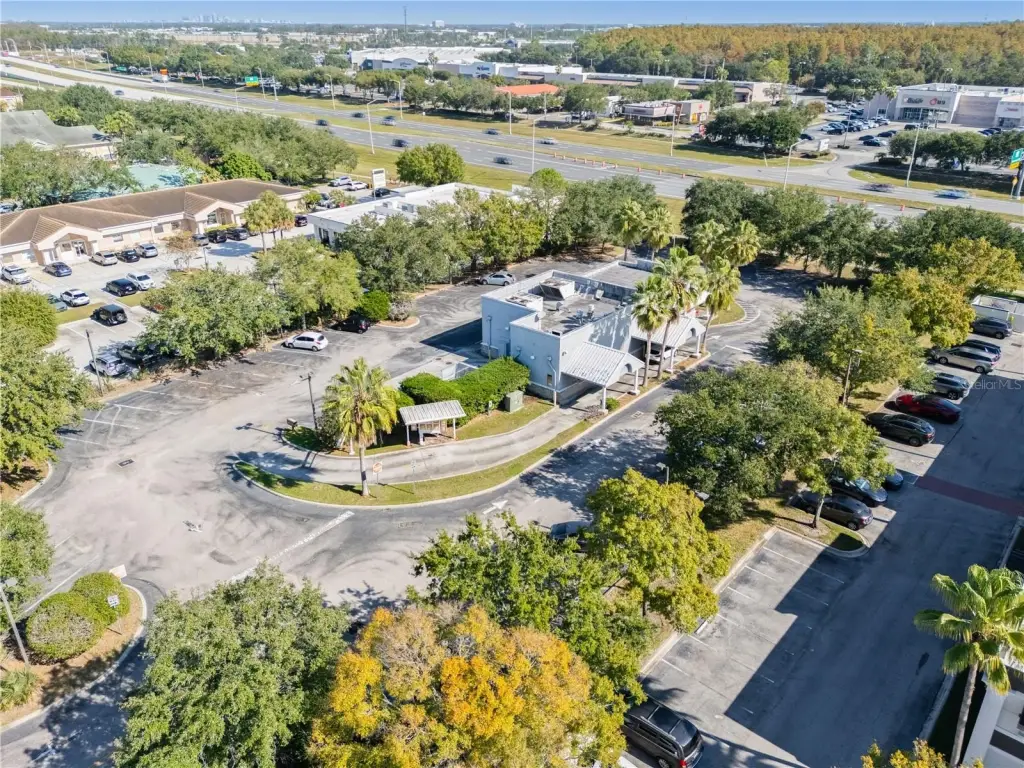
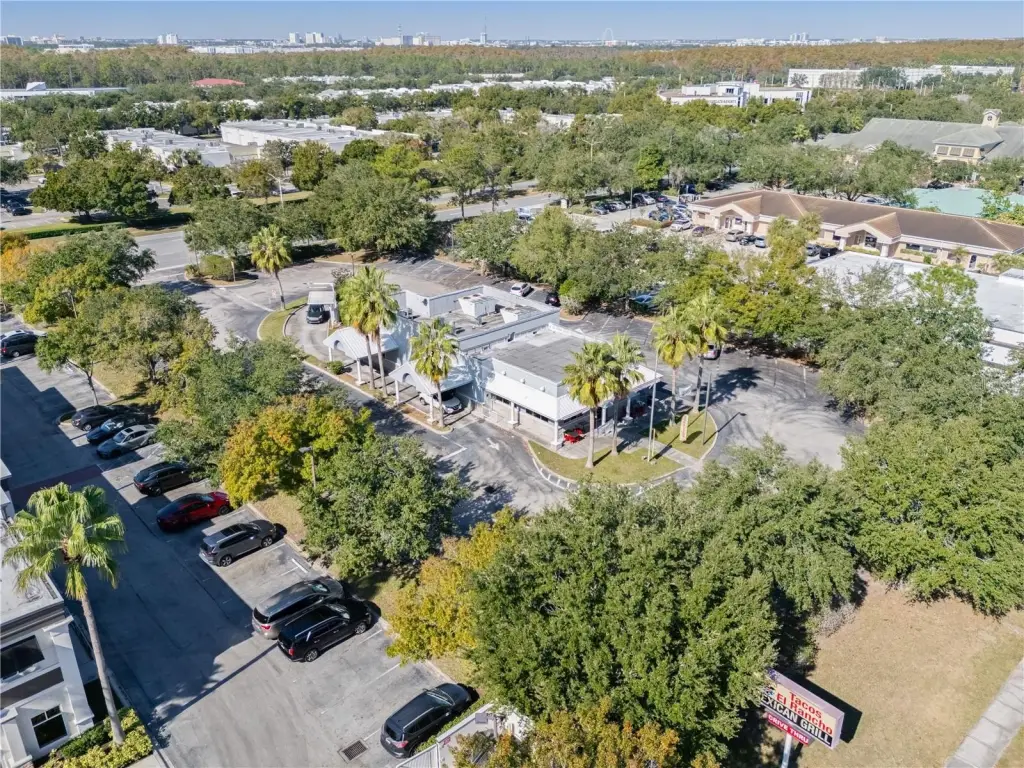
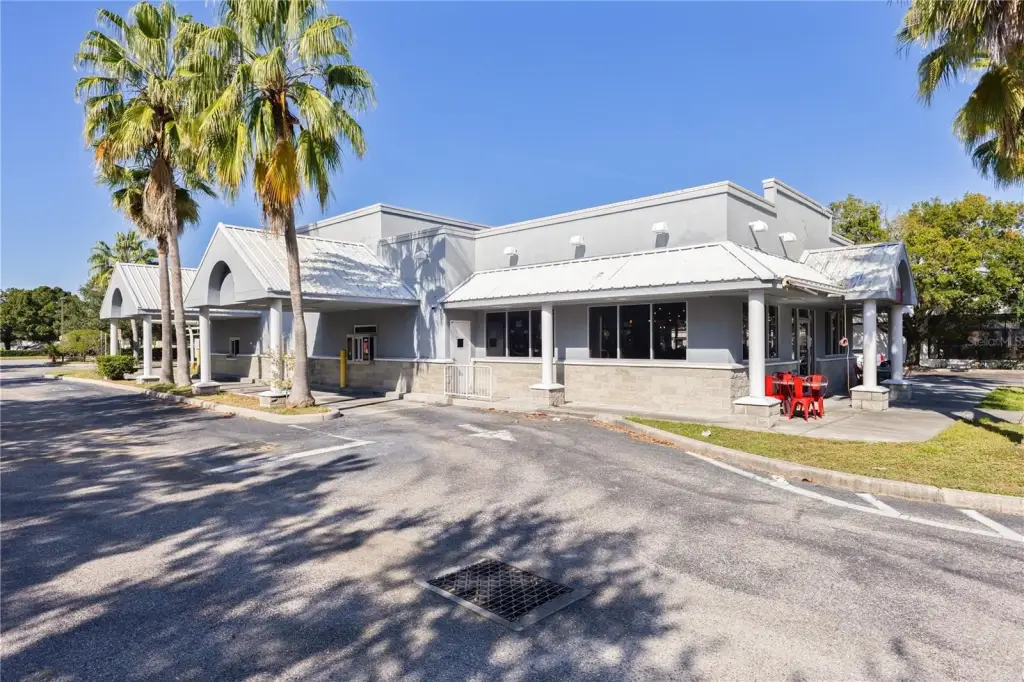
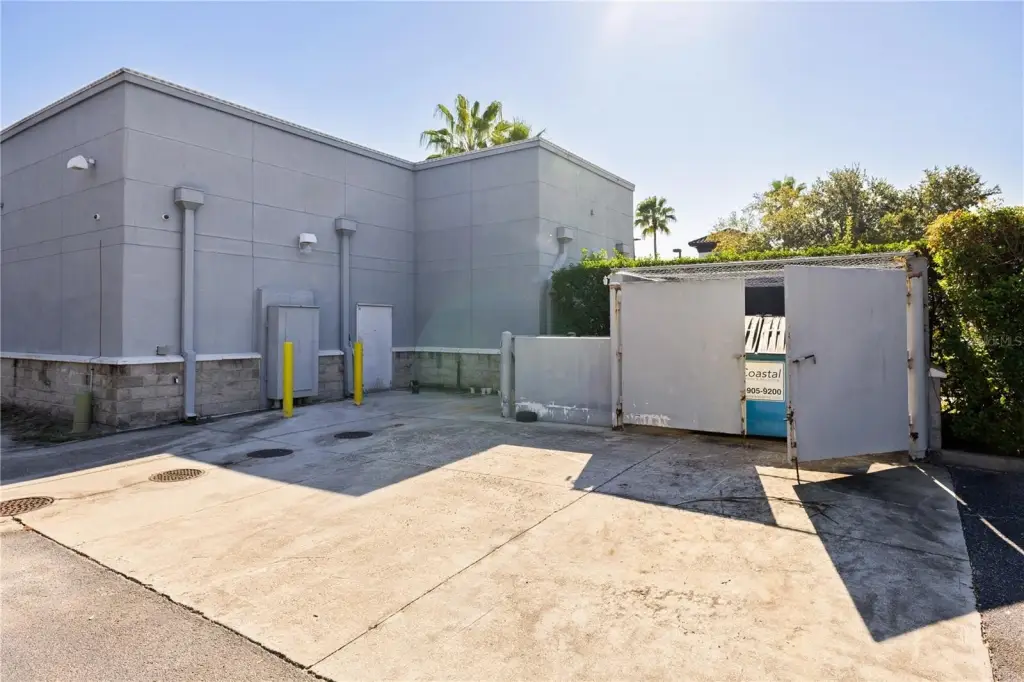
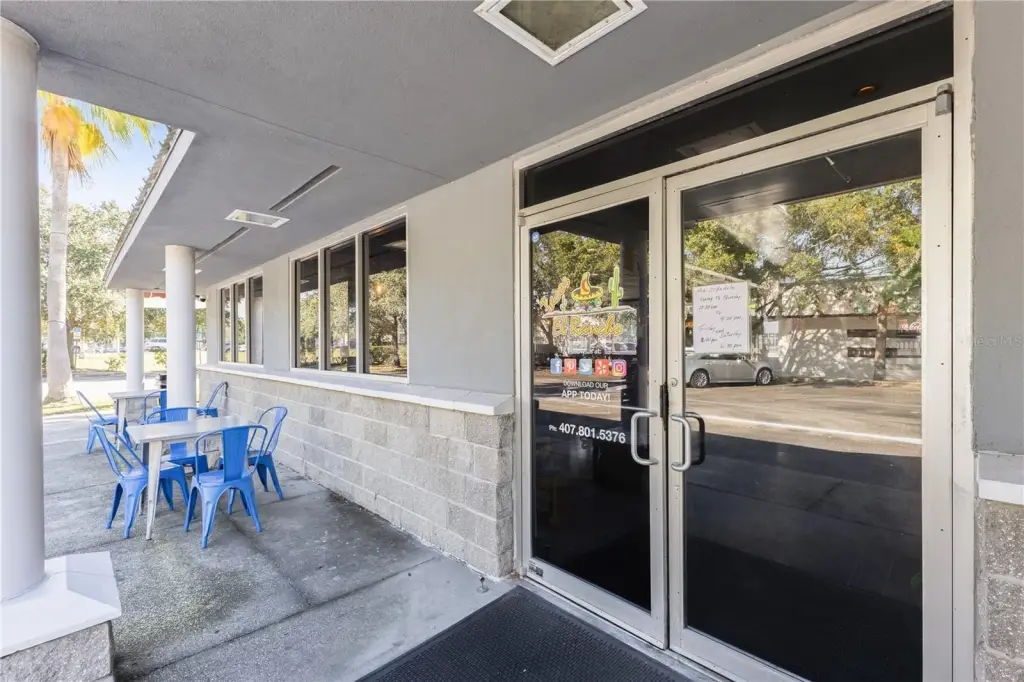
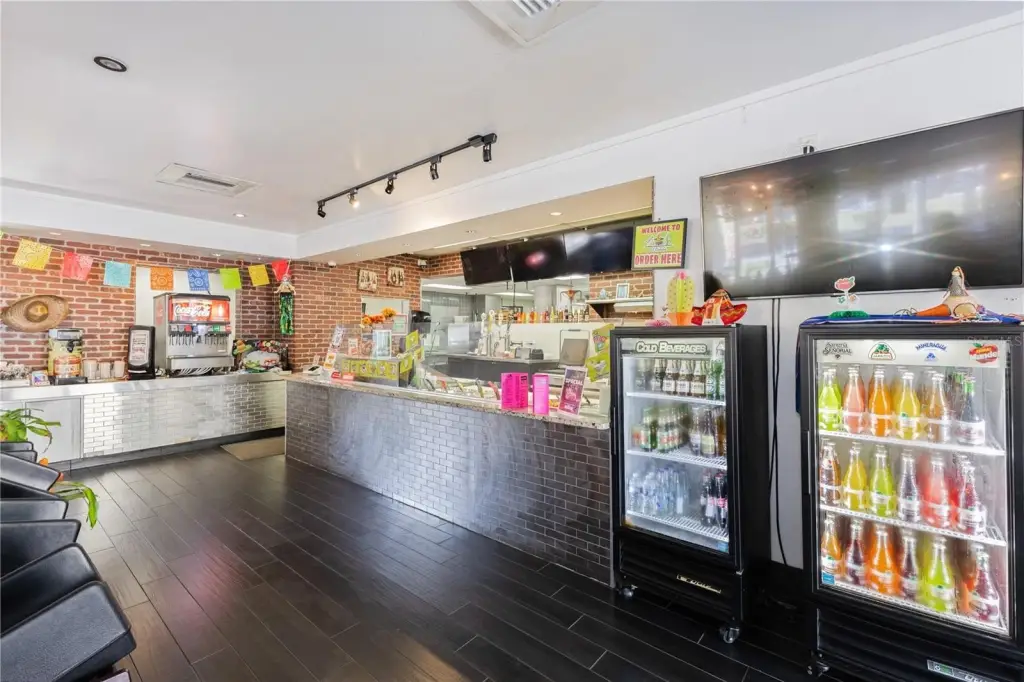
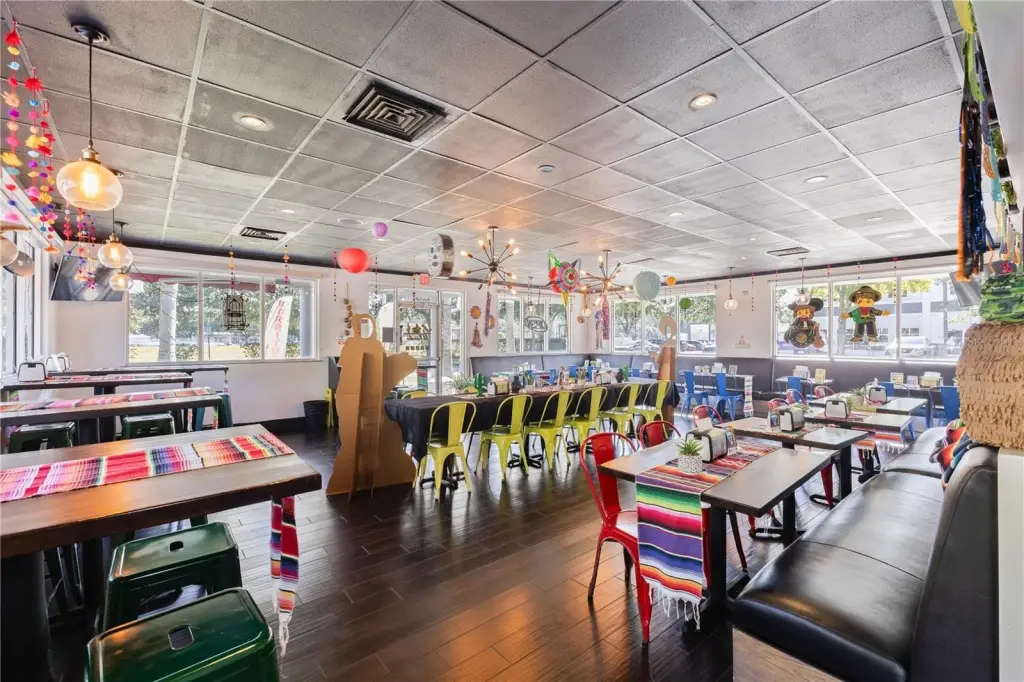
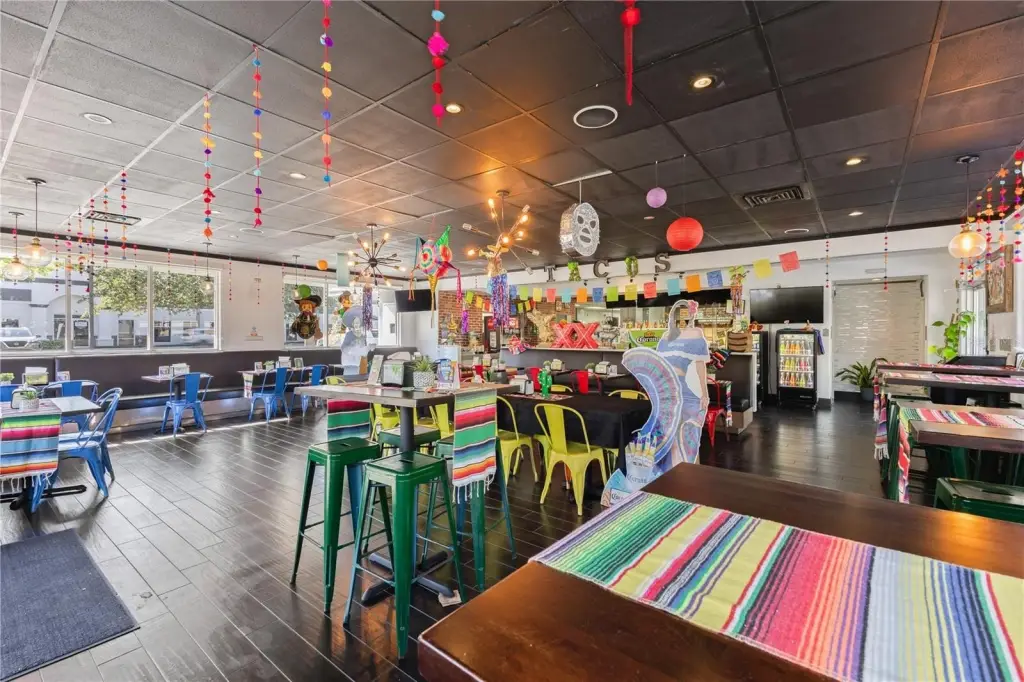
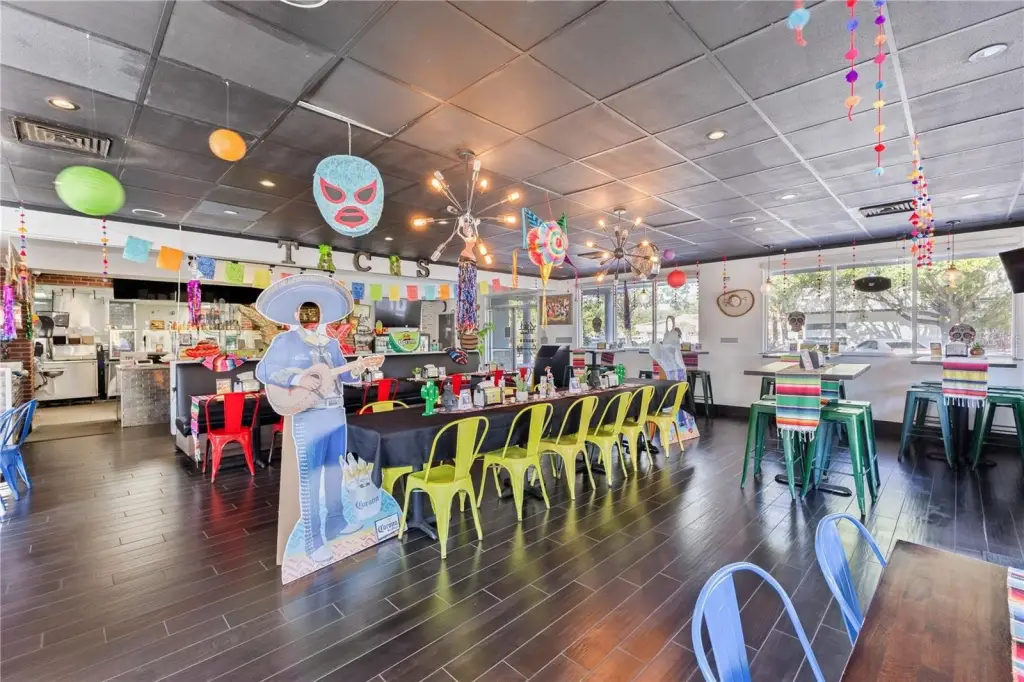
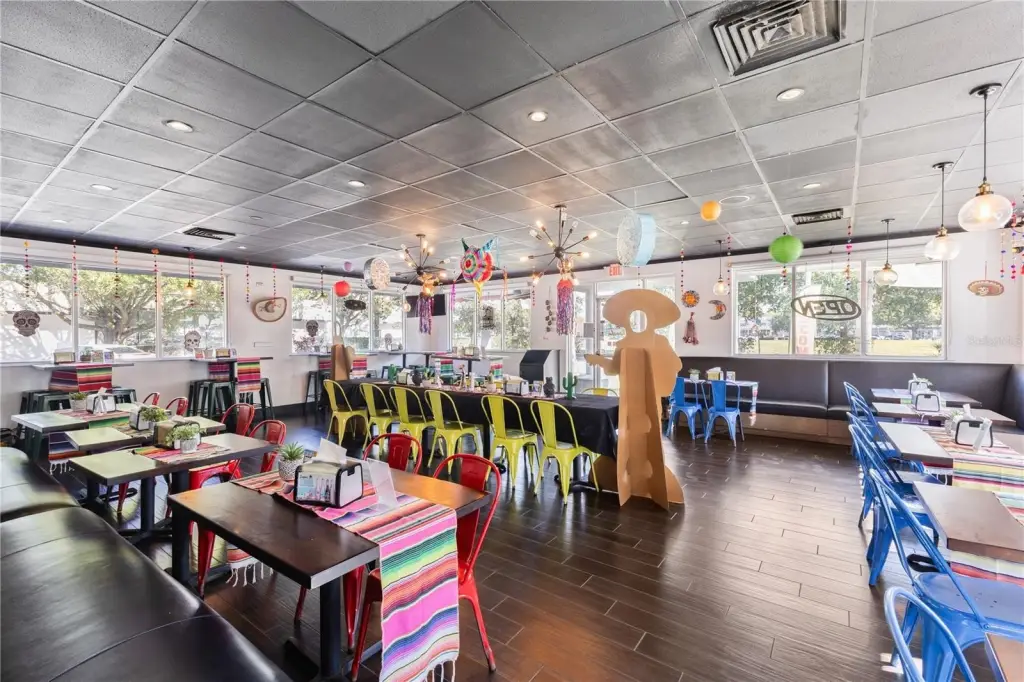
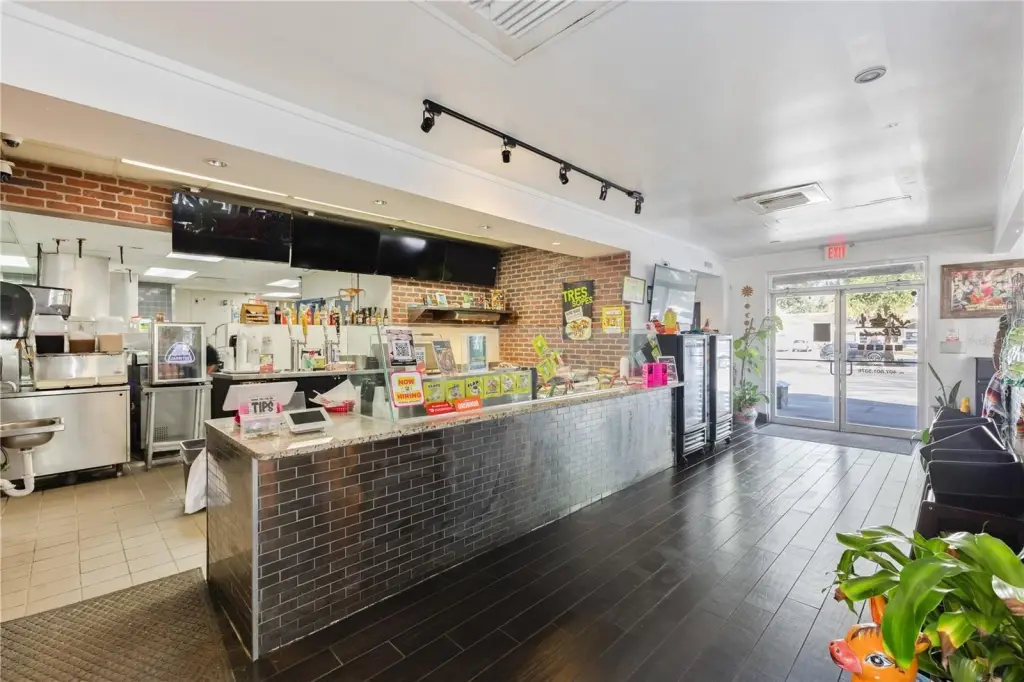
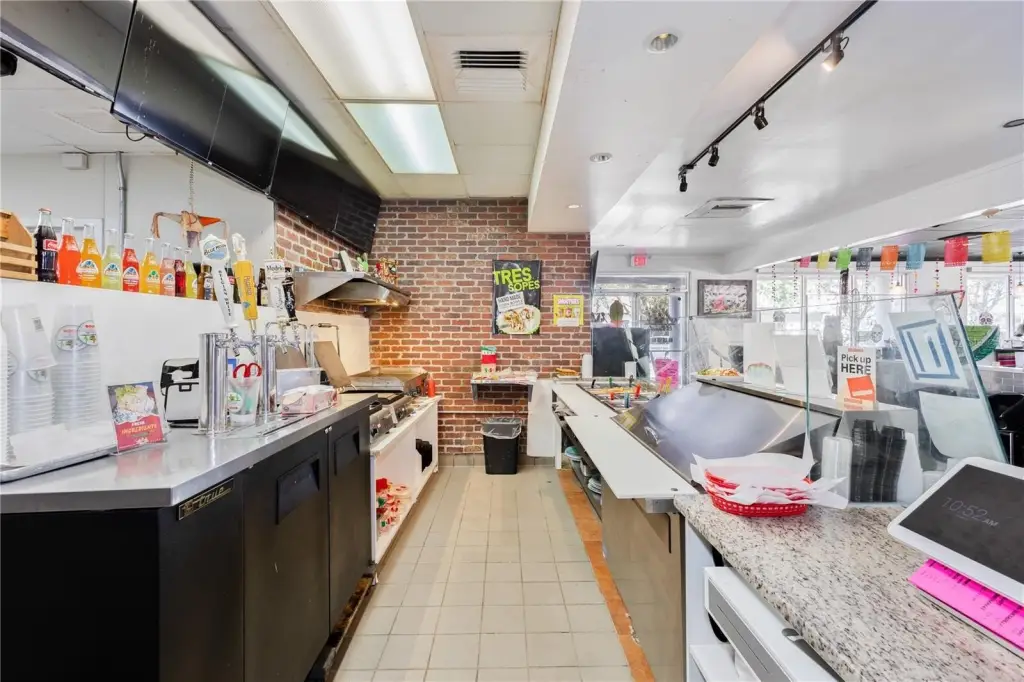
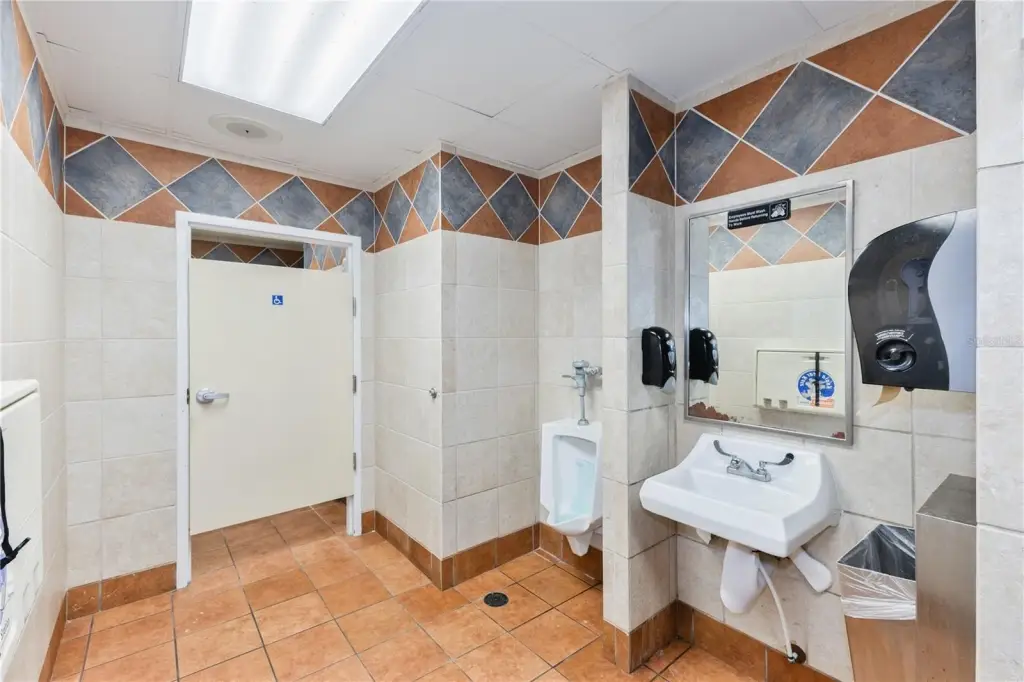
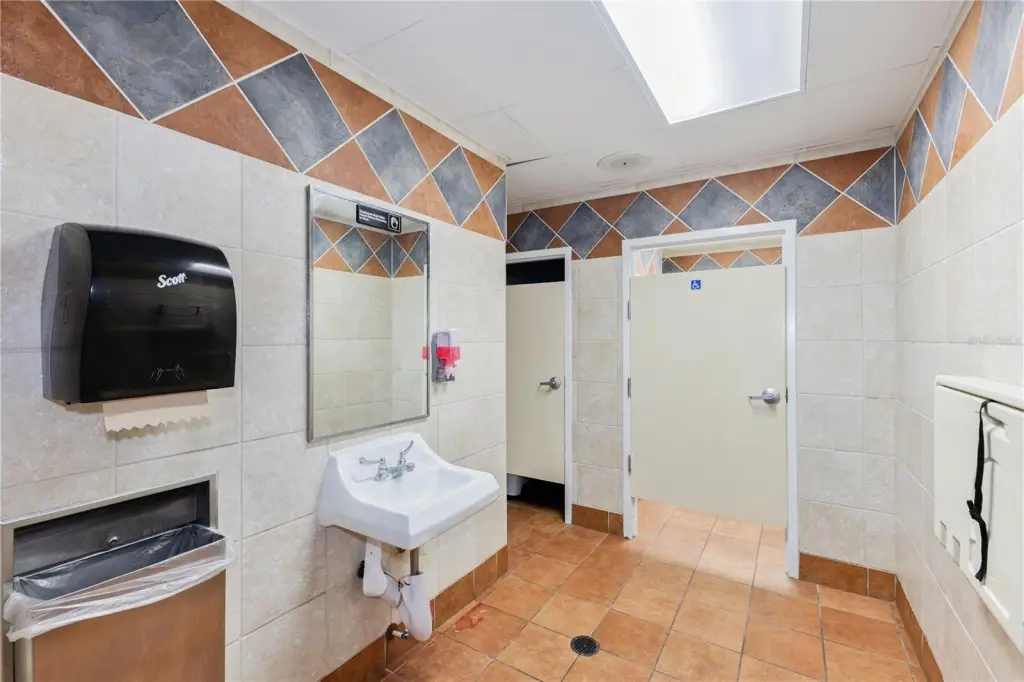
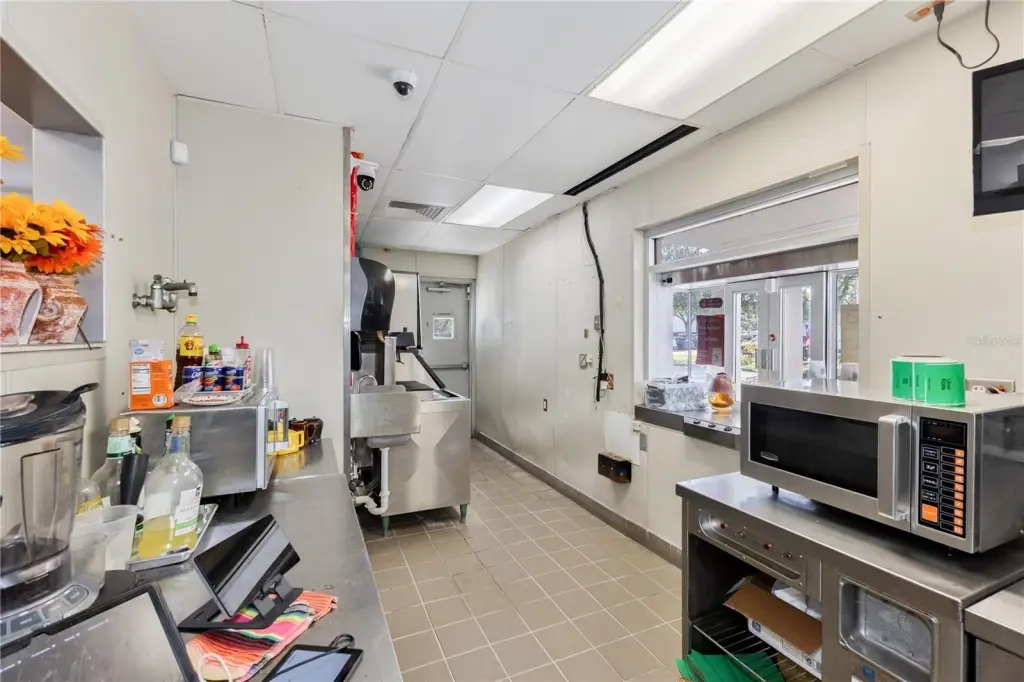
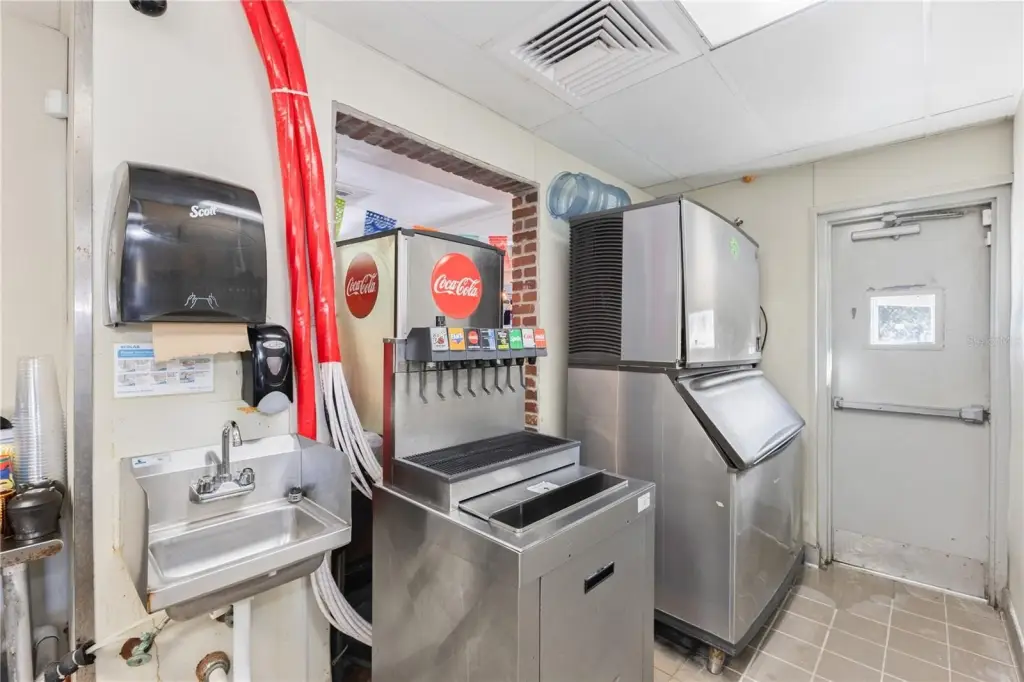
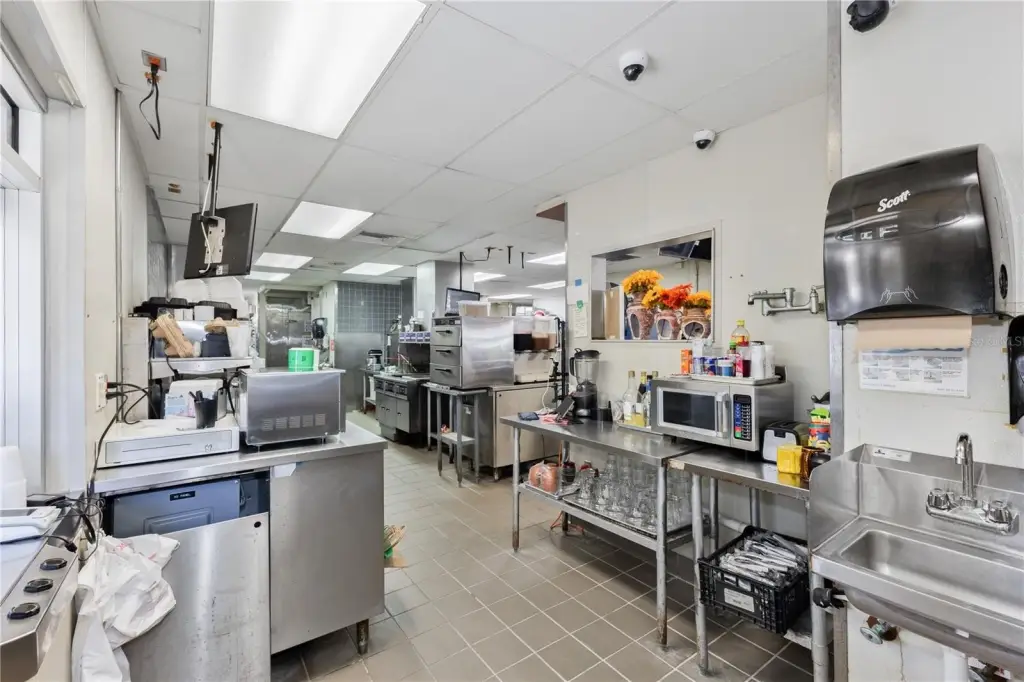
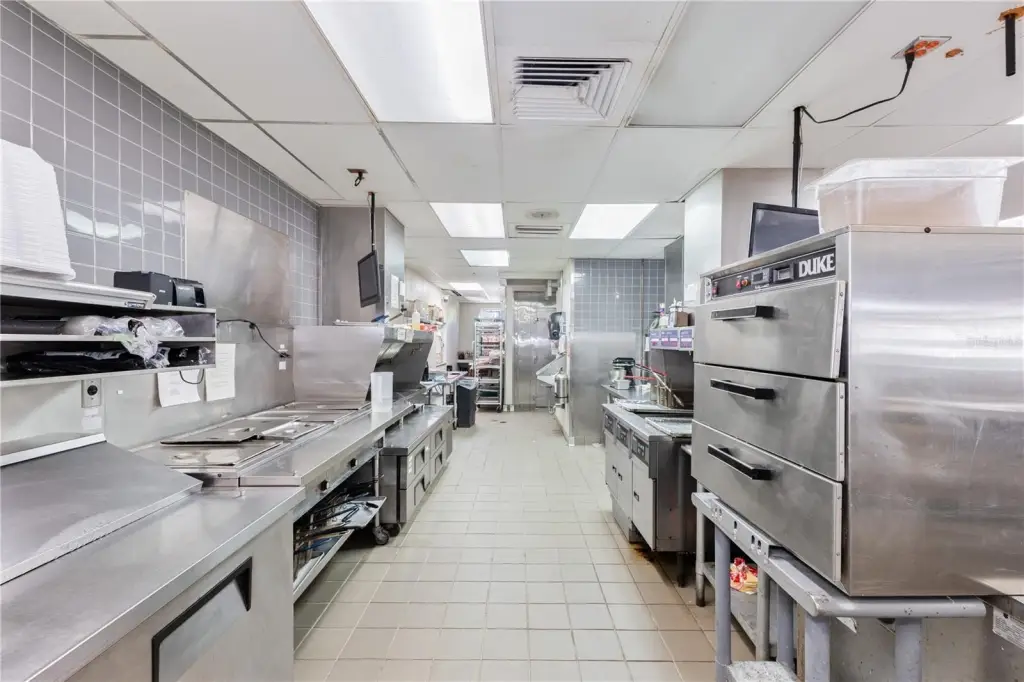
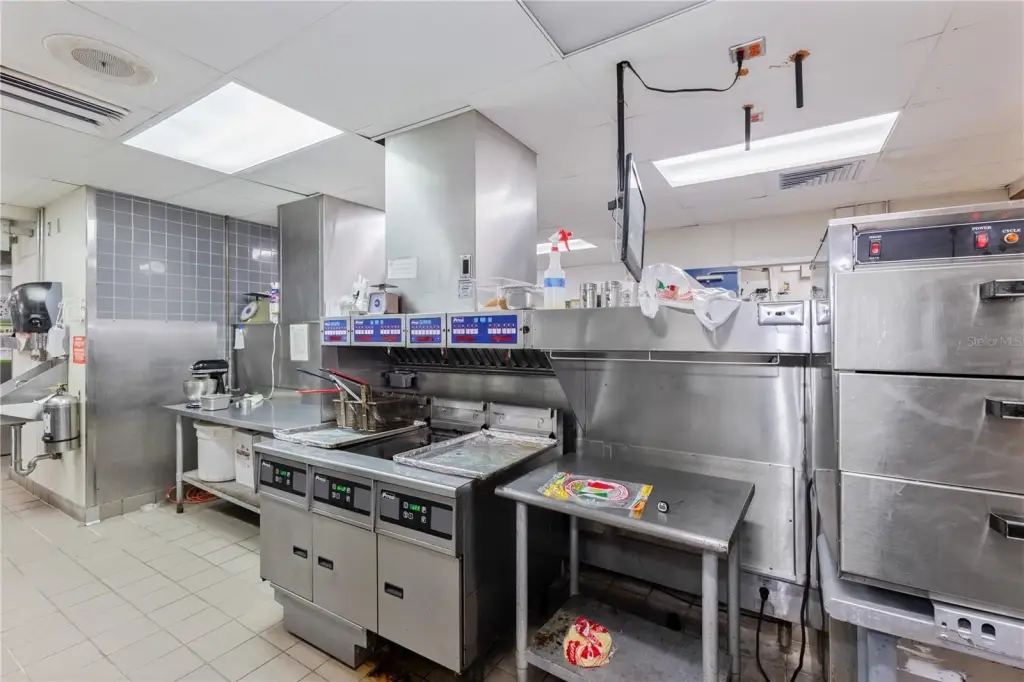
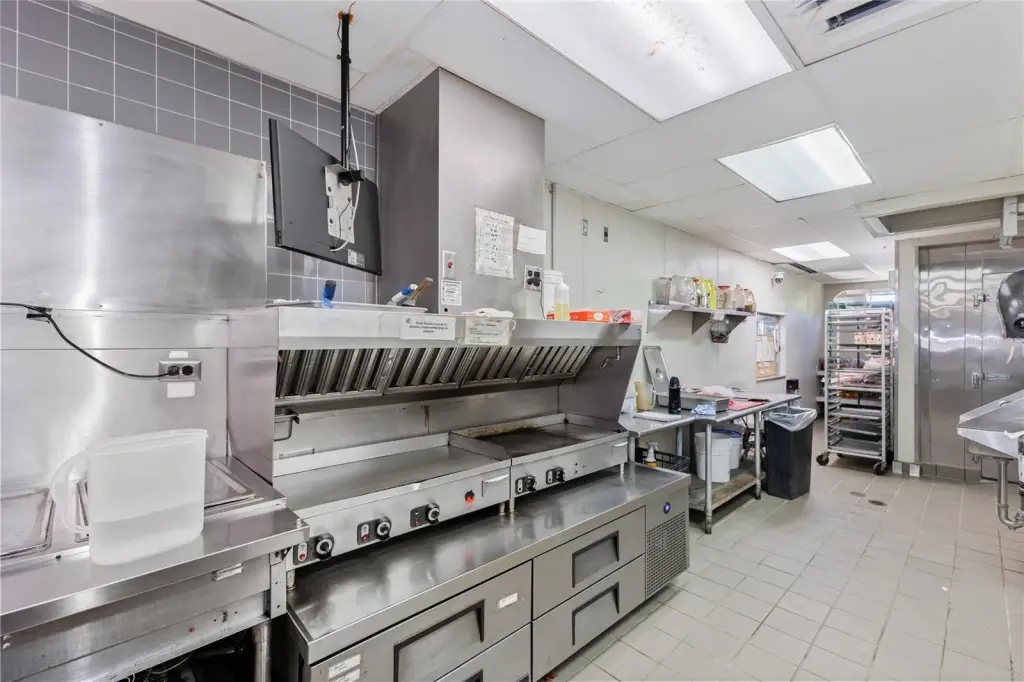
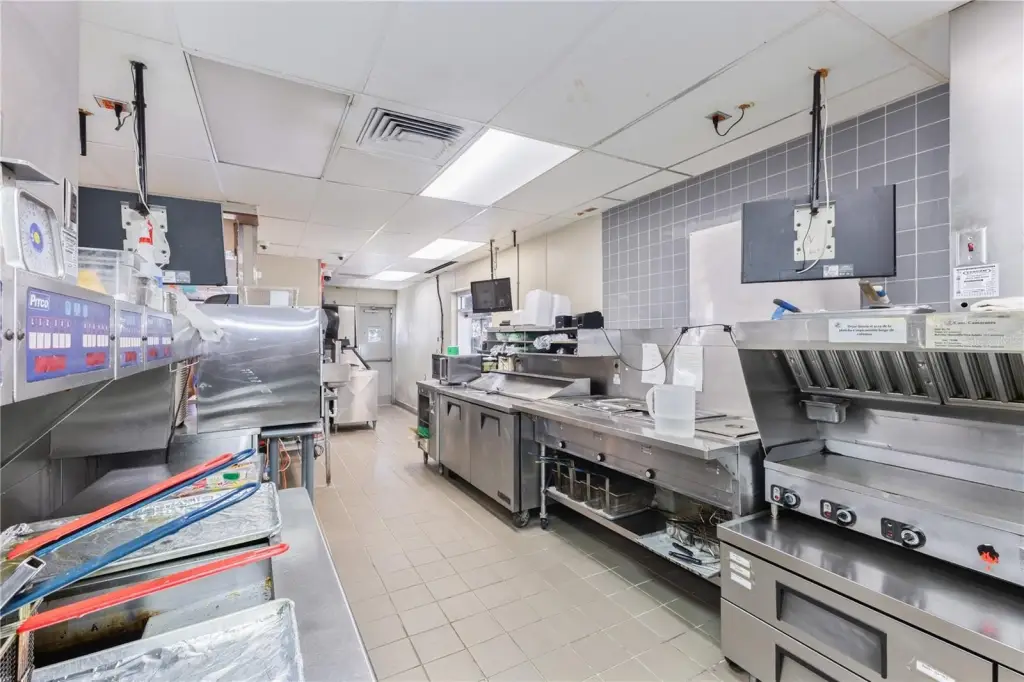
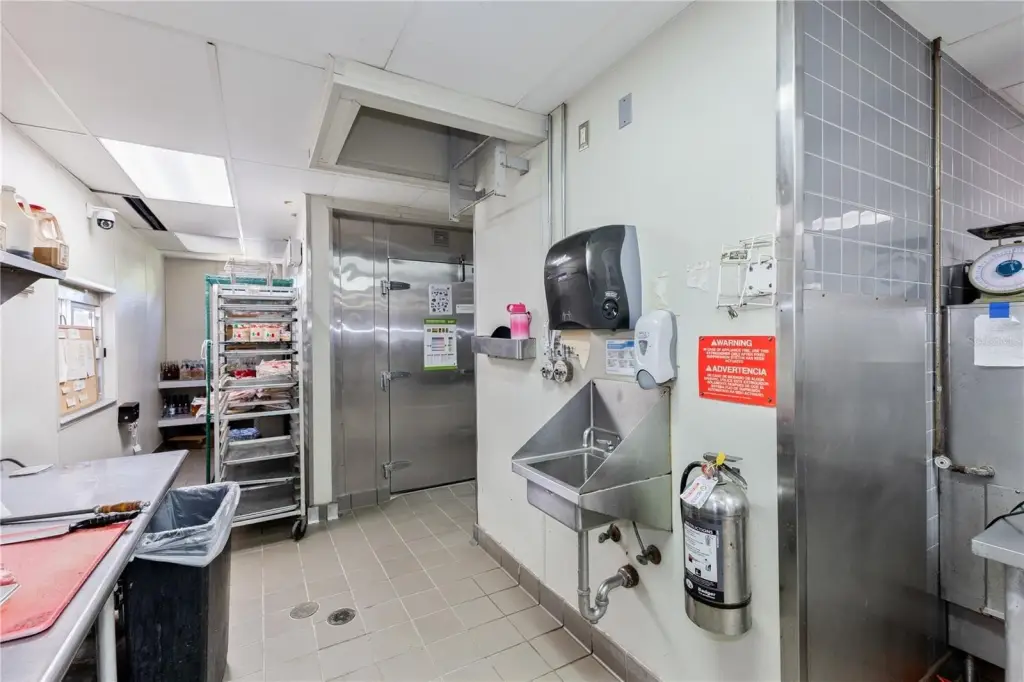
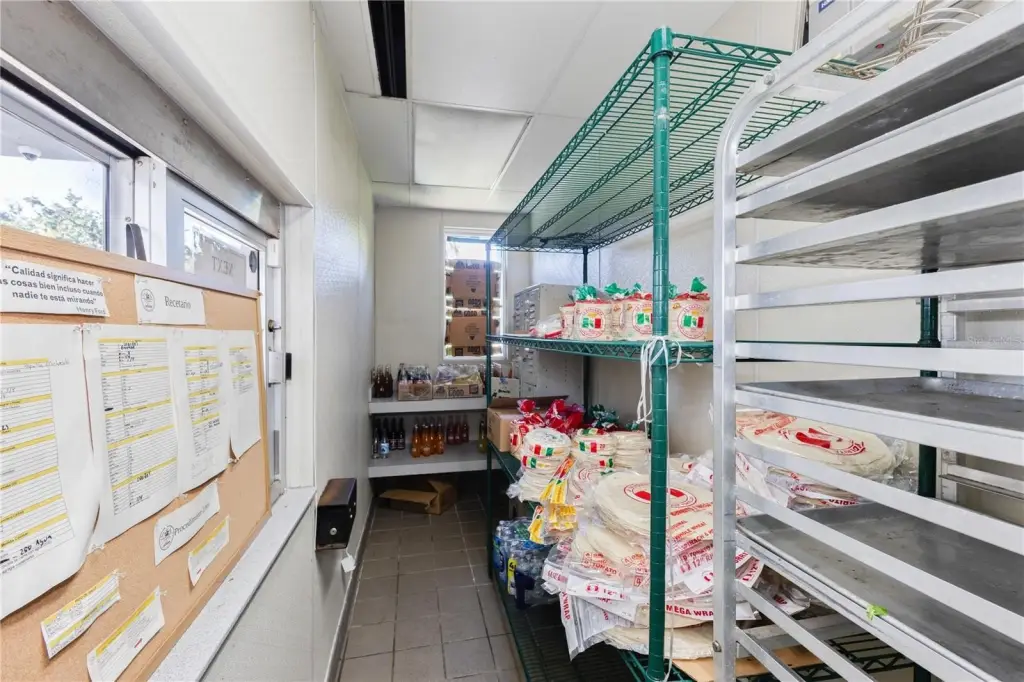
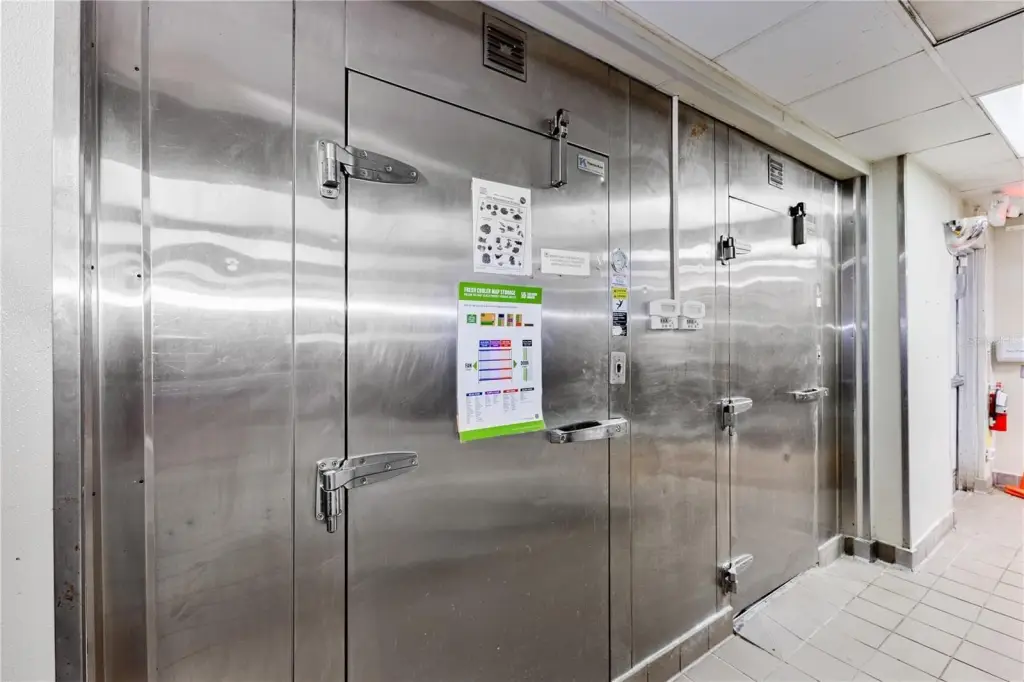
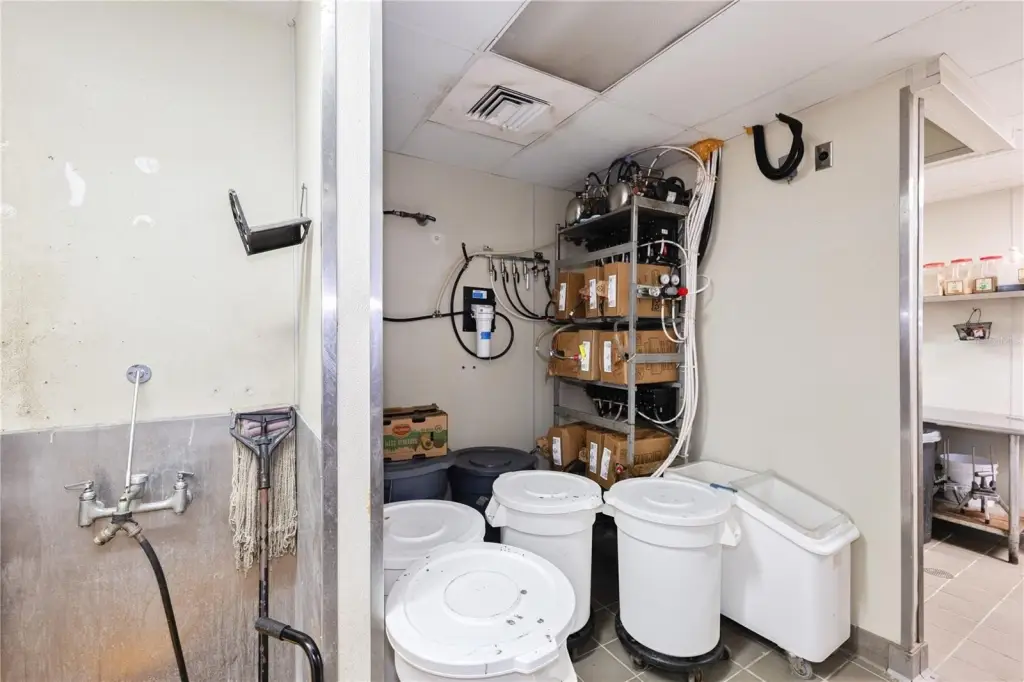
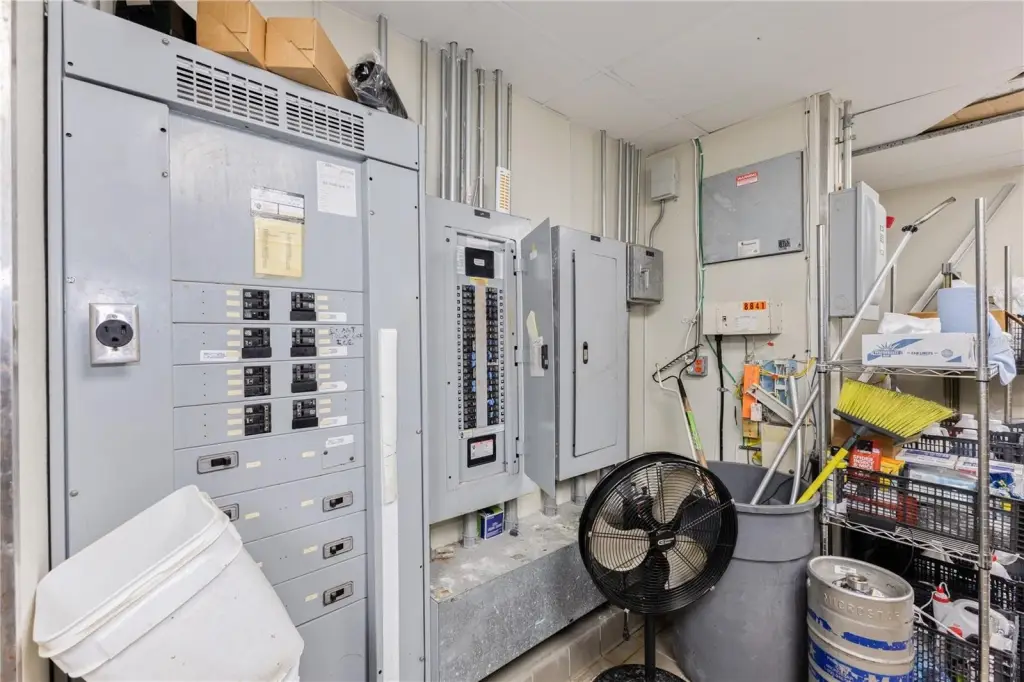
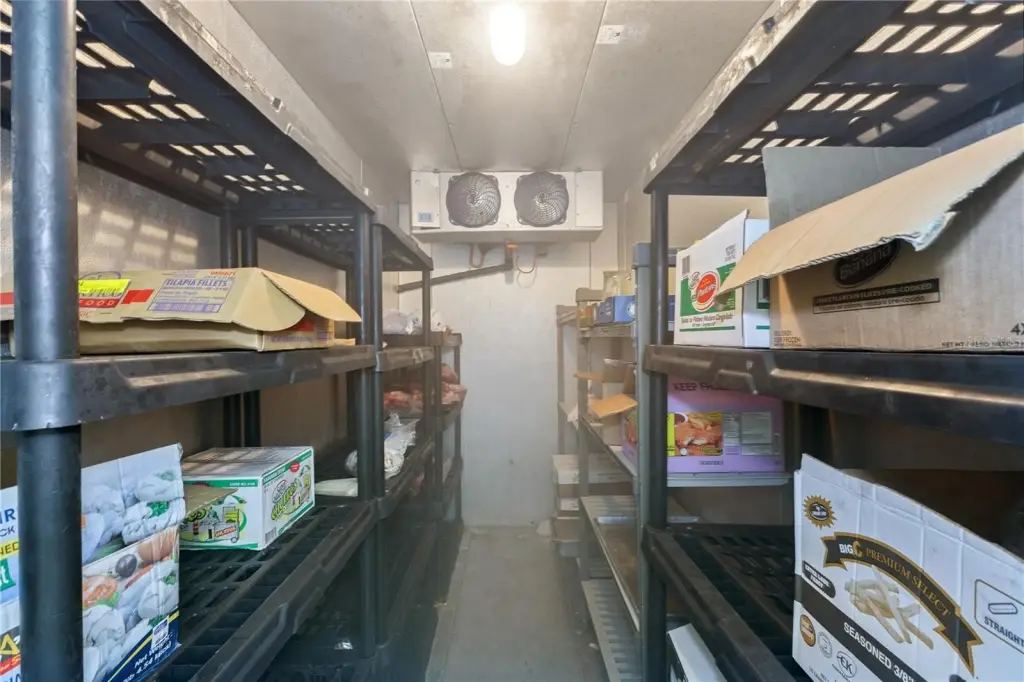
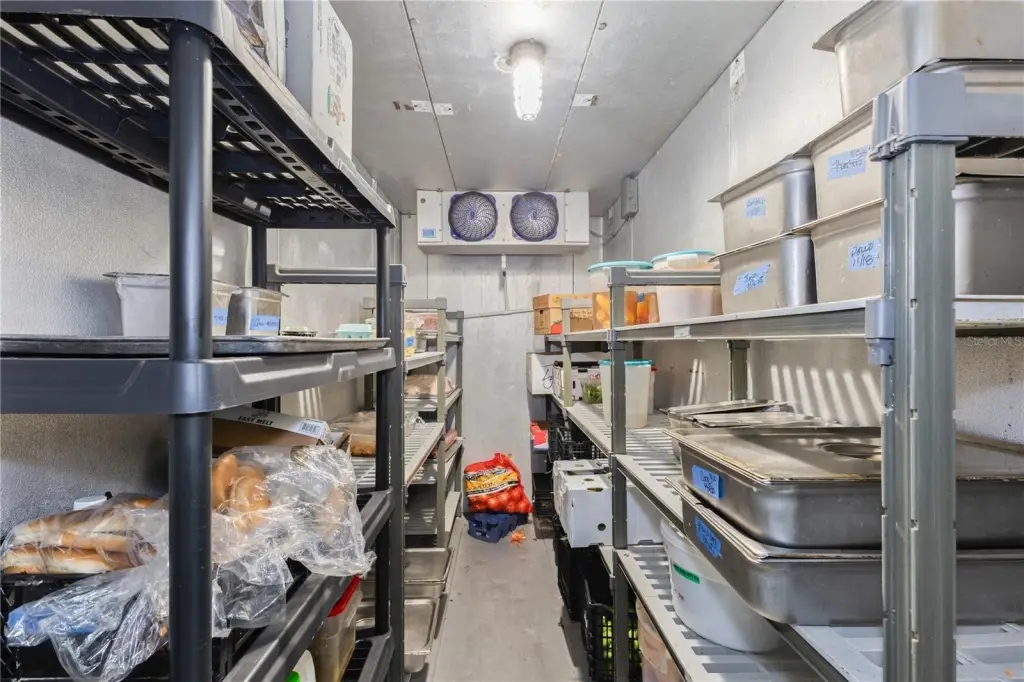
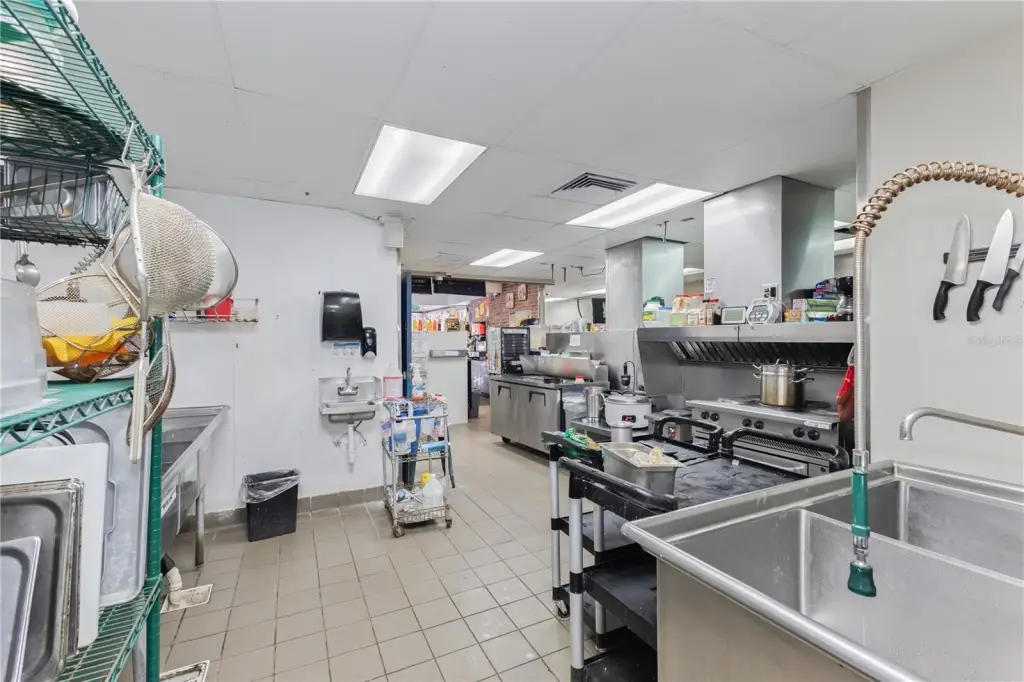
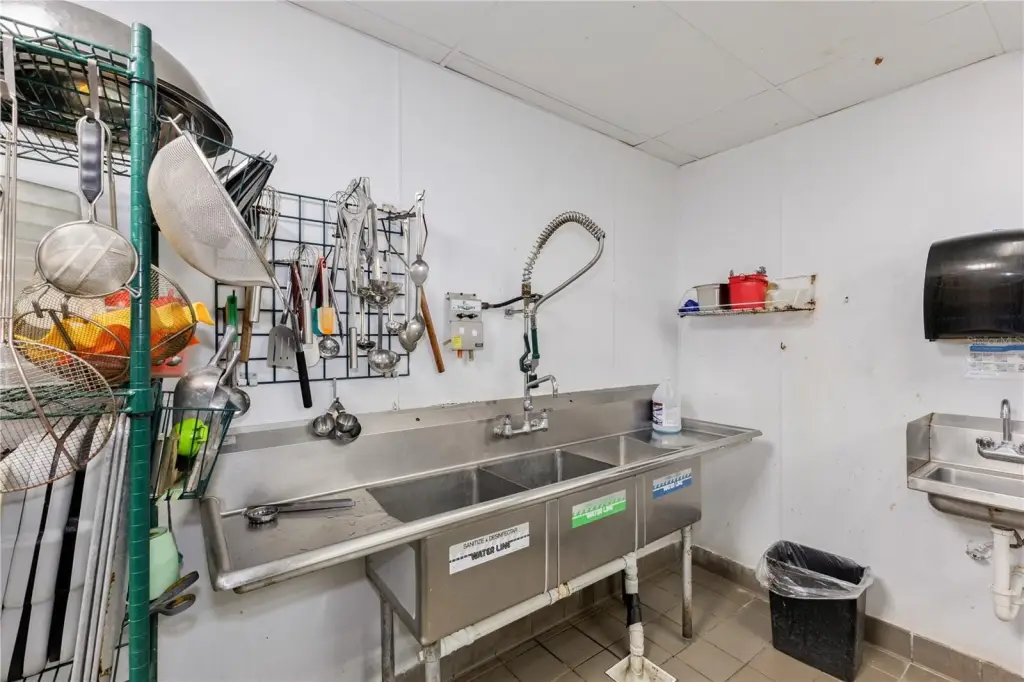
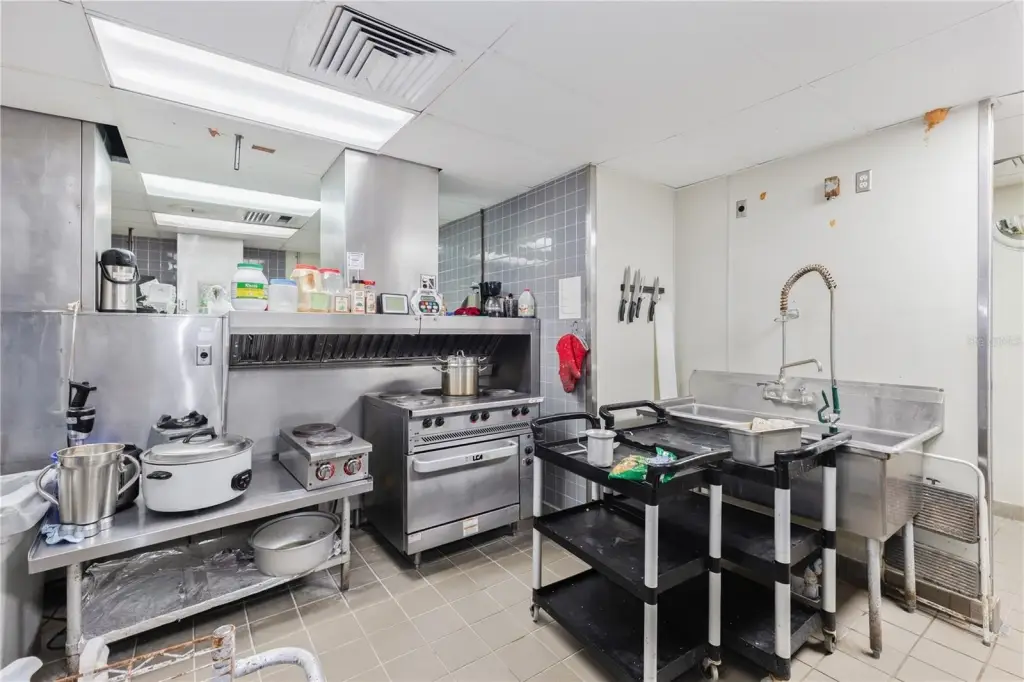
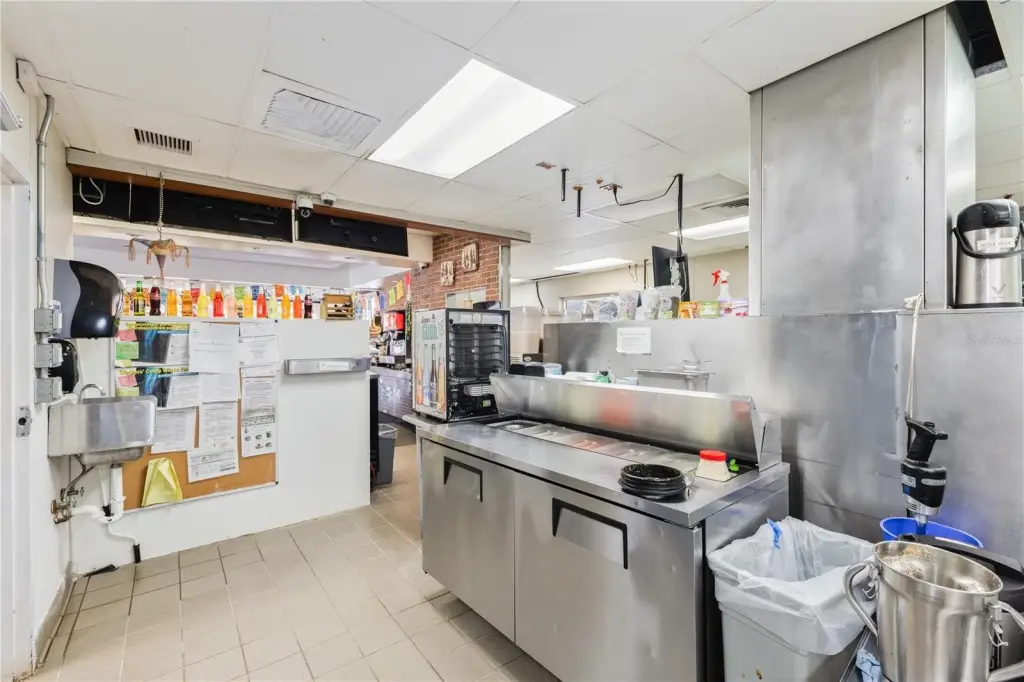
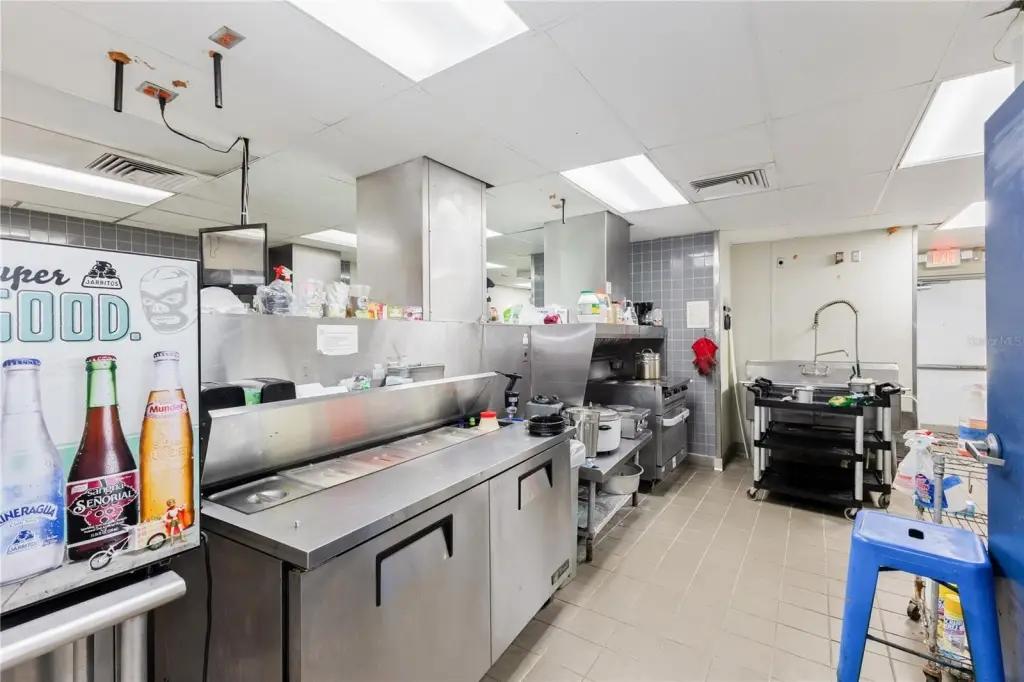
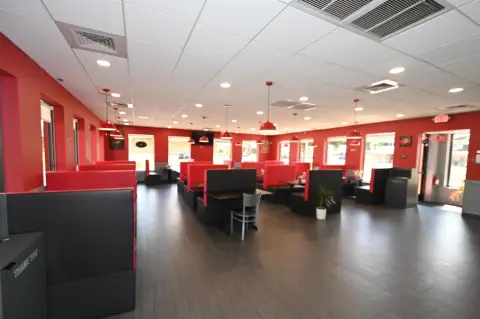
This 4,055-square-foot freestanding restaurant was built in 2005 and is configured for drive-through service. The second-generation facility includes furniture, fixtures, equipment, walk-in cooler systems, a monument sign, and central air. Block construction supports the existing restaurant improvements, while two new AAON fresh-air restaurant HVAC systems were installed in September 2026.
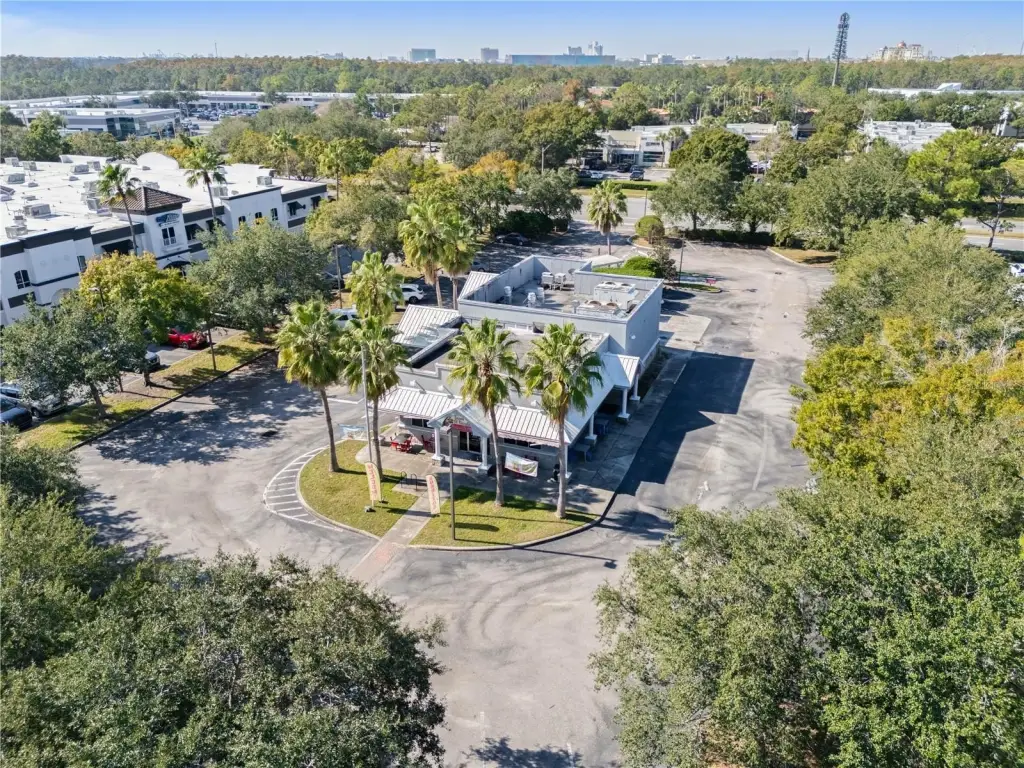
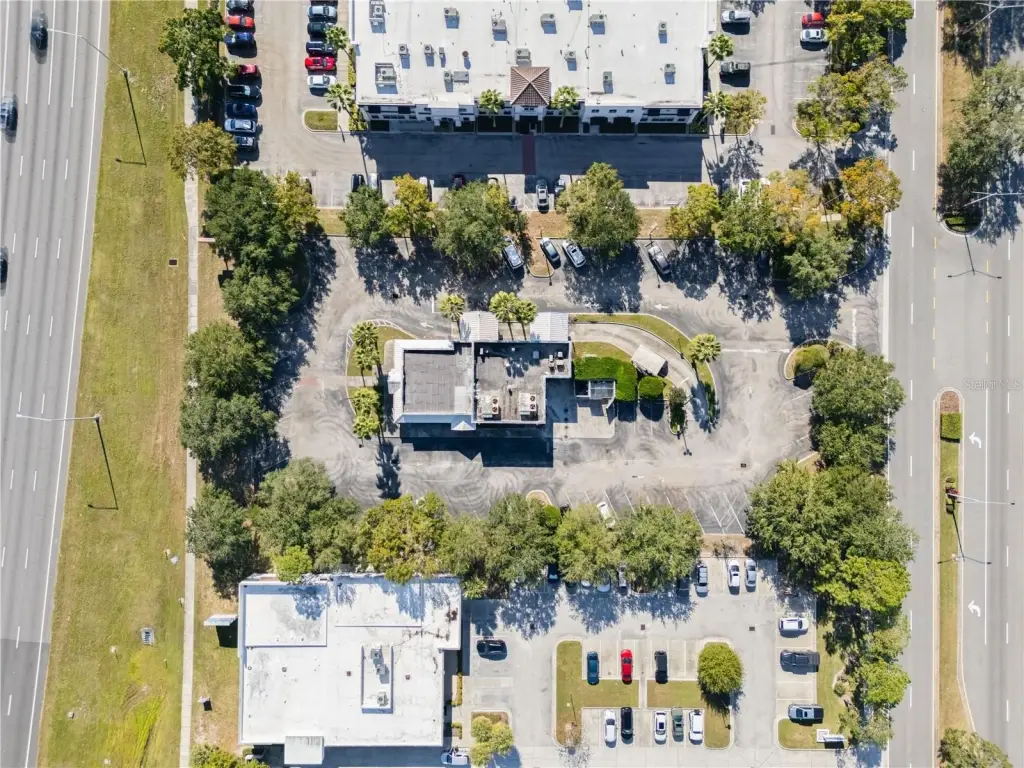
The property fronts John Young Parkway at 8841 Commodity Circle in Orlando, with access from Commodity Circle. It is approximately 1 mile north of the Beachline Expressway (SR 528), placing the site along a north-south corridor connecting SR 528 with Sand Lake Road. The surrounding area includes national retailers, residential development, industrial parks, and office parks. The property is also near the Florida Mall area.
The property fronts John Young Parkway at 8841 Commodity Circle in Orlando, with access from Commodity Circle. It is approximately 1 mile north of the Beachline Expressway (SR 528), placing the site along a north-south corridor connecting SR 528 with Sand Lake Road. The surrounding area includes national retailers, residential development, industrial parks, and office parks. The property is also near the Florida Mall area.
Key Highlights
- 4,055‑square‑foot freestanding restaurant building constructed in 2005
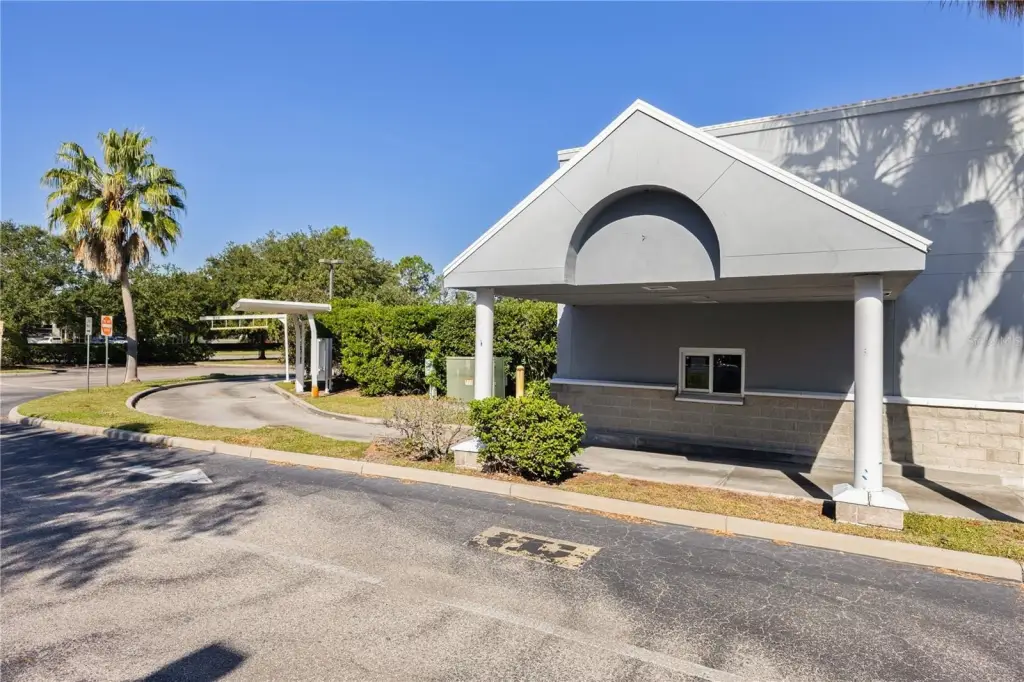
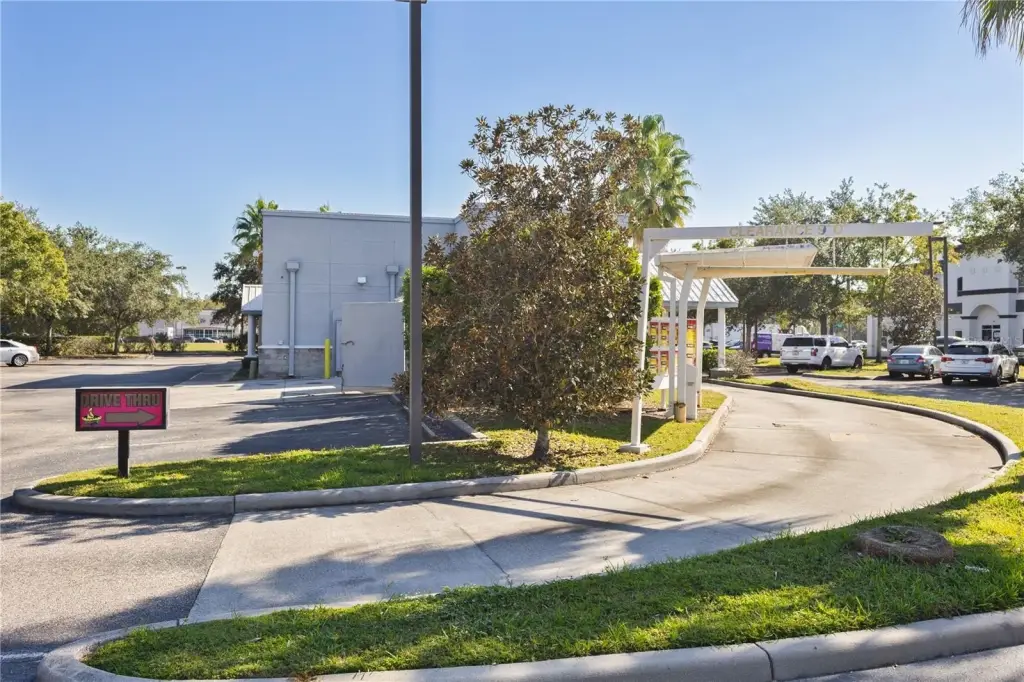
- Drive‑through configuration with furniture, fixtures, and equipment included
- Two new AAON fresh‑air restaurant HVAC systems installed in September 2026
Financial Insights
Estimated NOI and Cap Rate
NOI / Yr
$85,315
Cap Rate
3.10%
Suggested Prices Based on Cap Rates
Cap Rate 5%
$1,706,300
$1.7M
Cap Rate 7%
$1,218,786
$1.2M
Cap Rate 9%
$947,944
$947.9K
Market Conditions
NOI Build-Up for 4,055 SF
Gross rent
$117.8K $29.04/SF
− Vacancy
−$4.0K −$0.99/SF
EGI
$113.8K $28.05/SF
− OpEx
−$28.4K −$7.01/SF
NOI
$85.3K $21.04/SF
Area
Orlando, FL
Vacancy
3.40%
Lease Rate
$29.04 /SF/Yr
Expense Ratio
25.00%
Simulate Cap Rate and NOI
Suggested Prices Based on Cap Rates
Cap Rate 5%
$1,706,300
Cap Rate 7%
$1,218,786
Cap Rate 9%
$947,944
Alternative Uses
Best Use
Specialty Retail
$1.22M
$1.07M – $1.42M
NOI $85,315 @ 7.0% cap · market cap 3.10%
Second Best
—
—
no second resolved use
Theoretical Best
Office A
$1.31M
$1.14M – $1.52M
NOI $91,438 @ 7.0% cap · market cap 3.33%
Zoning and permitted uses should be independently verified with authorities.
Property Analytics
Unlock full access to Insights
Subscribe to Realmo Intelligence
Open Analytics
Current Use
Lease Details
Yes
Paved road access
Location Intelligence
Trade Area within ½ mile
1,324
Businesses Nearby
267k
Monthly Visits Nearby
Explore this area
Business Placement
Foot Traffic Nearby
Superstores 46%
Shops & Services 31%
Dining 19%
Hotels & Casinos 3%
Walmart
Superstores
123,683 visits/mo
0.4 miles
RaceTrac
Shops & Services
24,108 visits/mo
0.4 miles
McDonald's
Dining
18,940 visits/mo
0.3 miles
Starbucks
Dining
16,160 visits/mo
0.5 miles
PetSmart
Shops & Services
12,691 visits/mo
0.3 miles
Demographics for 32819, FL
30,857
Population
14,689
Households
2.1
Avg Household Size
40
Median Age
51%
College-Educated
92%
High-School Grad
20.7 sq mi
ZIP Area
1,491
Density / Sq Mi
$94,386
Median Household Income
$47,166
Median Earnings
$1,947
Median Rent
$454,000
Median Home Value
Check the figures for this property
Cap Rate, Value Estimation, Potential NOI and more
View Realmo Analytics
Market
Vacancy Rate% for Retail in Orlando, FL

Questions? Ask Rey
Realmo’s AI knows this listing — price, zoning, demand, history. Ask anything.




Frequently Asked Questions
What type of property is this?
Drive through restaurant - Fully equipped second-generation facility with furniture, fixtures, equipment, and walk-in cooler systems included.
Where is this drive through restaurant located?
The property is located at 8841 COMMODITY Circle Orlando, FL.
What is the asking price?
The asking price for this property is $2,750,000.
What are key features of this property?
This property features: 4,055‑square‑foot freestanding restaurant building constructed in 2005; Drive‑through configuration with furniture, fixtures, and equipment included; Two new AAON fresh‑air restaurant HVAC systems installed in September 2026


