Two-Bedroom Duplex with
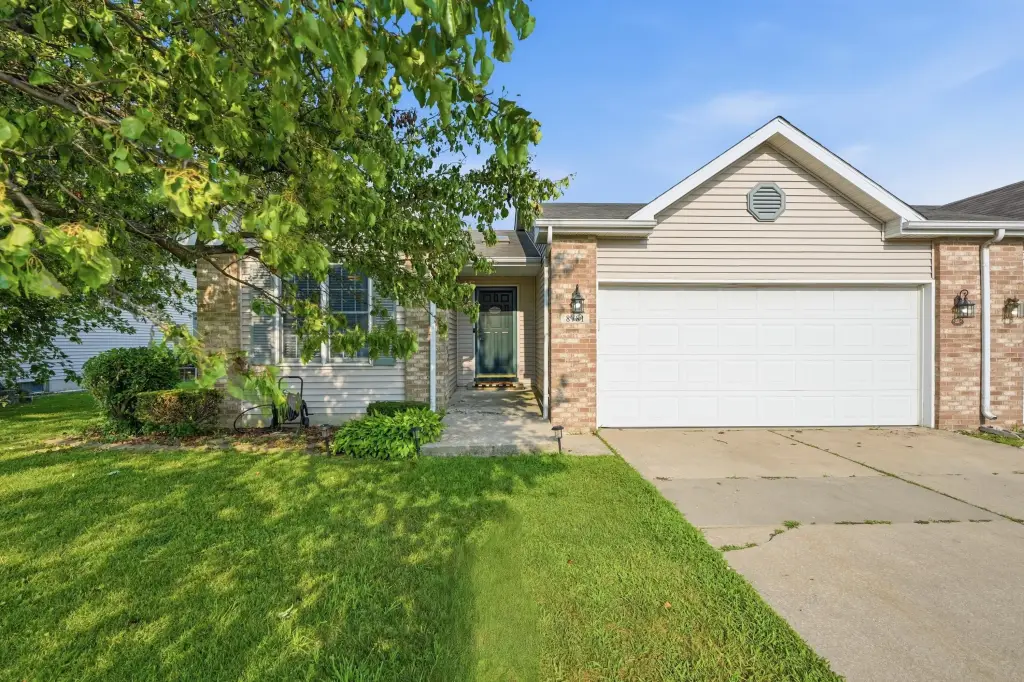
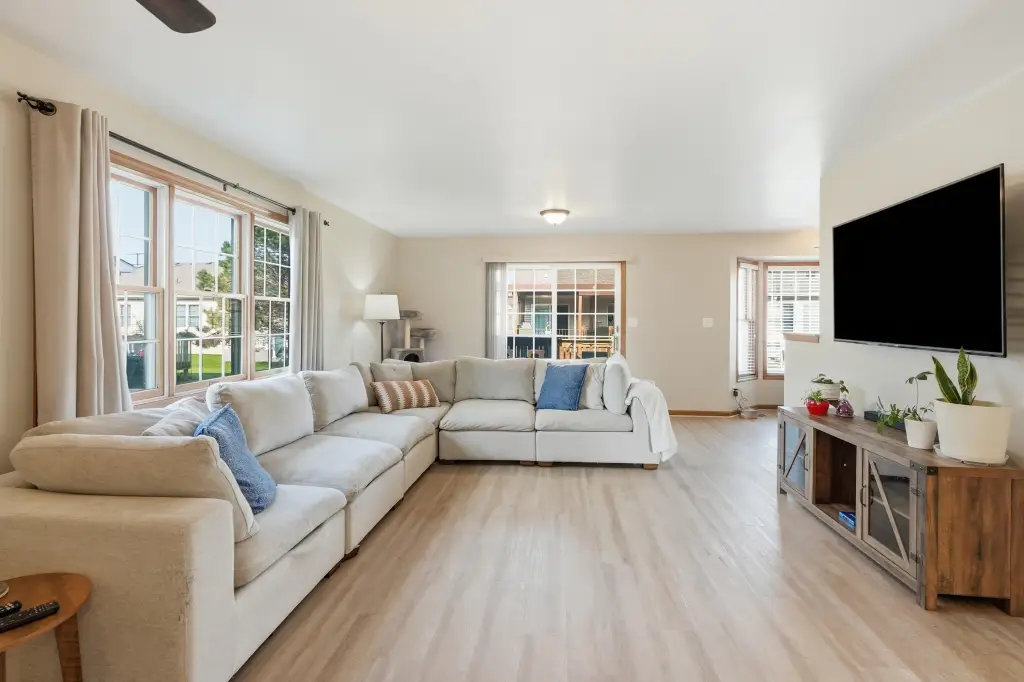
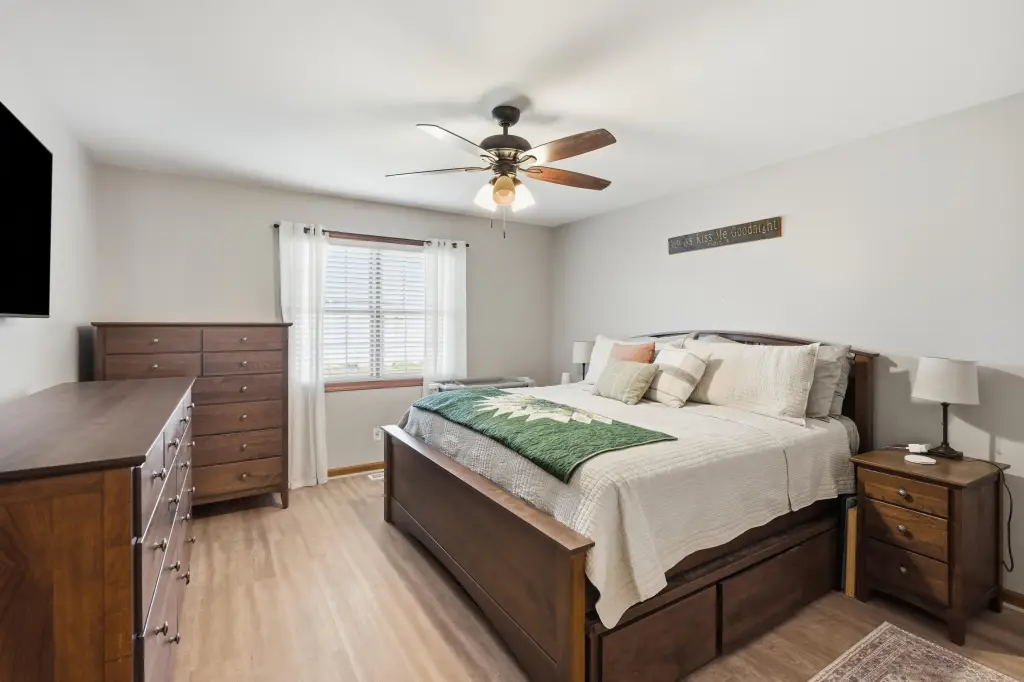
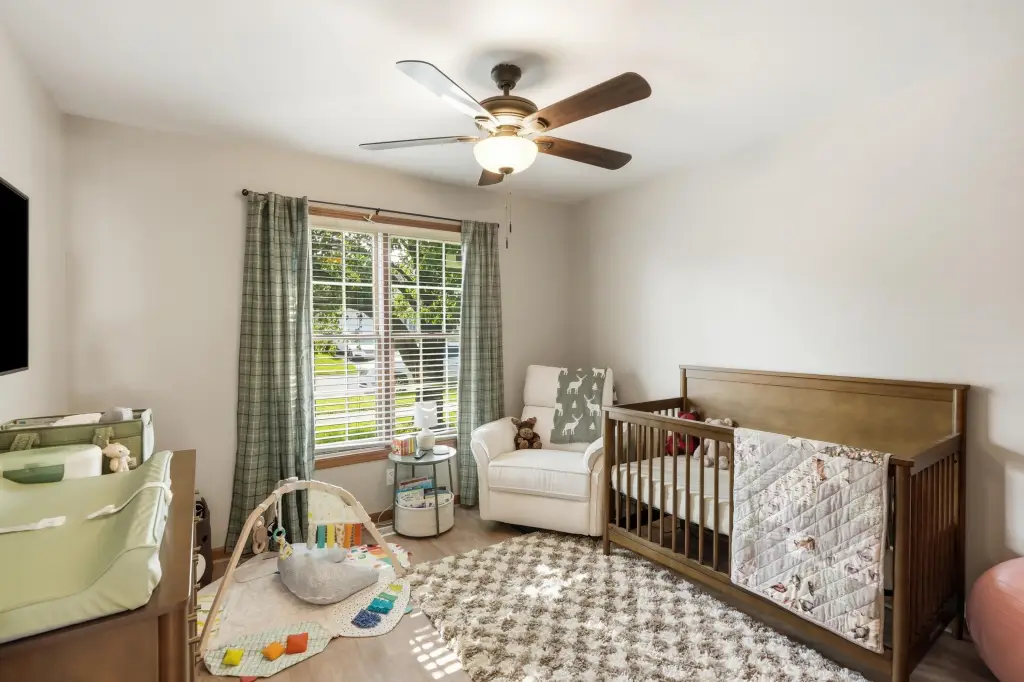
For Sale
Under Contract
$234,900
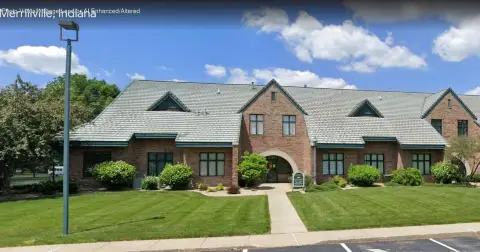
8781 Monroe Street, Merrillville, IN 46410
Residential, Merrillville, IN
Property Size1,253 SF
Lot Size0.14 Acres
Price / SF$187.47
Days on Market61
Property Features for 8781 Monroe Street
General Information
Property type
Residential
Property subtype
Duplex
Bedrooms
2
Bathrooms
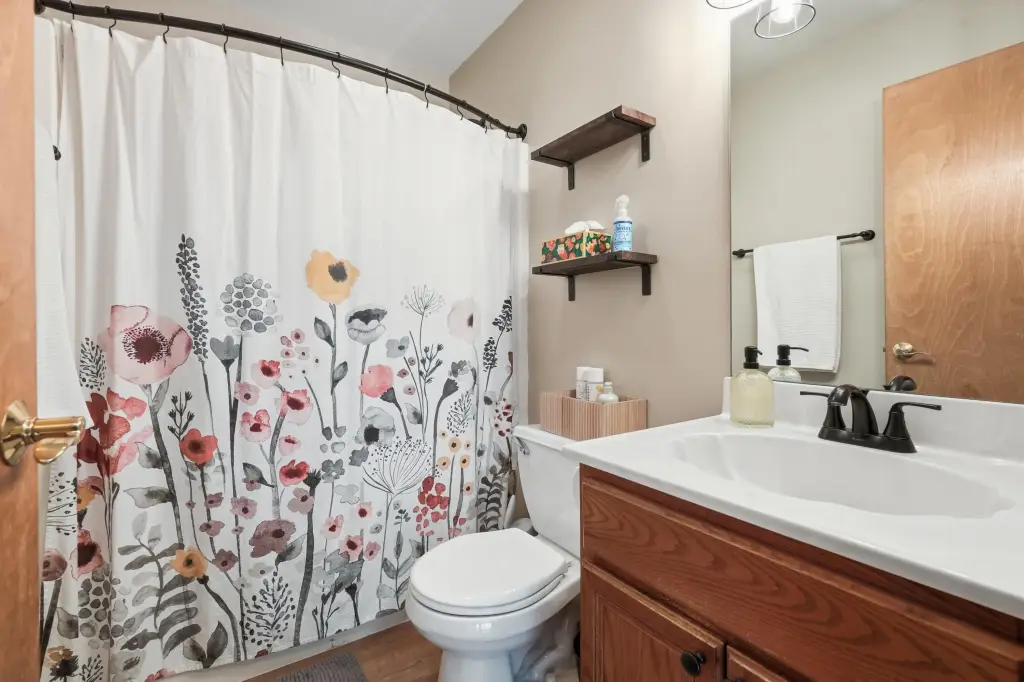
2
Full bathrooms
2
Rooms
Bedroom 2, Bathroom 2, Bedroom 1, Laundry Room, Dining Room, Bathroom 1
Parking features
Driveway, Open, Garage
Window features
Blinds
Patio and Porch features
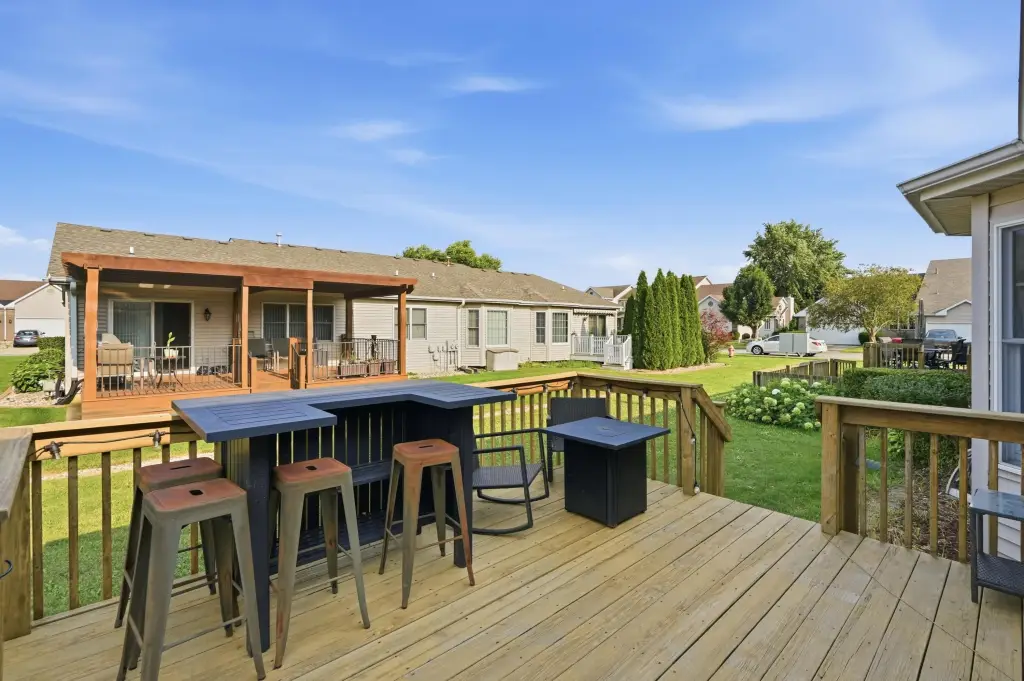
Deck
Interior features
Ceiling Fan(s)
Exterior features
Rain Gutters
Basement
Crawl Space
Appliances
Built-In Gas Range, Washer, Refrigerator, Microwave, Dishwasher, Dryer
Subdivision
Westwood 02
Lot features
Landscaped, Paved
Elementary school district
Merrillville
Middle school district
Merrillville
High school district
Merrillville
Directions
US 30 to Merrillville Road, South to 87th, East to Monroe, South to Home
Standard status
Active Under Contract
APN
451228258007000030
Size
1,253 SF
Lot size
0.14 Acres
Taxes and HOA fees
Tax Year
2024
Tax Description
WESTWOOD II N.53FT OF LOT 13
Tax Annual Amount
1865
Legal Description
WESTWOOD II N.53FT OF LOT 13
Utilities
Utilities
Cable Available
Sewer type
Public Sewer
Heating system
Forced Air
Water source
Public
Amenities
back deck
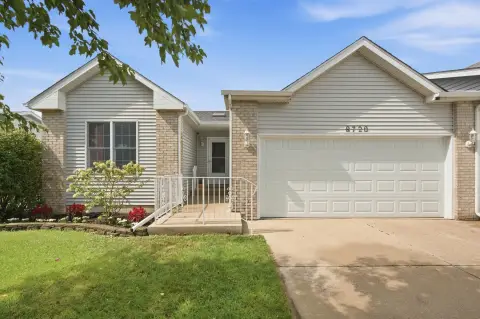
attached garage
Building Details
Year built
2000
Floors in Building
1
Listing Agency:
McColly Real Estate
(219) 322-5508
Listed By:
Jeffrey Fryzel · License #475168697
(708) 243-1827
Added: Aug 6
Changed: Sep 15
Last Checked: Oct 5 at 10:06PM
MLS# 843471
Copyright © 2026 Greater Northwest Indiana Association of REALTORS. All rights reserved. All information provided by the listing agent/broker is deemed reliable but is not guaranteed and should be independently verified.
Investment Insights
Based on property information with market context.
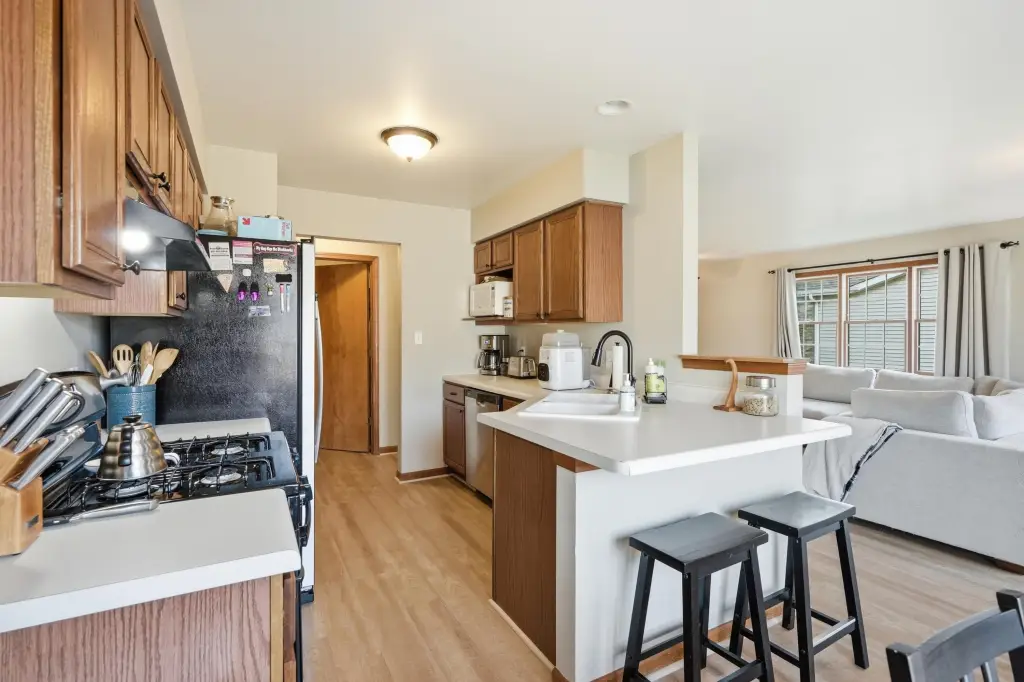
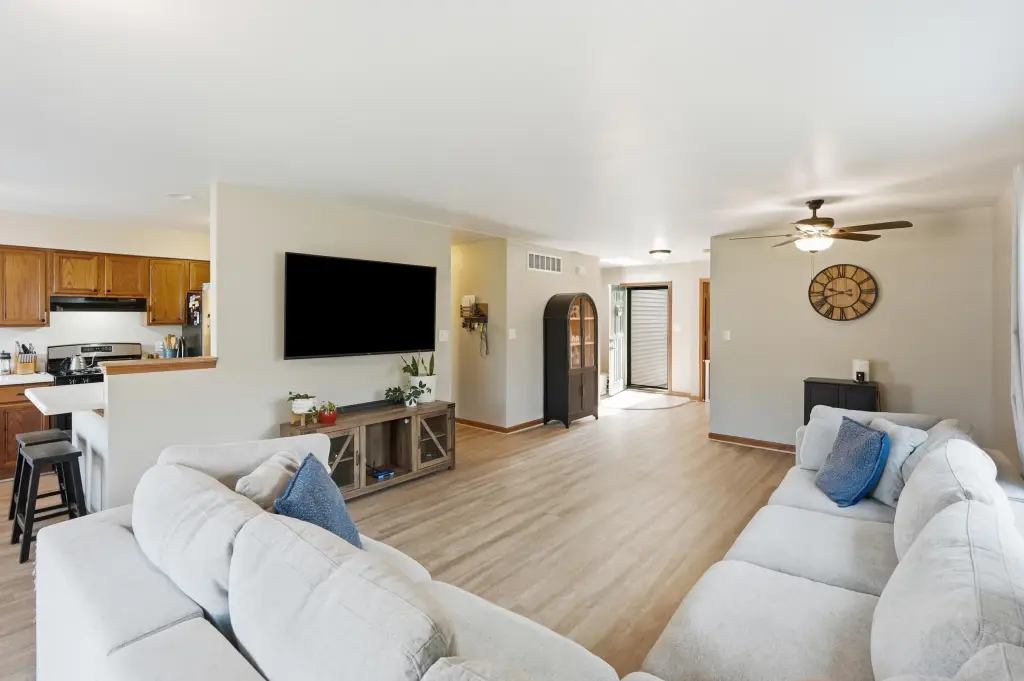
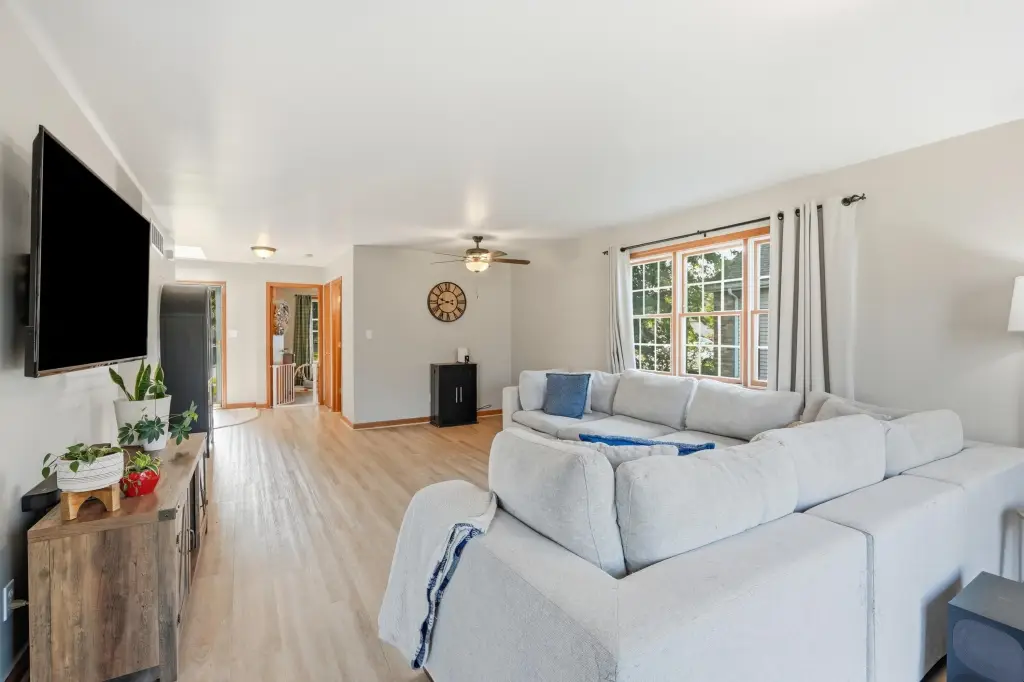
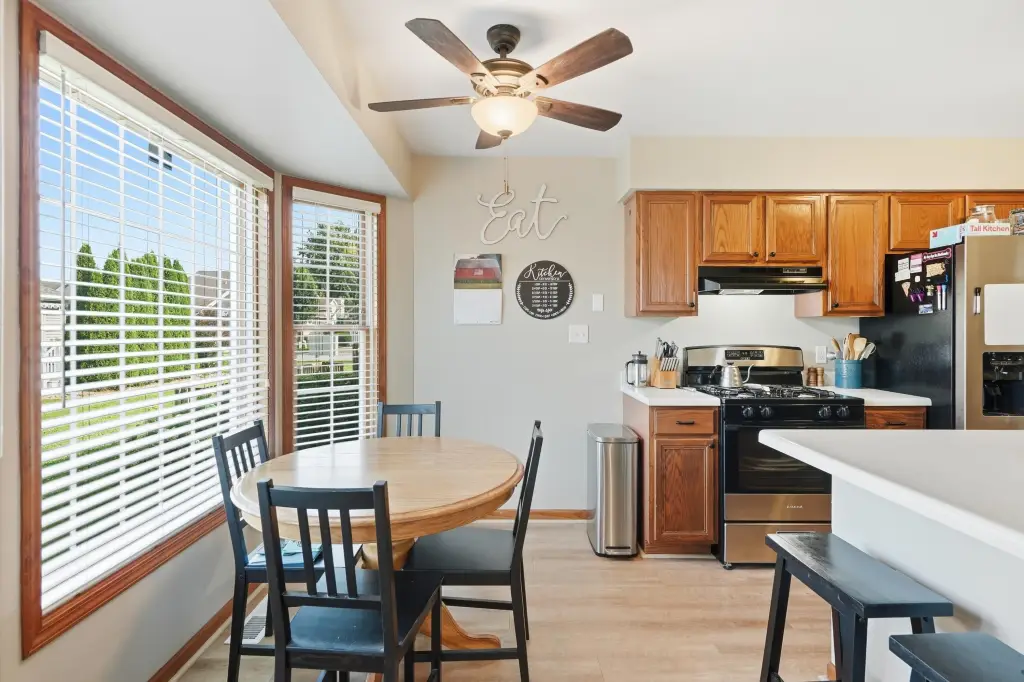
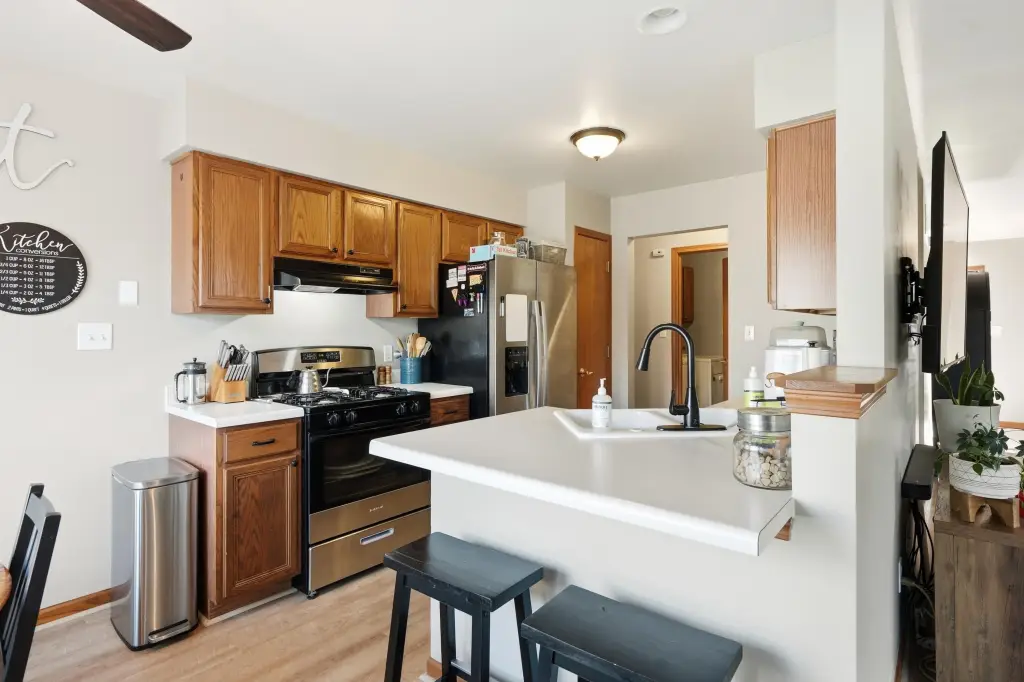
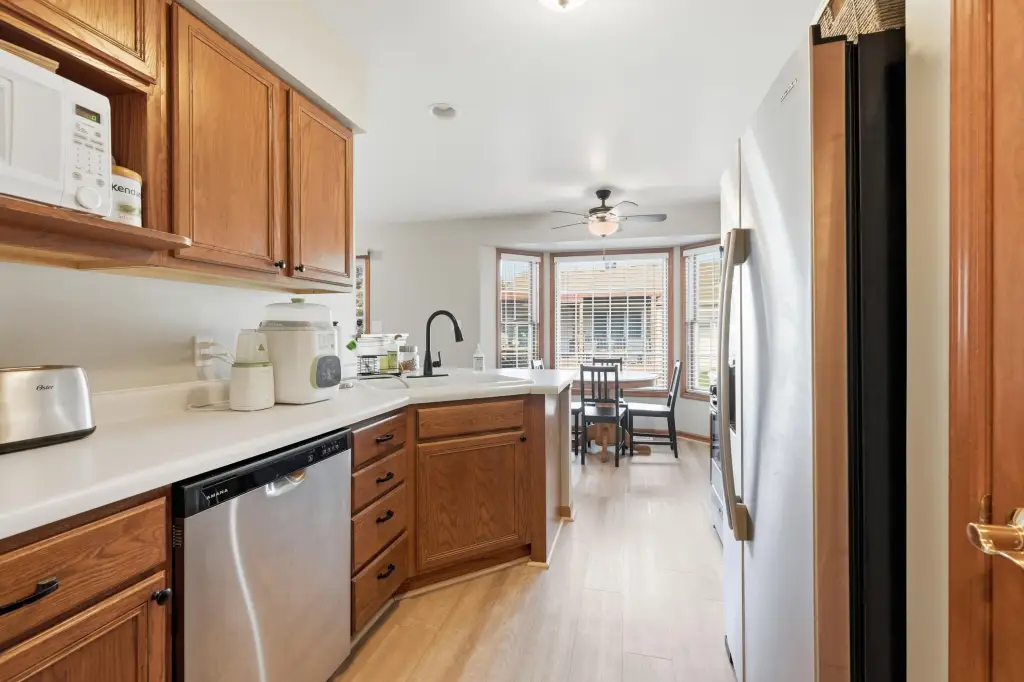
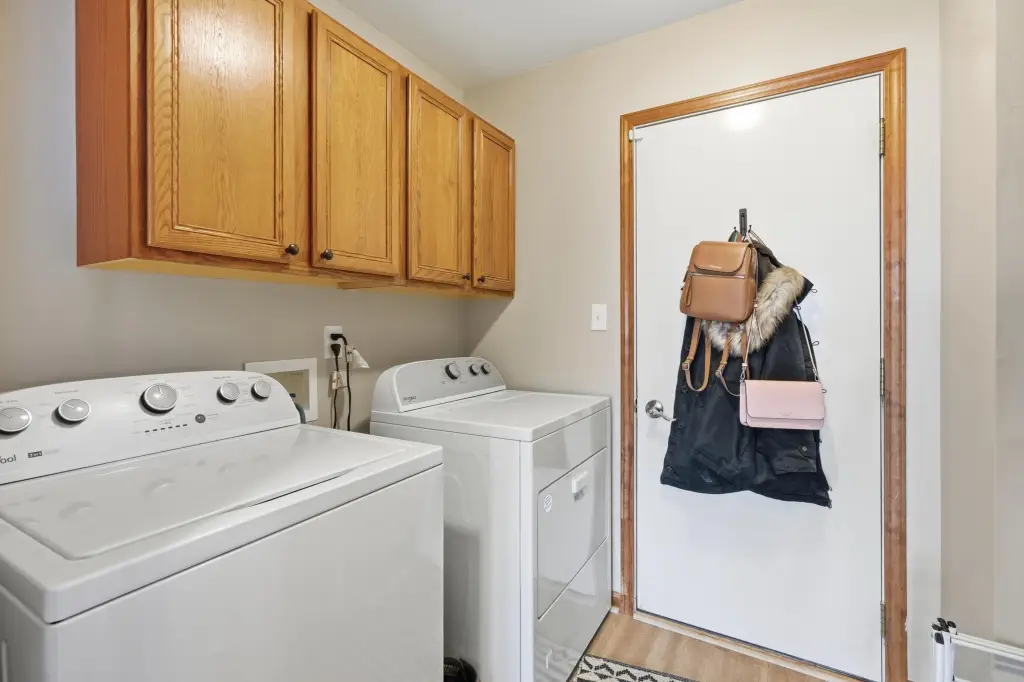
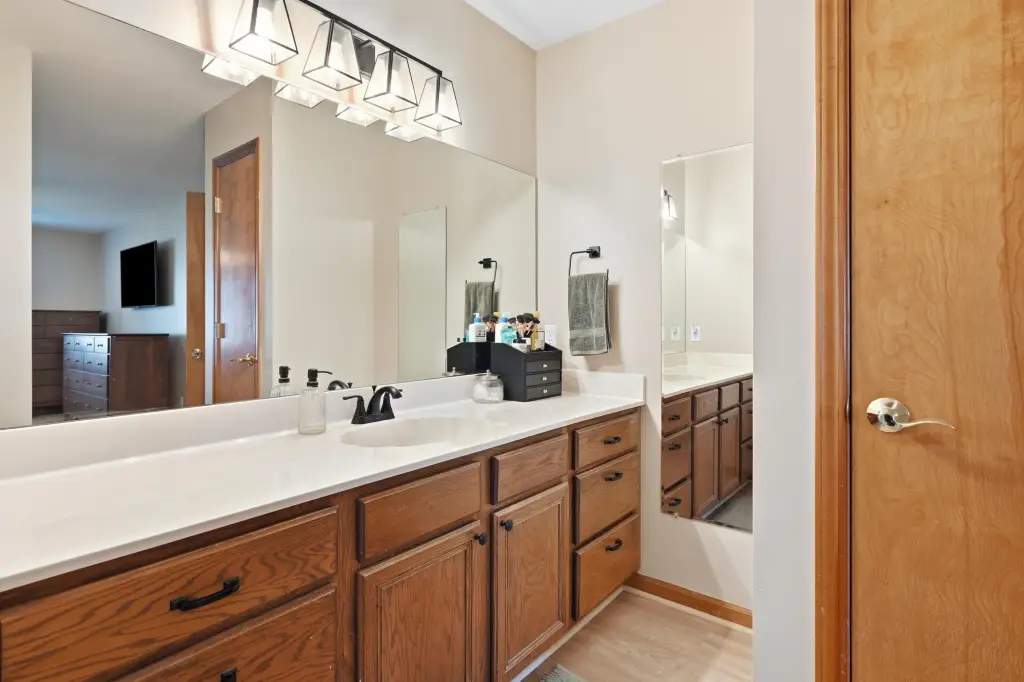
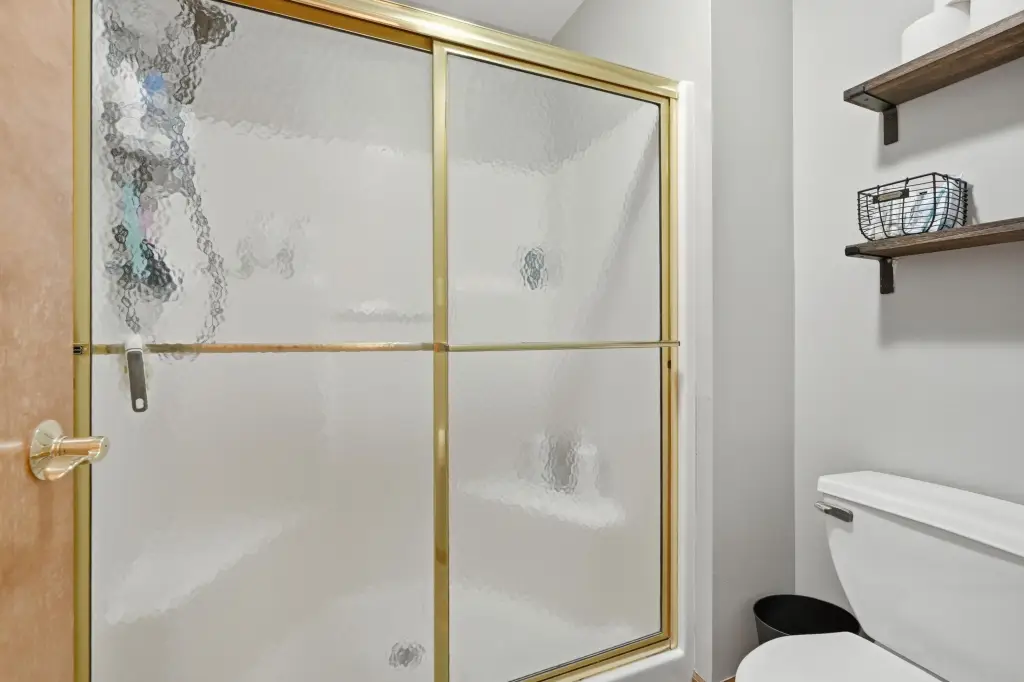
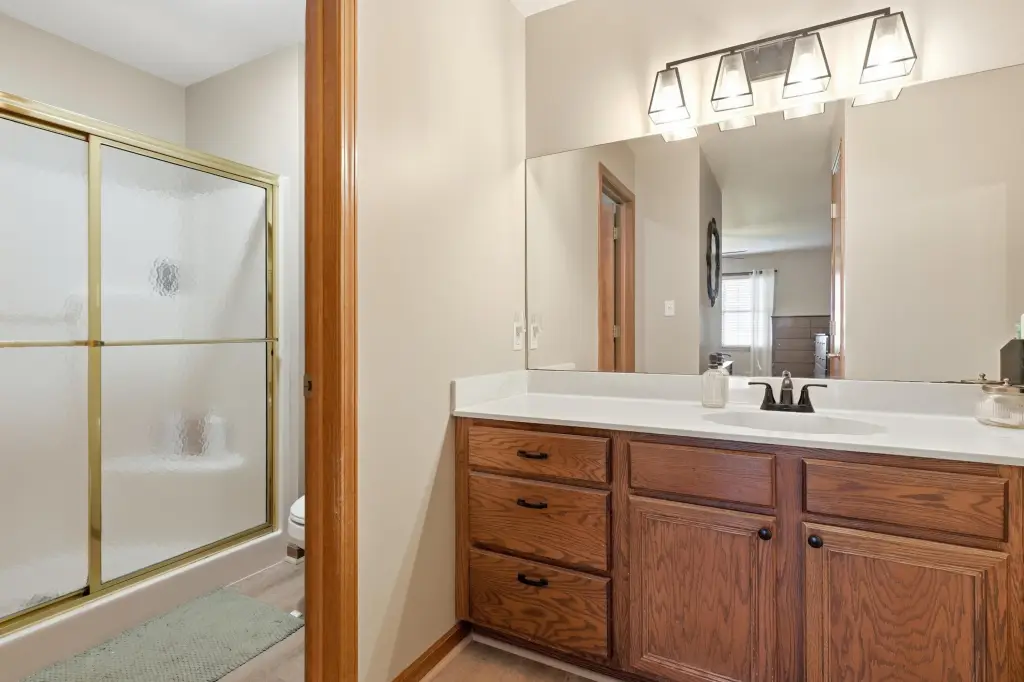
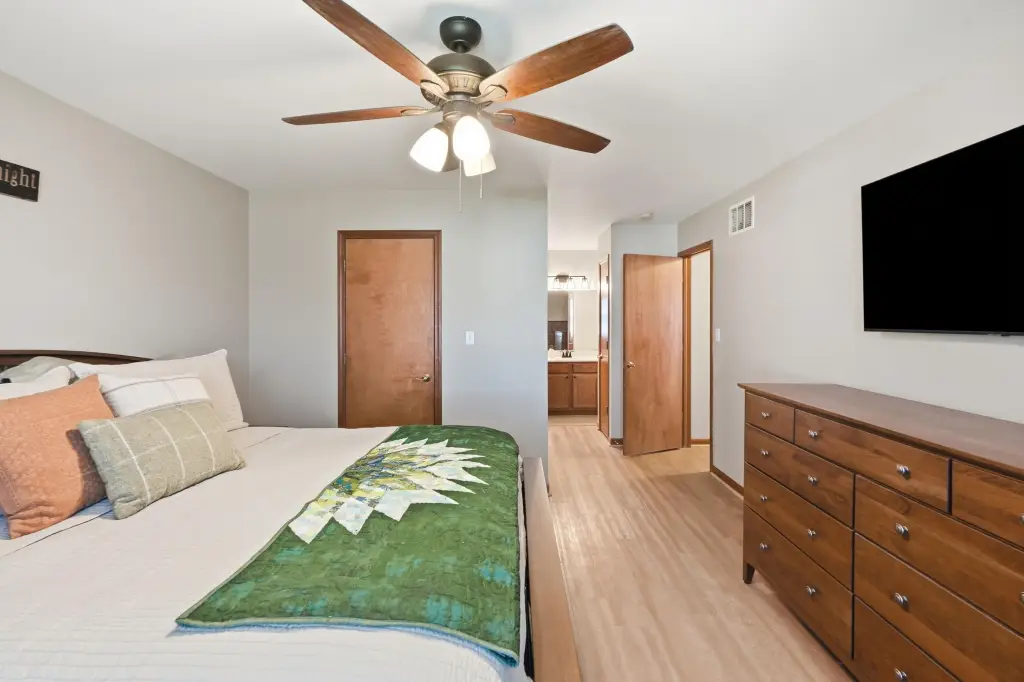
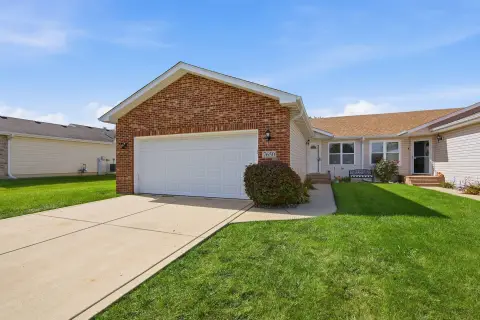
This half duplex, built in 2000, provides 1,253 square feet with two bedrooms, two full bathrooms, a dining room, laundry room, and an eat-in kitchen. Interior features include ceiling fans, forced-air heating, and a recently updated floor reported as one year old. The kitchen includes a built-in gas range, microwave, dishwasher, refrigerator, washer, and dryer; the refrigerator located in the garage is excluded. The home also has an attached garage, driveway parking, rain gutters, and a rear deck.
The property is located in Merrillville, Indiana, near major highways, shopping, dining, and everyday amenities. Public water and public sewer serve the residence, and cable service is available. The seller is in the process of installing a new roof. No HOA is reported.
The property is located in Merrillville, Indiana, near major highways, shopping, dining, and everyday amenities. Public water and public sewer serve the residence, and cable service is available. The seller is in the process of installing a new roof. No HOA is reported.
Key Highlights
- 1,253‑square‑foot half duplex with 2 bedrooms and 2 full bathrooms
- Built in 2000 with a floor reported as 1 year old
- Eat‑in kitchen with built‑in gas range and listed appliances
Financial Insights
Estimated NOI and Cap Rate
NOI / Yr
$12,457
Cap Rate
5.30%
Suggested Prices Based on Cap Rates
Cap Rate 5%
$249,140
$249.1K
Cap Rate 7%
$177,957
$178.0K
Cap Rate 9%
$138,411
$138.4K
Market Conditions
NOI Build-Up for 1,253 SF
Gross rent
$18.8K $15.00/SF
− Vacancy
−$1,000 −$0.80/SF
EGI
$17.8K $14.20/SF
− OpEx
−$5.3K −$4.26/SF
NOI
$12.5K $9.94/SF
Area
Lake County, IN
Vacancy
5.32%
Lease Rate
$15.00 /SF/Yr
Expense Ratio
30.00%
Simulate Cap Rate and NOI
Suggested Prices Based on Cap Rates
Cap Rate 5%
$249,140
Cap Rate 7%
$177,957
Cap Rate 9%
$138,411
Alternative Uses
Best Use
Multifamily LT 5
$178.0K
$155.7K – $207.6K
NOI $12,457 @ 7.0% cap · market cap 5.30%
Second Best
Apartment 5plus
$158.4K
$138.6K – $184.8K
NOI $11,086 @ 7.0% cap · market cap 4.72%
Theoretical Best
Specialty Retail
$349.8K
$306.1K – $408.1K
NOI $24,485 @ 7.0% cap · market cap 10.42%
Zoning and permitted uses should be independently verified with authorities.
Property Analytics
Unlock full access to Insights
Subscribe to Realmo Intelligence
Open Analytics
Current Use
Lease Details
Yes
Highway access
Location Intelligence
Trade Area within ½ mile
1,466
Businesses Nearby
Explore this area
Business Placement
Demographics for 46410, IN
39,471
Population
17,685
Households
2.2
Avg Household Size
39
Median Age
24%
College-Educated
93%
High-School Grad
30.1 sq mi
ZIP Area
1,311
Density / Sq Mi
$61,735
Median Household Income
$42,235
Median Earnings
$1,267
Median Rent
$192,100
Median Home Value
Check the figures for this property
Cap Rate, Value Estimation, Potential NOI and more
View Realmo Analytics
Market
Vacancy Rate% for Multifamily in Midwest region

Questions? Ask Rey
Realmo’s AI knows this listing — price, zoning, demand, history. Ask anything.



Frequently Asked Questions
What type of property is this?
Duplex - Half-duplex residence with an eat-in kitchen, attached garage, and no HOA restrictions.
Where is this duplex located?
The property is located at 8781 Monroe Street Merrillville, IN.
What is the asking price?
The asking price for this property is $234,900.
What are key features of this property?
This property features: 1,253‑square‑foot half duplex with 2 bedrooms and 2 full bathrooms; Built in 2000 with a floor reported as 1 year old; Eat‑in kitchen with built‑in gas range and listed appliances



