Medical Office Building with
For Sale
Contact for pricing
872 Ohio Pike, Cincinnati, OH 45245
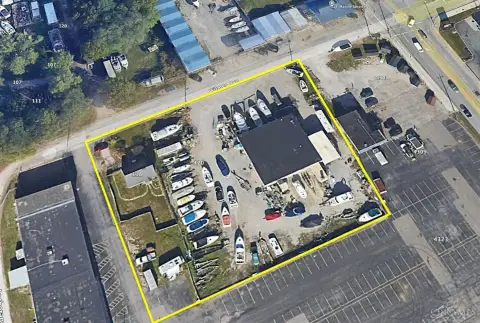
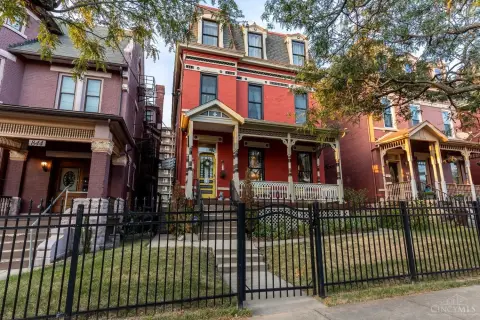
Well-lit parking for 50+ cars and a medical-ready building with prominent frontage on a major throughfare.
Property Size5,954 SF
Lot Size2.87 Acres
Price / SF$159.39
Days on Market334
Property Features for 872 Ohio Pike
General Information
Standard status
Active
Size
5,954 SF
Lot size
2.87 Acres
Property subtype
OFFICE
Site & Location
Traffic Count
45,000 vehicles/day
Highway Access
Yes
Road Access
Yes
Amenities
large backlit pylon sign
Listing Agency:
J. A. Trautmann Realtors
(513) 752-5000
Listed By:
Ben Trautmann
(513) 315-8629
Source:
Moodyscre
Added: Nov 25, 2025
Changed: Oct 13
Last Checked: Oct 24 at 7:33PM
Displayed information is deemed reliable but is not guaranteed and should be independently verified. All listing content including descriptions, pricing, images are the copyrighted material of J. A. Trautmann Realtors

Ask AI about this property
Review the available facts, identify missing information and prepare questions for the agent.
Investment Insights
Based on property information with market context.
This medical office building offers 5,954 square feet designed for turnkey medical services. The site is built around a well-lit parking area with capacity for 50+ stalls, providing room to support the existing building as well as potential future development through expansion or a second structure. The property also features large, backlit pylon signage and approximately 500 feet of frontage on a major throughfare.
The frontage benefits from exposure on a road carrying 45,000+ ADT, and the property is located about 1.2 miles from I-275 and under 2 miles from numerous amenities.
The building layout is intended for healthcare use, with the option to retrofit for other purposes if needed.
The frontage benefits from exposure on a road carrying 45,000+ ADT, and the property is located about 1.2 miles from I-275 and under 2 miles from numerous amenities.
The building layout is intended for healthcare use, with the option to retrofit for other purposes if needed.
Key Highlights
- 5,954 SF medical building on 2.87 acres with parking for 50+ vehicles.
- 500' frontage on a major throughfare with 45,000+ ADT and a large, backlit pylon sign.
- Well‑lit parking area designed to support current use and future development.
Financial Insights
Estimated NOI and Cap Rate
NOI / Yr
$69,019
Cap Rate
7.27%
Suggested Prices Based on Cap Rates
Cap Rate 5%
$1,380,380
$1.4M
Cap Rate 7%
$985,986
$986.0K
Cap Rate 9%
$766,878
$766.9K
Market Conditions
NOI Build-Up for 5,954 SF
Gross rent
$125.0K $21.00/SF
− Vacancy
−$10.0K −$1.68/SF
EGI
$115.0K $19.32/SF
− OpEx
−$46.0K −$7.73/SF
NOI
$69.0K $11.59/SF
Area
Cincinnati, OH
Vacancy
8.00%
Lease Rate
$21.00 /SF/Yr
Expense Ratio
40.00%
Simulate Cap Rate and NOI
Suggested Prices Based on Cap Rates
Cap Rate 5%
$1,380,380
Cap Rate 7%
$985,986
Cap Rate 9%
$766,878
Alternative Uses
Best Use
Healthcare Medical
$986.0K
$862.7K – $1.15M
NOI $69,019 @ 7.0% cap · market cap 7.27%
Second Best
—
—
no second resolved use
Theoretical Best
Office A
$1.18M
$1.04M – $1.38M
NOI $82,850 @ 7.0% cap · market cap 8.73%
Zoning and permitted uses should be independently verified with authorities.
How Realmo checks its estimates
Property Analytics
Contact the owner directly
Get the owner's phone numbers and email
Open Analytics
Current Use
Lease Details
45,000 VPD
Traffic count
Yes
Highway access
Yes
Paved road access
Location Intelligence
Trade Area within ½ mile
276
Businesses Nearby
Explore this area
Business Placement
Demographics for 45245, OH
20,249
Population
8,897
Households
2.3
Avg Household Size
43
Median Age
30%
College-Educated
92%
High-School Grad
15.8 sq mi
ZIP Area
1,282
Density / Sq Mi
$73,135
Median Household Income
$48,351
Median Earnings
$1,123
Median Rent
$259,500
Median Home Value
Check the figures for this property
Cap Rate, Value Estimation, Potential NOI and more
View Realmo Analytics





Frequently Asked Questions
What type of property is this?
Medical center - Well-lit parking for 50+ cars and a medical-ready building with prominent frontage on a major throughfare.
Where is this medical center located?
The property is located at 872 Ohio Pike Cincinnati, OH.
What is the asking price?
The asking price for this property is $949,000.
What are key features of this property?
This property features: 5,954 SF medical building on 2.87 acres with parking for 50+ vehicles.; 500' frontage on a major throughfare with 45,000+ ADT and a large, backlit pylon sign.; Well‑lit parking area designed to support current use and future development.


