Renovated
For Sale
$515,000
868 S 1100 W, Salt Lake City, UT 84104
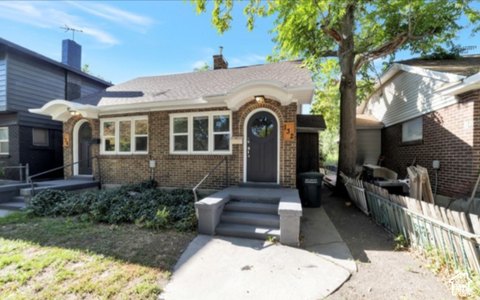
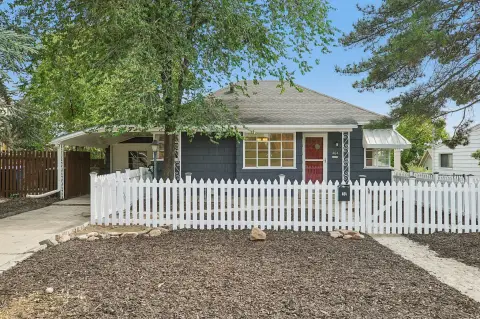
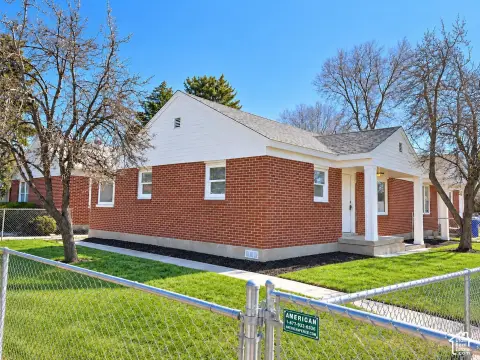
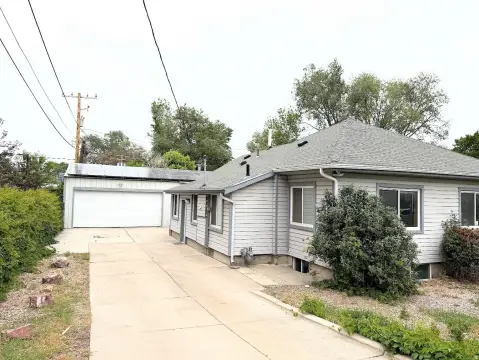
Two-unit residential property with extensive updates, separate living spaces, and convenient access to downtown Salt Lake City.
Property Size1,500 SF
Price / SF$343.33
Days on Market56
Property Features for 868 S 1100 W
General Information
Standard status
Active
Size
1,500 SF
Property subtype
Duplex
Additional Details
Multifamily Units
2
Building Details
Building Size
1,500 SF
Year Built
1902
Listing Agency:
Wasatch Back Mountain Properties
(801) 898-0697
Listed By:
Vinh F Truong
(801) 428-2800
Source:
Liftrealty
Added: Aug 13
Changed: Oct 6
Last Checked: Oct 5 at 7:22PM
Displayed information is deemed reliable but is not guaranteed and should be independently verified. All listing content including descriptions, pricing, images are the copyrighted material of Wasatch Back Mountain Properties
Investment Insights
Based on property information with market context.
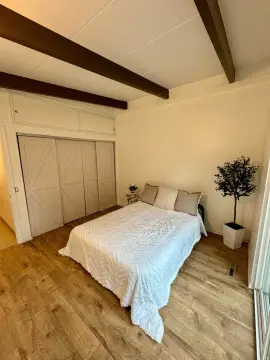
This 1,500-square-foot duplex, built in 1902, has been substantially updated while retaining its two-unit configuration. Improvements include a roof replacement completed in 2024, a new furnace and evaporative cooling coils installed in 2022, and new flooring added in 2025. The property also features updated kitchens, doors, windows, plumbing, electrical systems, stucco, paint, and insulation.
Located at 868 S 1100 W in Salt Lake City, the property is positioned minutes from downtown. Both units are described as move-in ready. Property access is limited to drive-by viewing; do not disturb occupants, knock on doors, or walk the premises. Offers are to be submitted subject to a walk-through.
Located at 868 S 1100 W in Salt Lake City, the property is positioned minutes from downtown. Both units are described as move-in ready. Property access is limited to drive-by viewing; do not disturb occupants, knock on doors, or walk the premises. Offers are to be submitted subject to a walk-through.
Key Highlights
- Two‑unit duplex with 1,500 square feet
- Roof replaced in 2024
- New furnace and evaporative cooling coils installed in 2022
Financial Insights
Estimated NOI and Cap Rate
NOI / Yr
$20,004
Cap Rate
3.88%
Suggested Prices Based on Cap Rates
Cap Rate 5%
$400,080
$400.1K
Cap Rate 7%
$285,771
$285.8K
Cap Rate 9%
$222,267
$222.3K
Market Conditions
NOI Build-Up for 1,500 SF
Gross rent
$30.2K $20.16/SF
− Vacancy
−$1.7K −$1.11/SF
EGI
$28.6K $19.05/SF
− OpEx
−$8.6K −$5.72/SF
NOI
$20.0K $13.34/SF
Area
Salt Lake City, UT
Vacancy
5.50%
Lease Rate
$20.16 /SF/Yr
Expense Ratio
30.00%
Simulate Cap Rate and NOI
Suggested Prices Based on Cap Rates
Cap Rate 5%
$400,080
Cap Rate 7%
$285,771
Cap Rate 9%
$222,267
Alternative Uses
Best Use
Multifamily LT 5
$285.8K
$250.1K – $333.4K
NOI $20,004 @ 7.0% cap · market cap 3.88%
Second Best
Apartment 5plus
$265.5K
$232.3K – $309.7K
NOI $18,583 @ 7.0% cap · market cap 3.61%
Theoretical Best
Office A
$404.1K
$353.6K – $471.5K
NOI $28,289 @ 7.0% cap · market cap 5.49%
Zoning and permitted uses should be independently verified with authorities.
Property Analytics
Unlock full access to Insights
Subscribe to Realmo Intelligence
Open Analytics
Current Use
Lease Details
2
Residential units
Location Intelligence
Trade Area within ½ mile
638
Businesses Nearby
Explore this area
Business Placement
Demographics for 84104, UT
23,487
Population
8,452
Households
2.8
Avg Household Size
31
Median Age
22%
College-Educated
78%
High-School Grad
21.6 sq mi
ZIP Area
1,087
Density / Sq Mi
$61,326
Median Household Income
$35,013
Median Earnings
$1,235
Median Rent
$318,100
Median Home Value
Check the figures for this property
Cap Rate, Value Estimation, Potential NOI and more
View Realmo Analytics
Market
Vacancy Rate% for Multifamily in West region

Questions? Ask Rey
Realmo’s AI knows this listing — price, zoning, demand, history. Ask anything.







Frequently Asked Questions
What type of property is this?
Duplex - Two-unit residential property with extensive updates, separate living spaces, and convenient access to downtown Salt Lake City.
Where is this duplex located?
The property is located at 868 S 1100 W Salt Lake City, UT.
What is the asking price?
The asking price for this property is $515,000.
What are key features of this property?
This property features: Two‑unit duplex with 1,500 square feet; Roof replaced in 2024; New furnace and evaporative cooling coils installed in 2022


