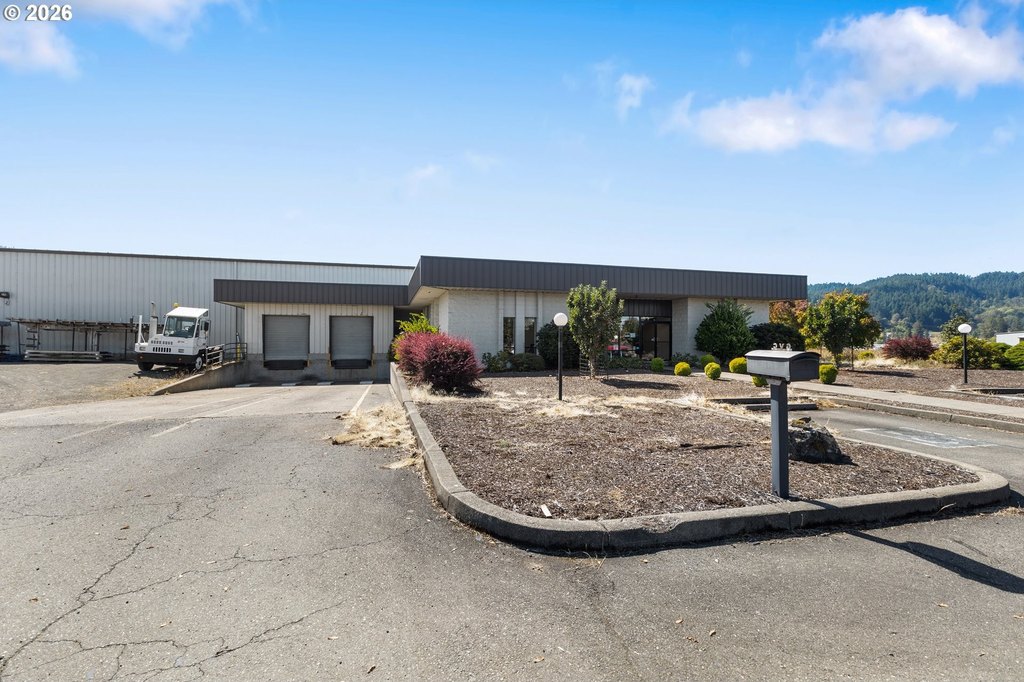
Manufacturing Facility with Cold
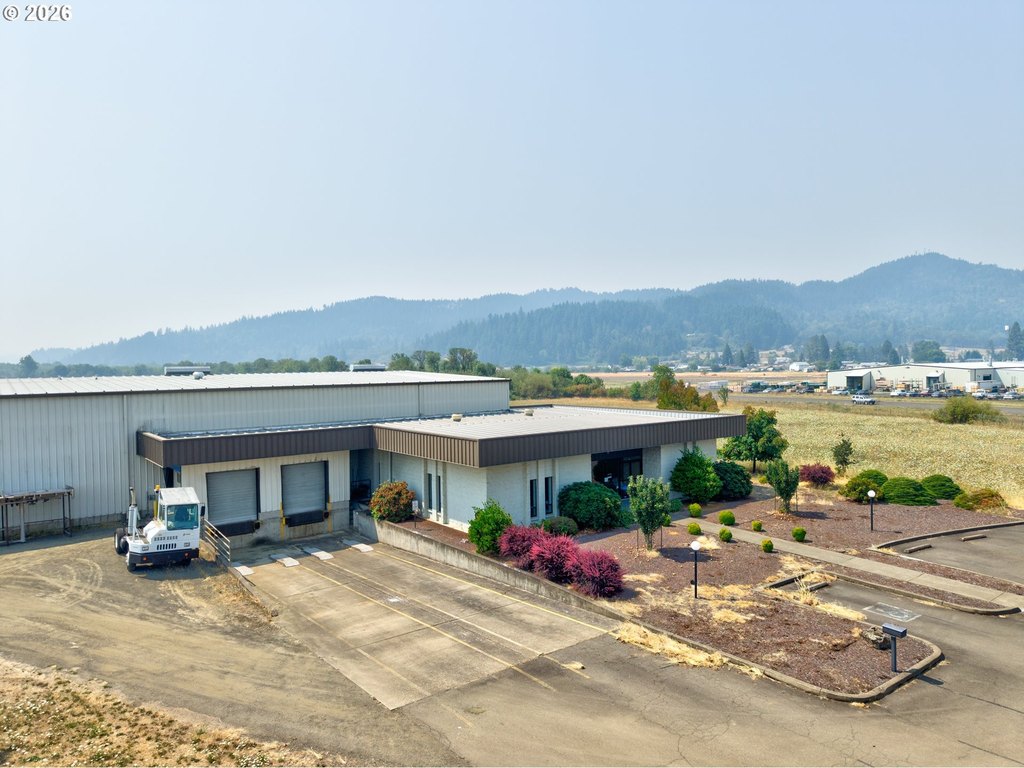
For Sale
$2,950,000
850 GARDEN VALLEY Cir, Sutherlin, OR 97479
CommercialSale, Sutherlin, OR
Property Size23,662 SF
Lot Size11.22 Acres
Price / SF$124.67
Days on Market66
Property Features for 850 GARDEN VALLEY Cir
General Information
Property type
Commercial Sale
Property subtype
Other
Zoning
M2
View
Valley, Territorial
Directions
From I-5 Exit 136, right off exit, left on Comstock, right on Taylor to property on the right
Subdivision
_256
Standard status
Active
APN
R53895
Size
23,662 SF
Lot size
11.22 Acres
Taxes and HOA fees
Tax Description
S L & W CO PLAT E, BLOCK 1, LOT PT 6 PT VAC RD LESS LEASED EQUIPM
Tax Annual Amount
13578
Legal Description
S L & W CO PLAT E, BLOCK 1, LOT PT 6 PT VAC RD LESS LEASED EQUIPM
Utilities
Heating system
Ceiling, Forced Air
Cooling system
Central Air
Amenities
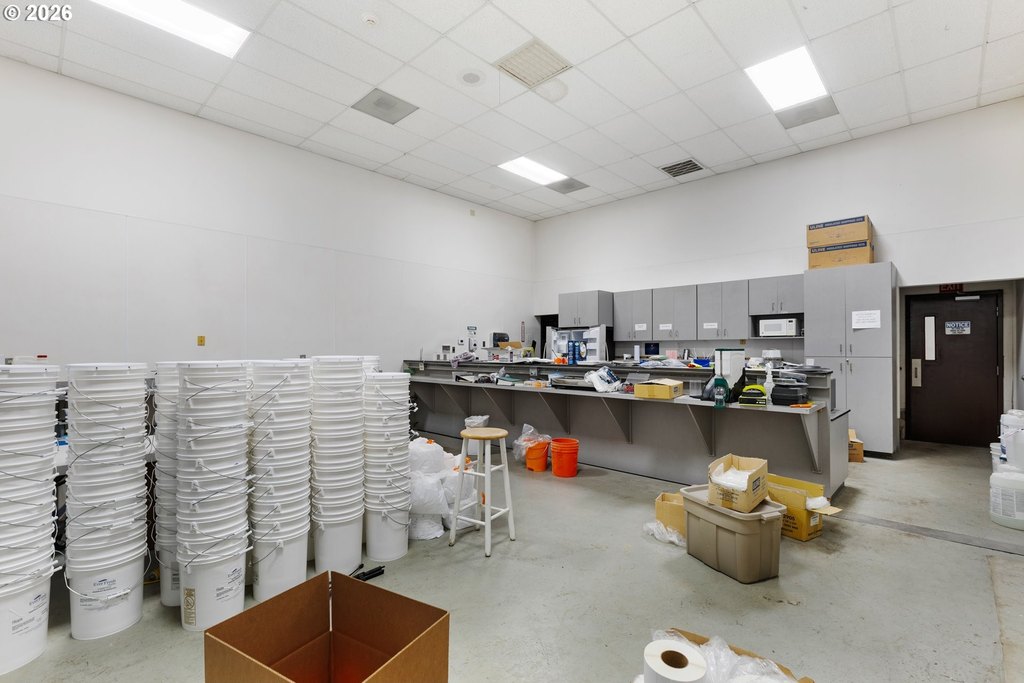
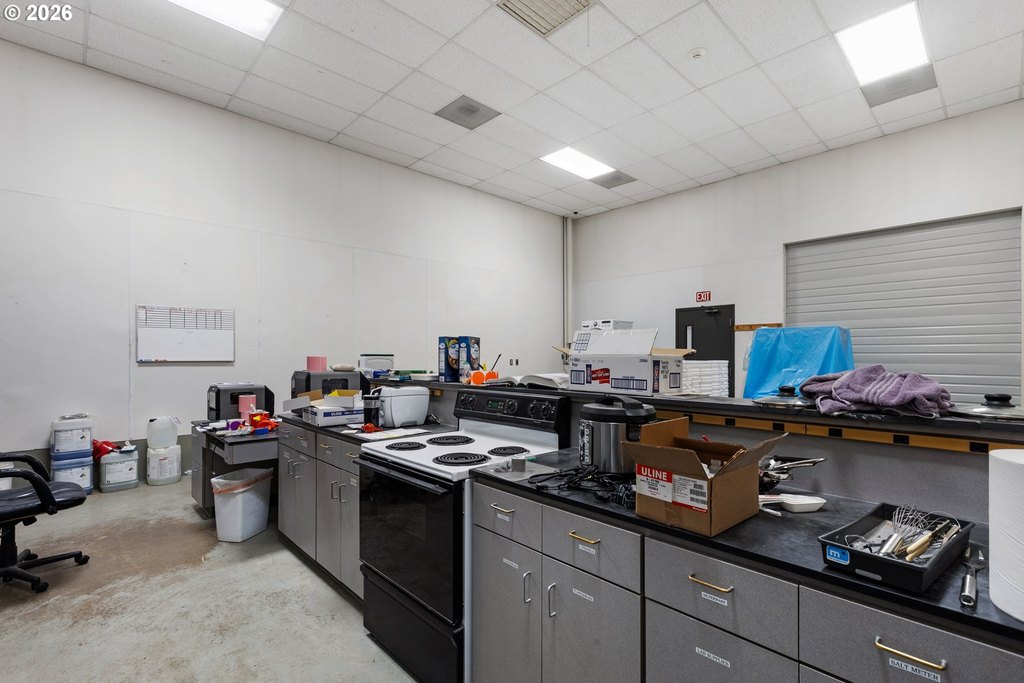
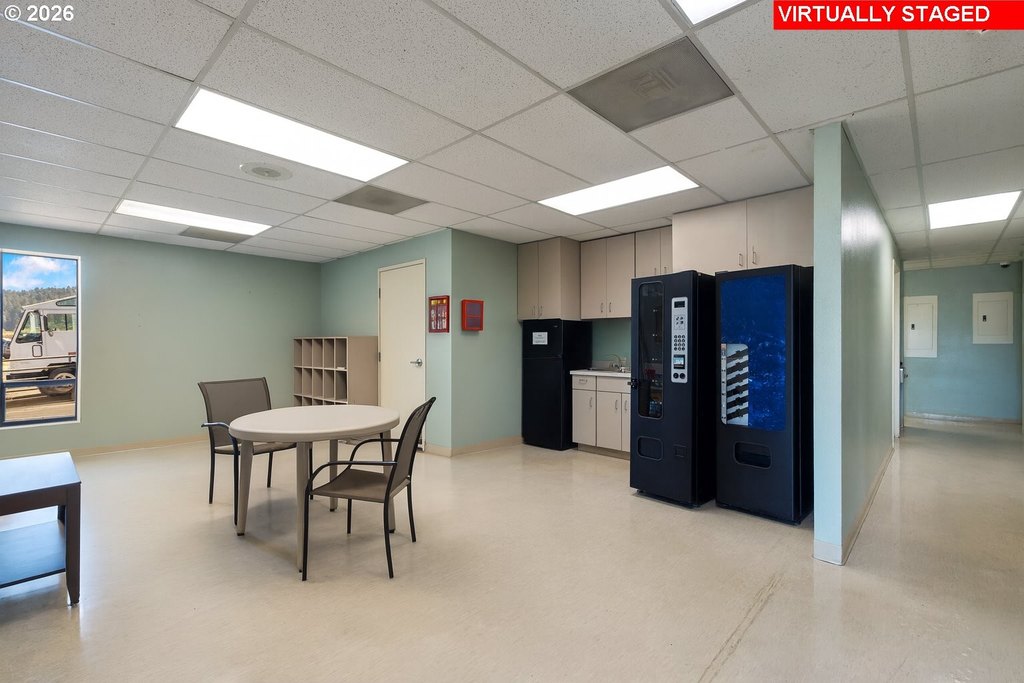
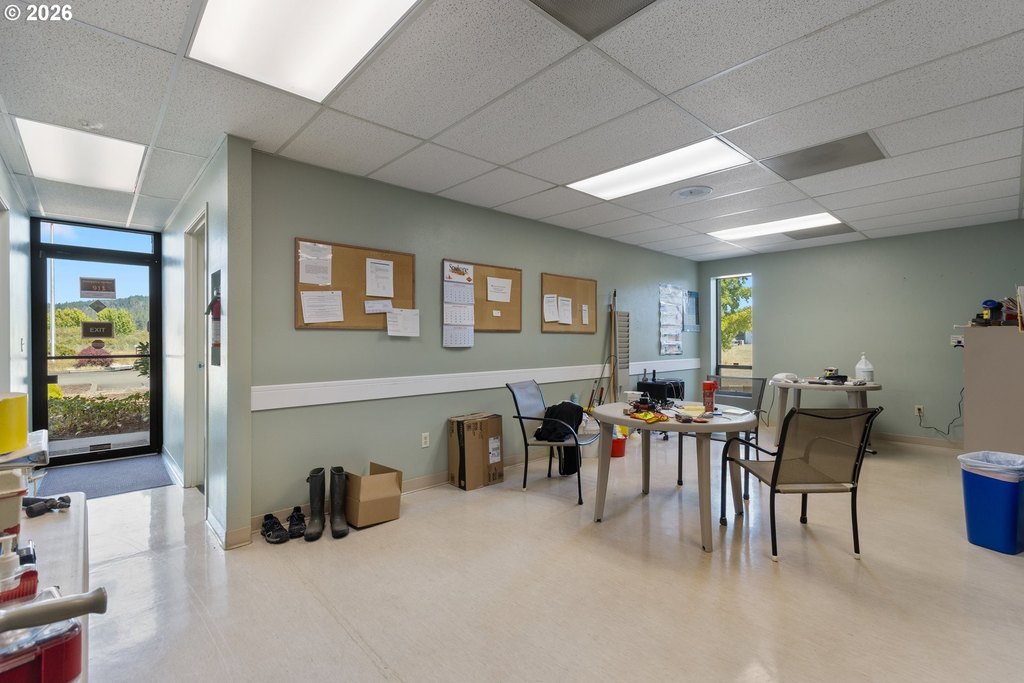
employee break room
Building Details
Year built
1995
Floors in Building
2
Building materials
MetalFrame, MetalSiding
Roof type
Metal
Listing Agency:
Keller Williams Southern Oregon-Umpqua Valley · Keller Williams Realty
(541) 529-2320
Listed By:
Mary Gilbert · License #951100030
(541) 204-4646
Added: Aug 6
Changed: Oct 8
Last Checked: Oct 10 at 6:06AM
MLS# 612551374
Copyright © 2026 Regional Multiple Listing Services. All rights reserved. All information provided by the listing agent/broker is deemed reliable but is not guaranteed and should be independently verified.
Investment Insights
Based on property information with market context.
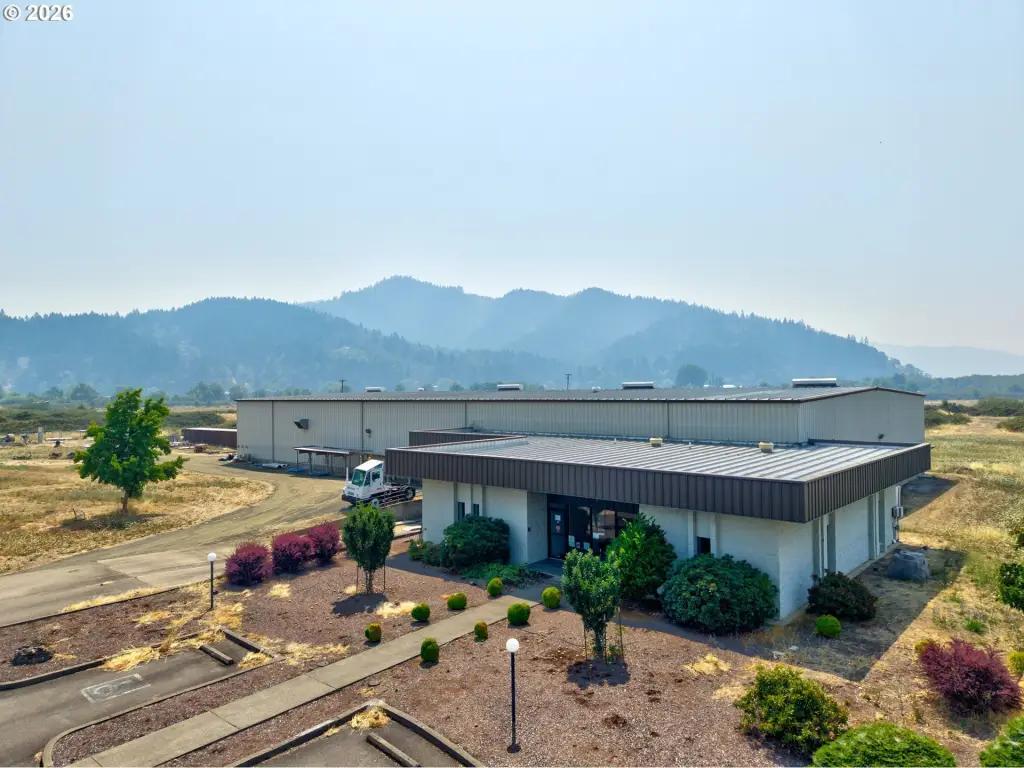
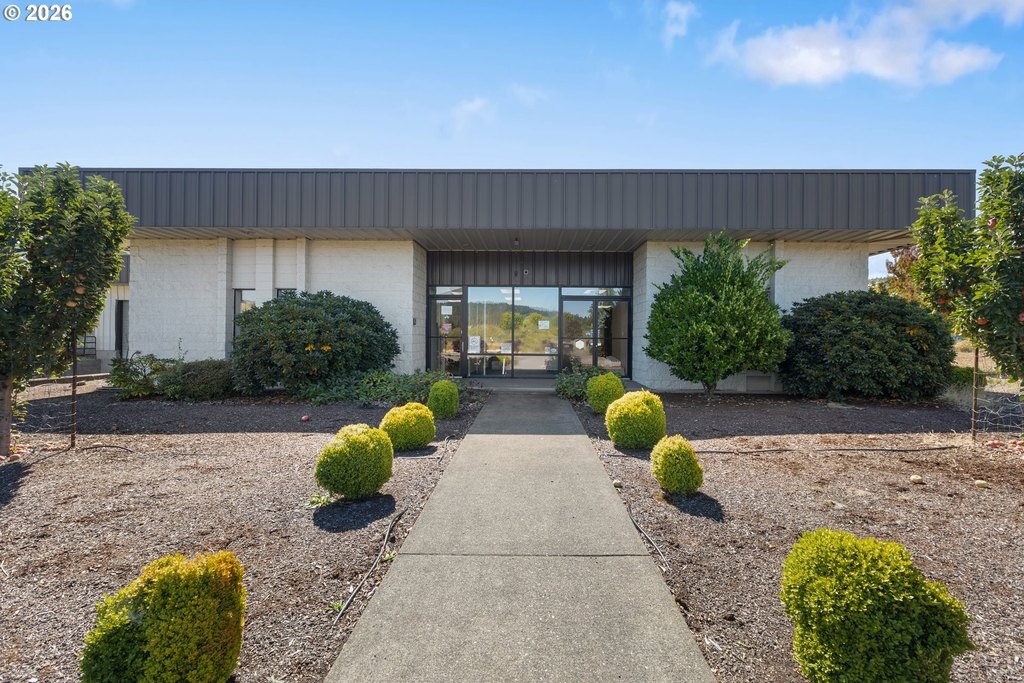
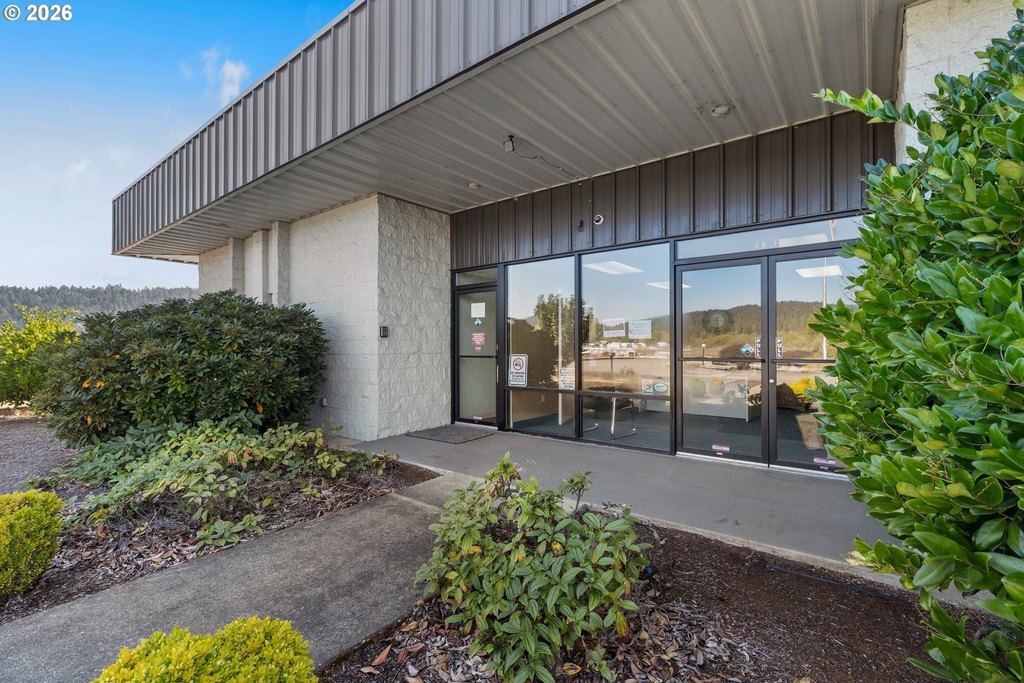
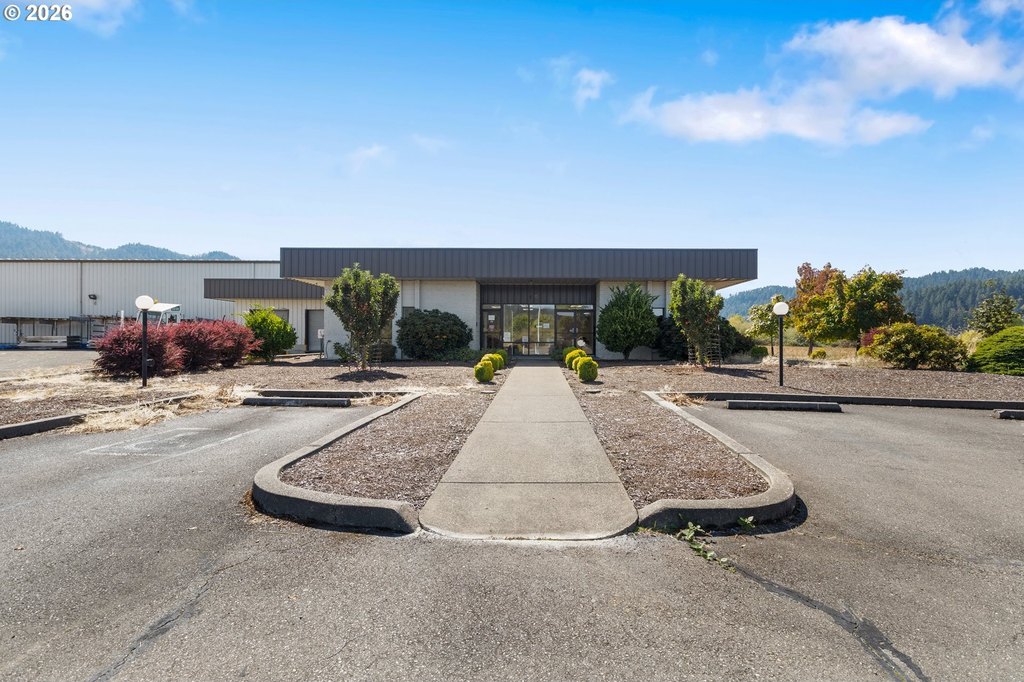
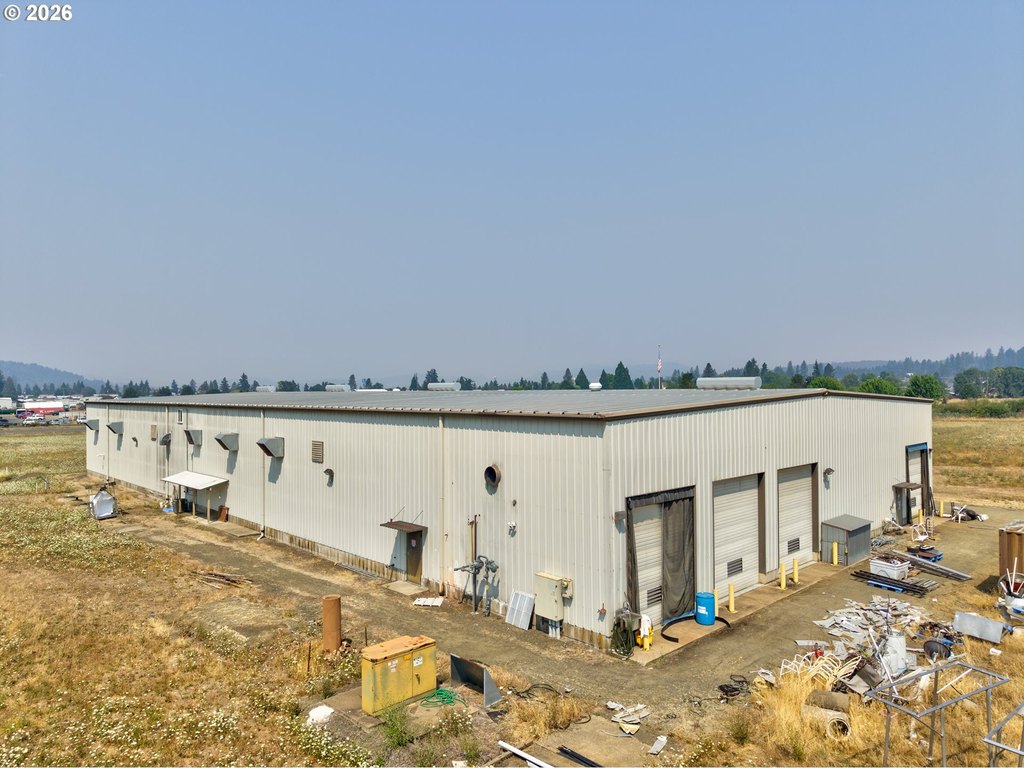
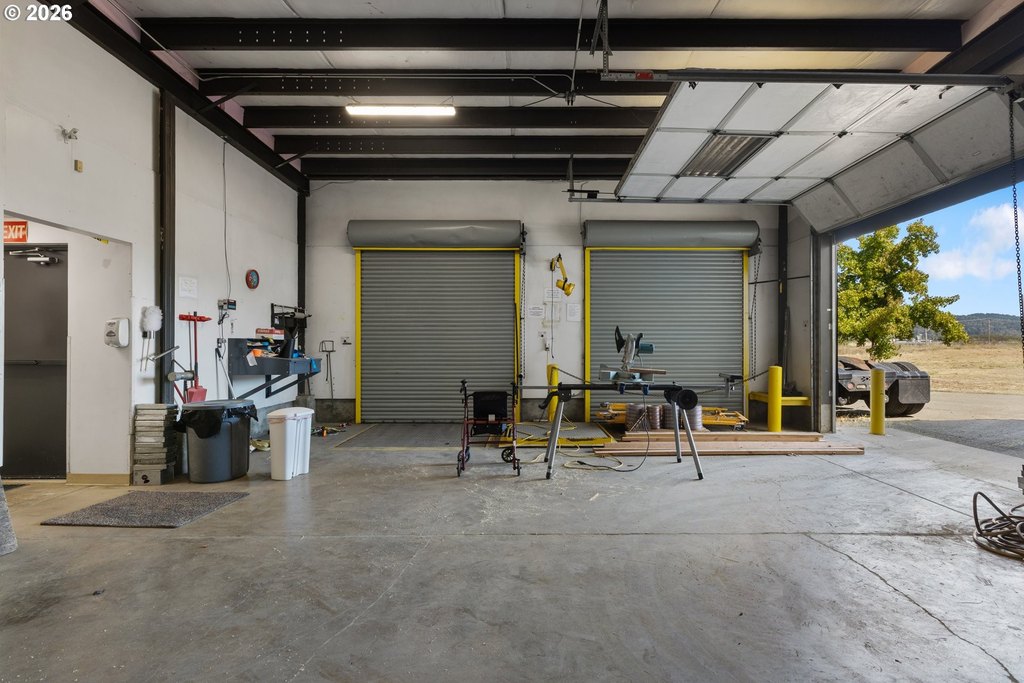
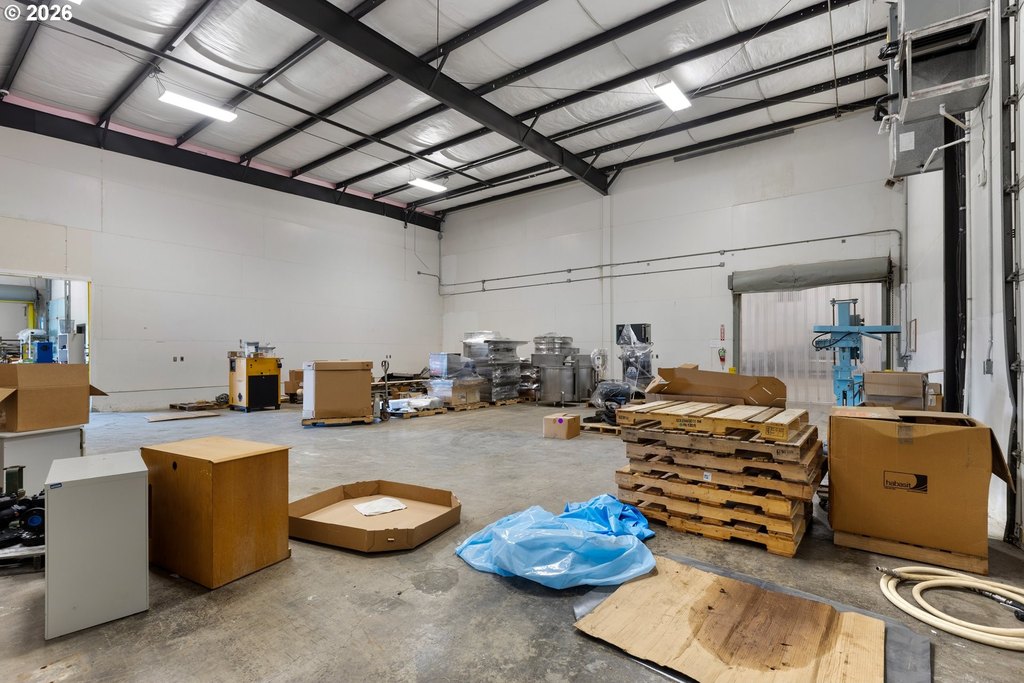
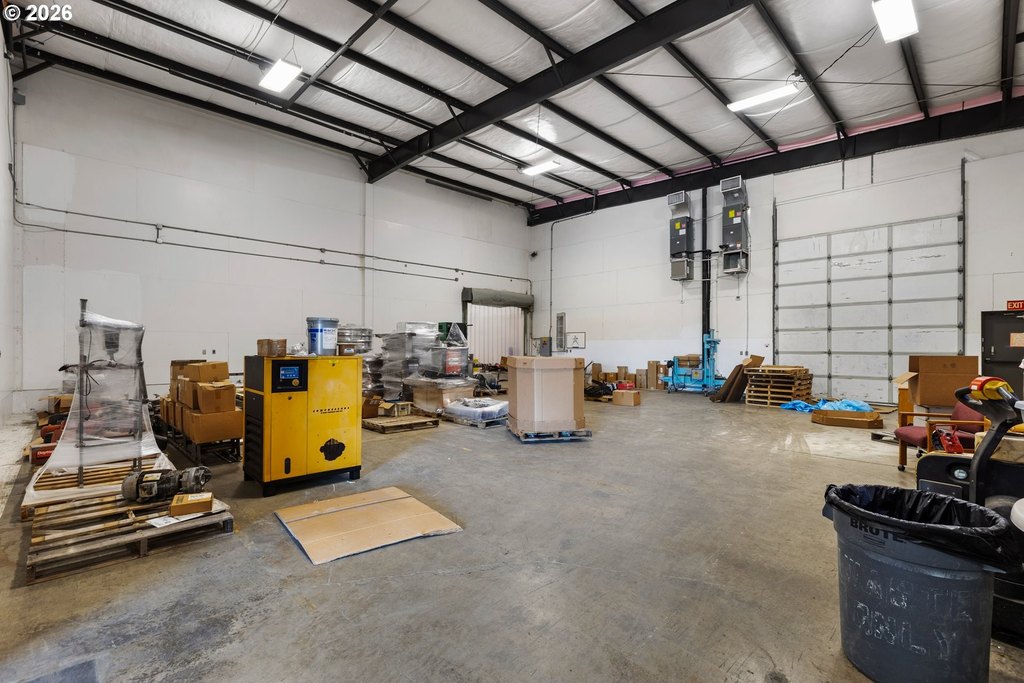
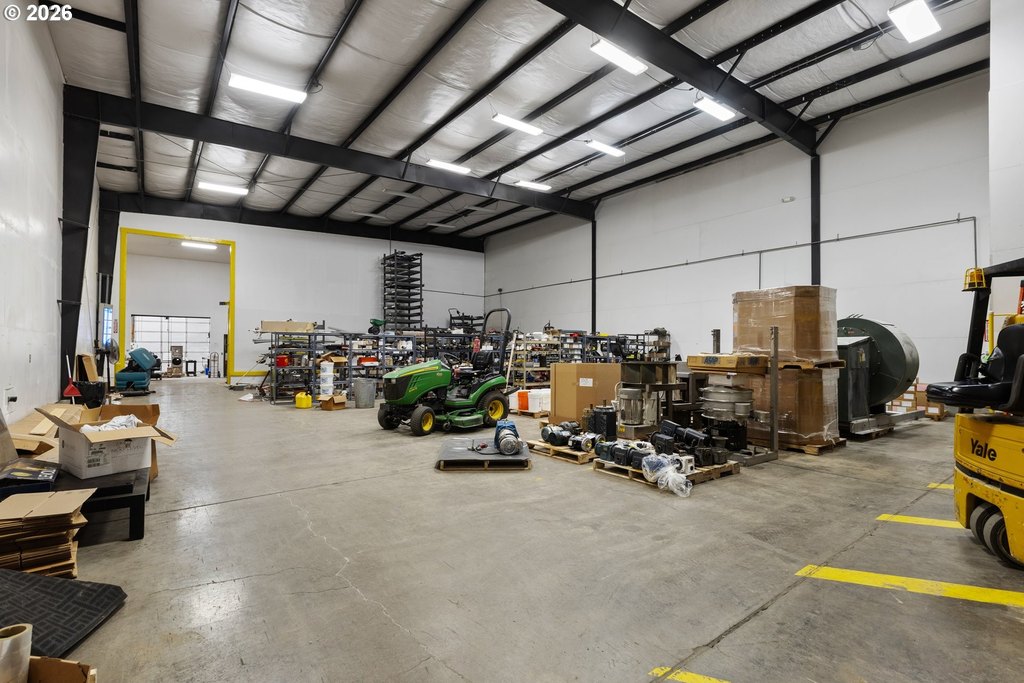
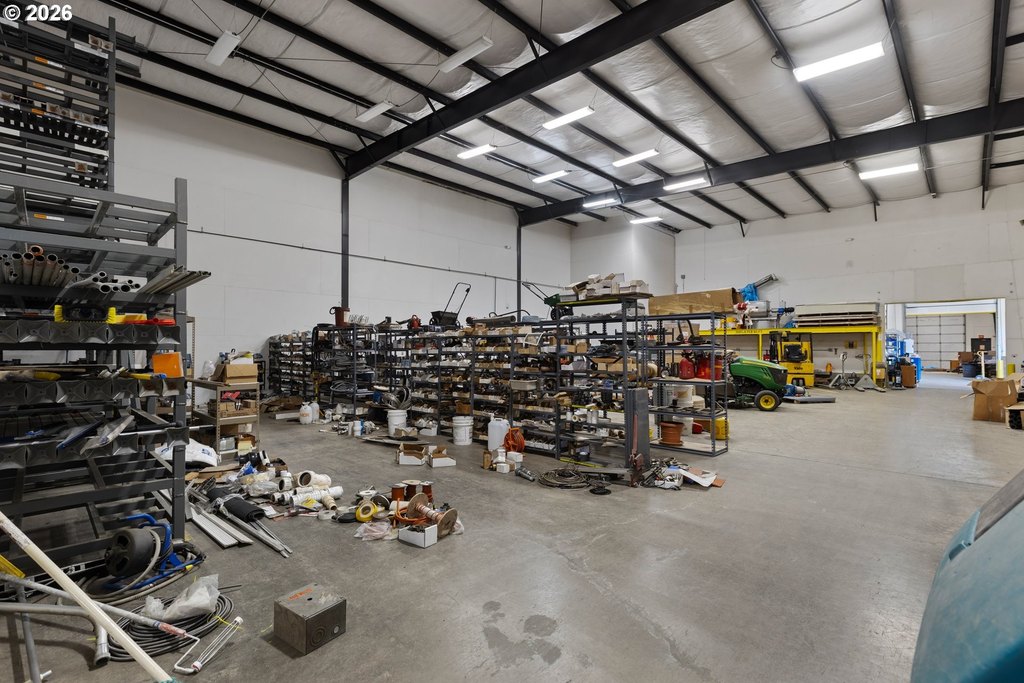
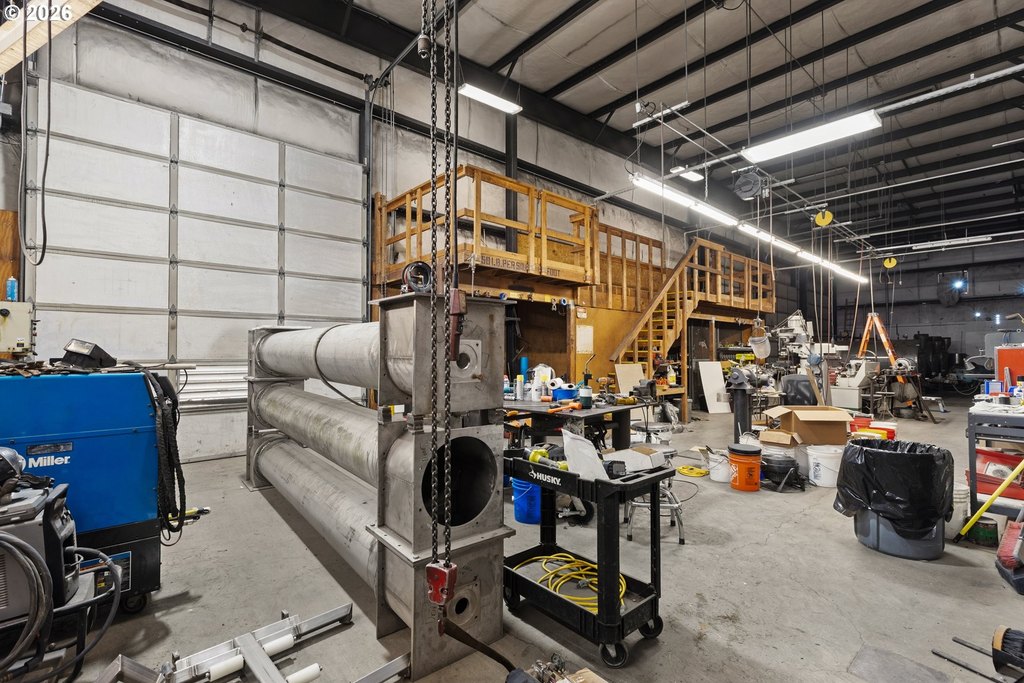
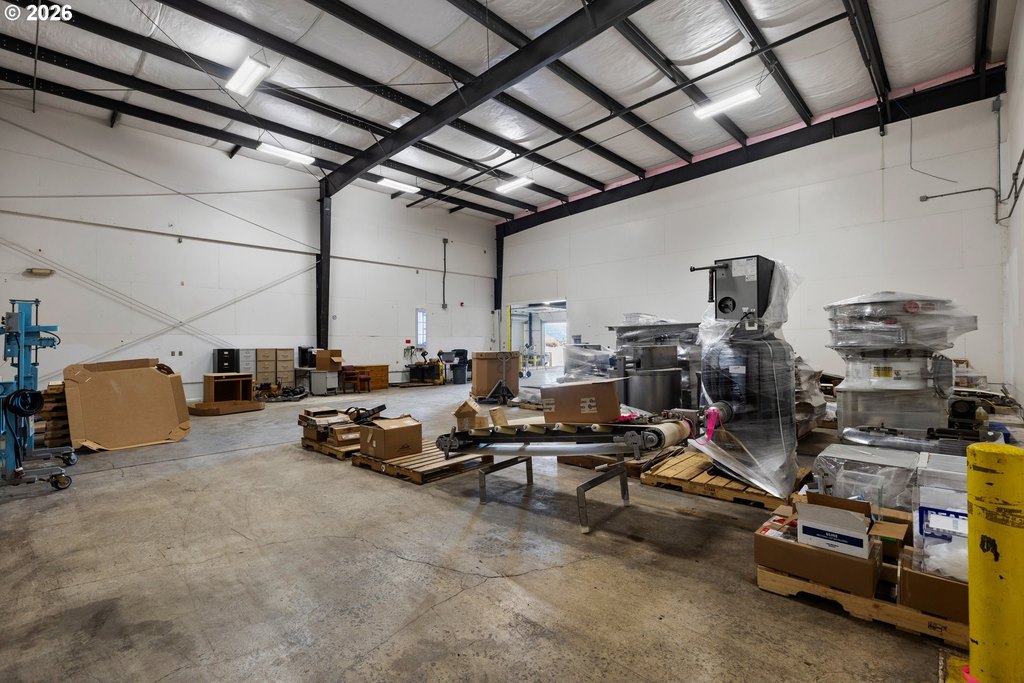
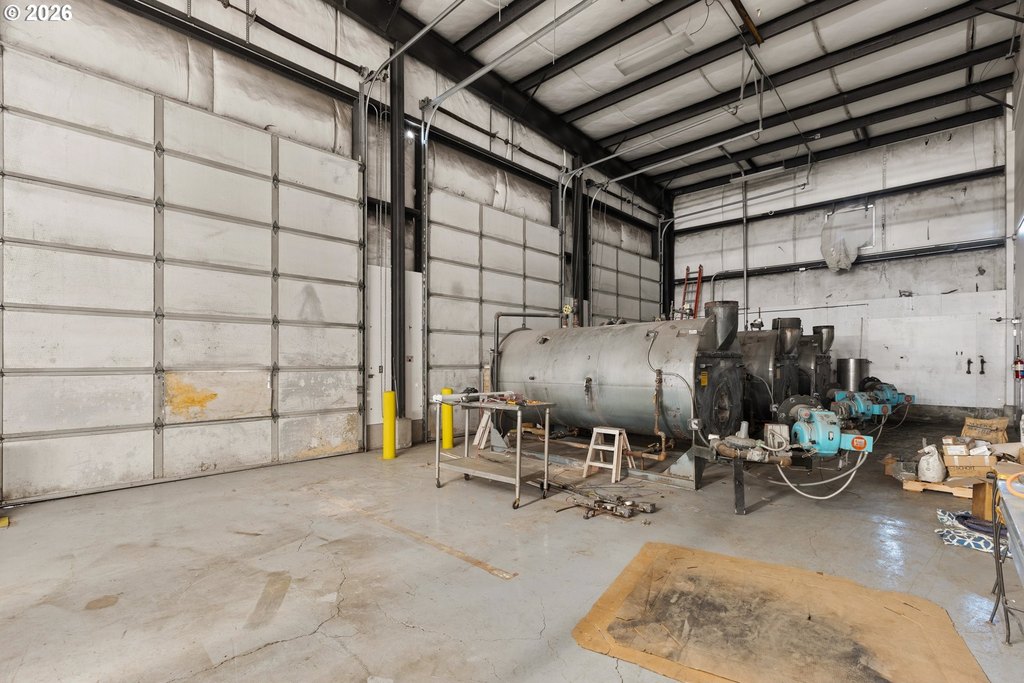
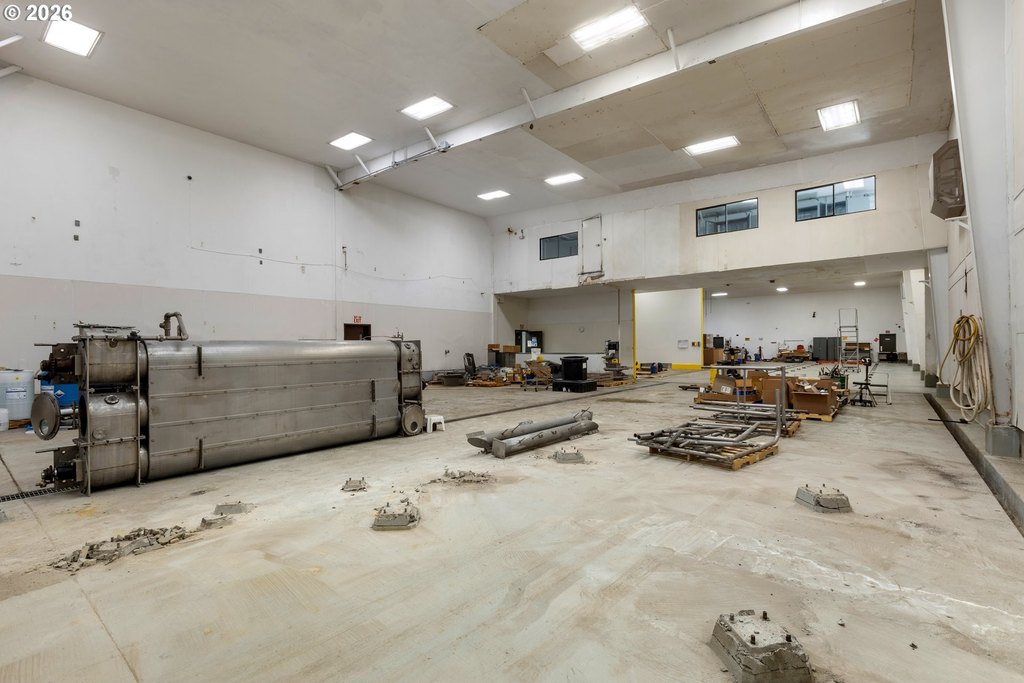
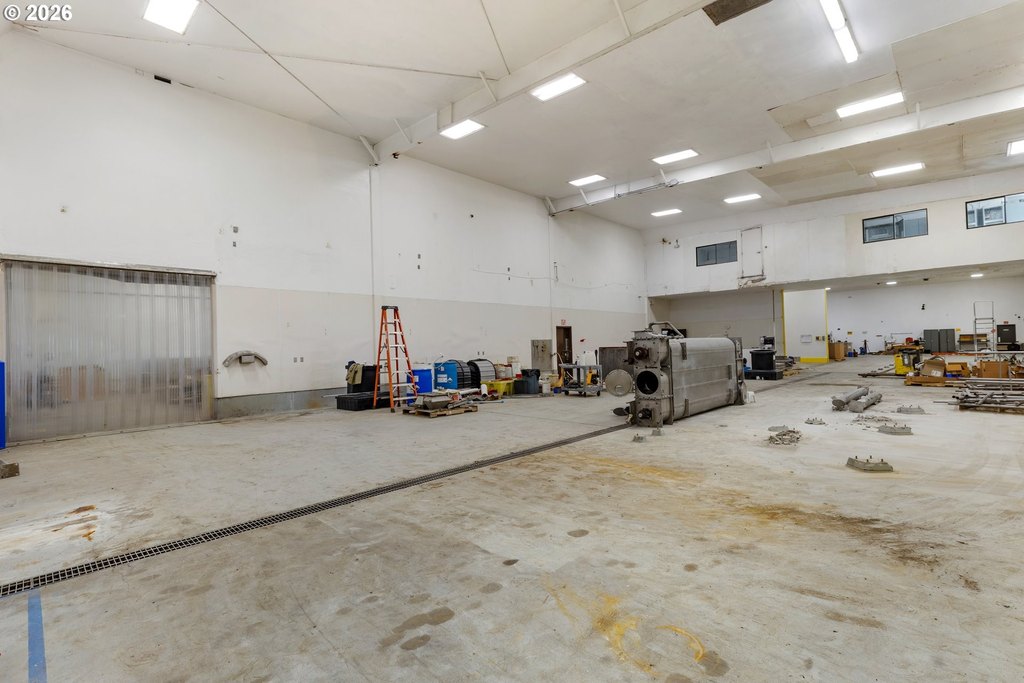
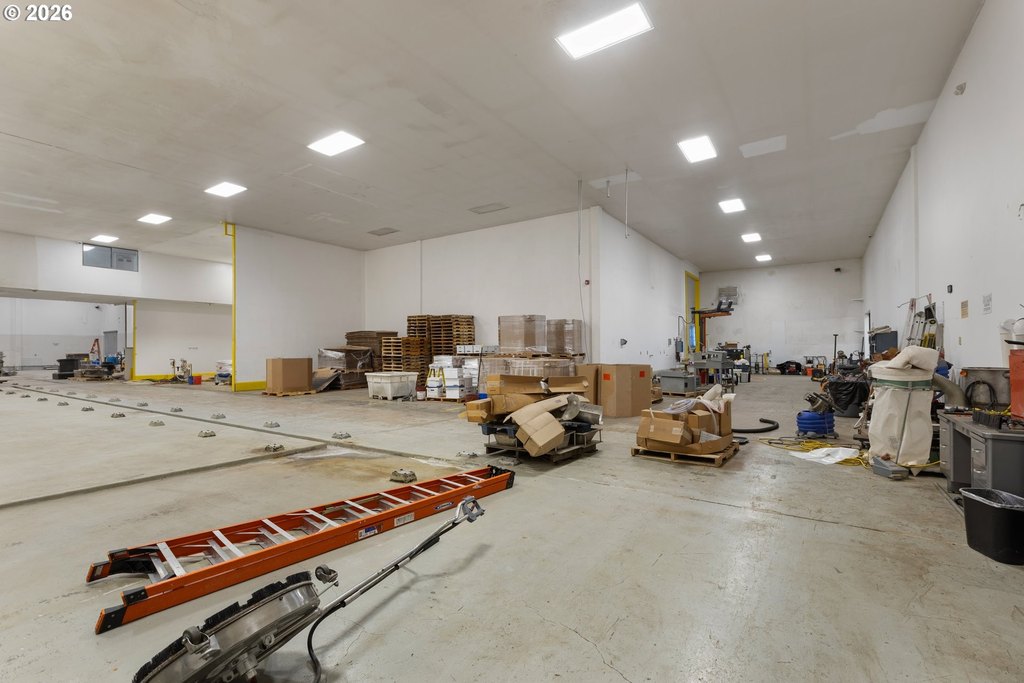
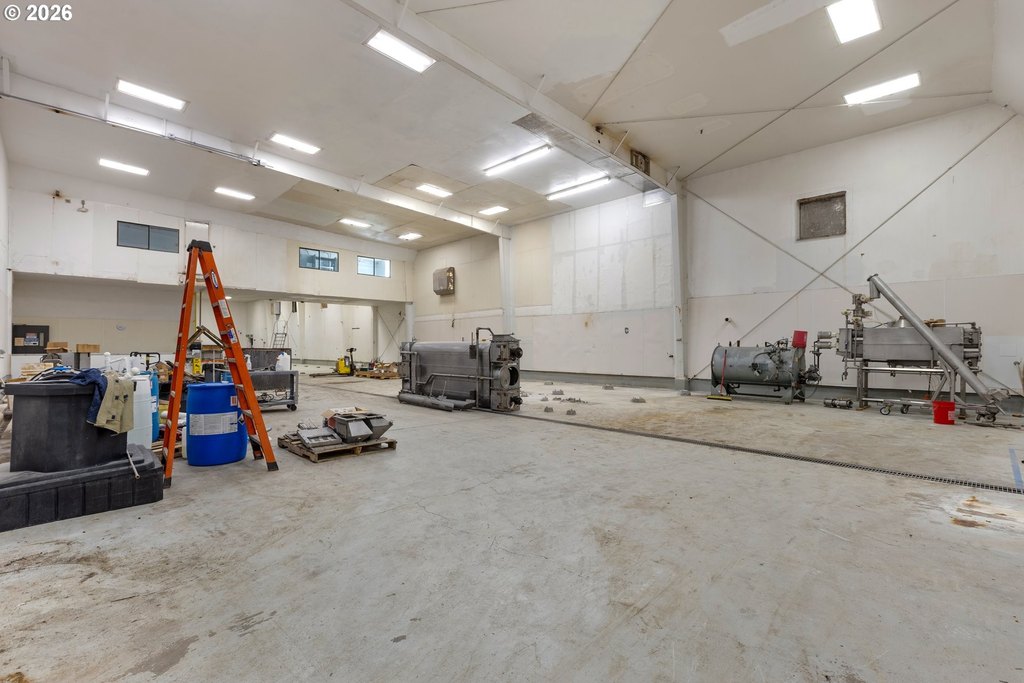
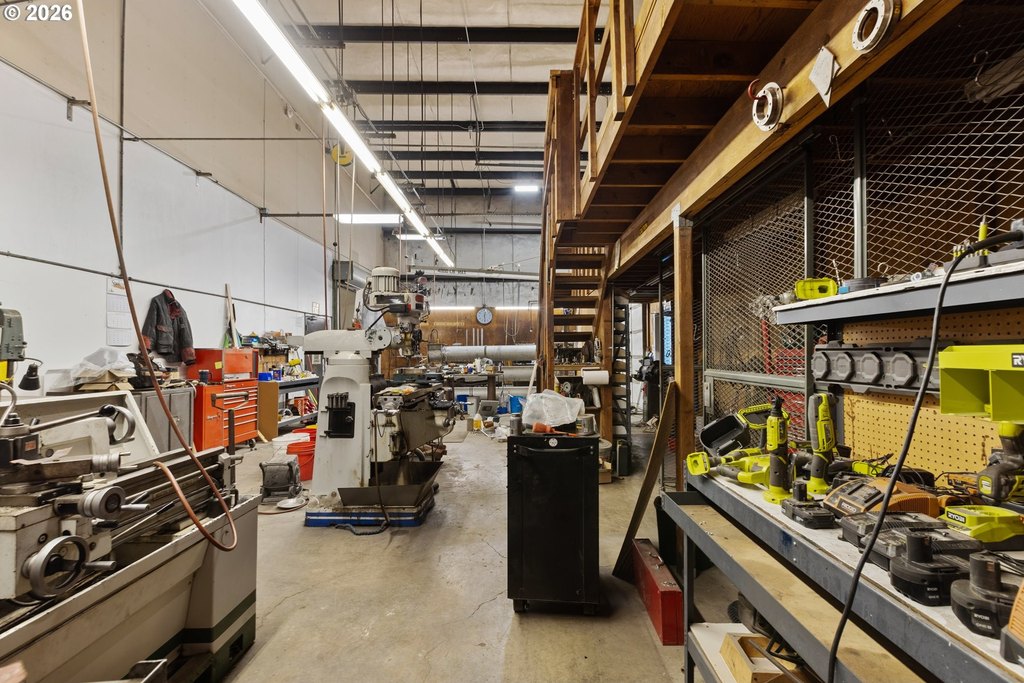
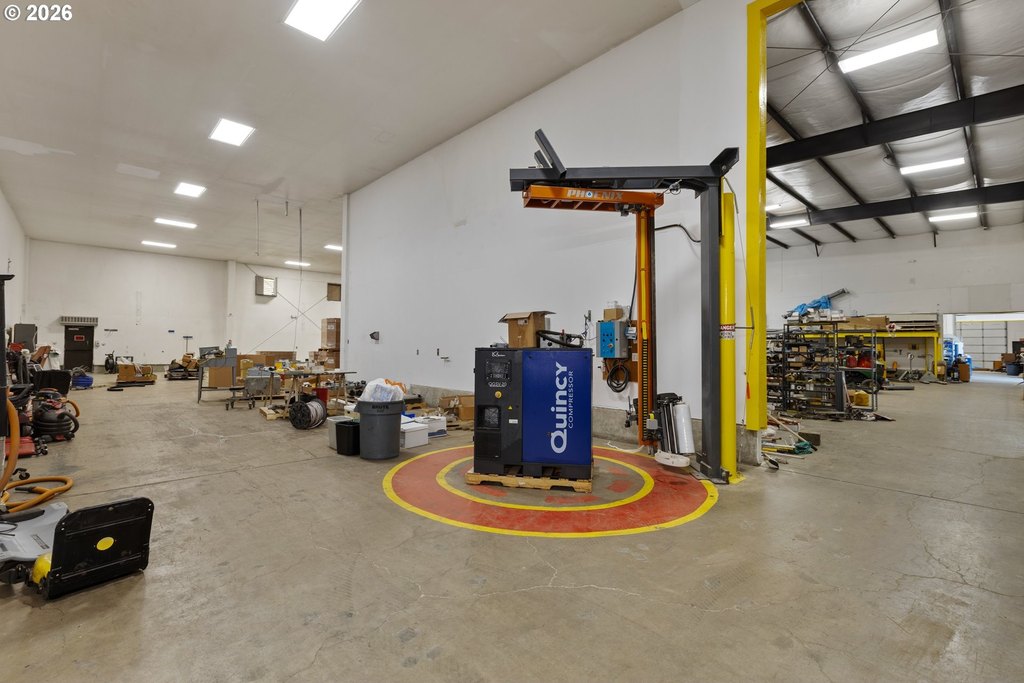
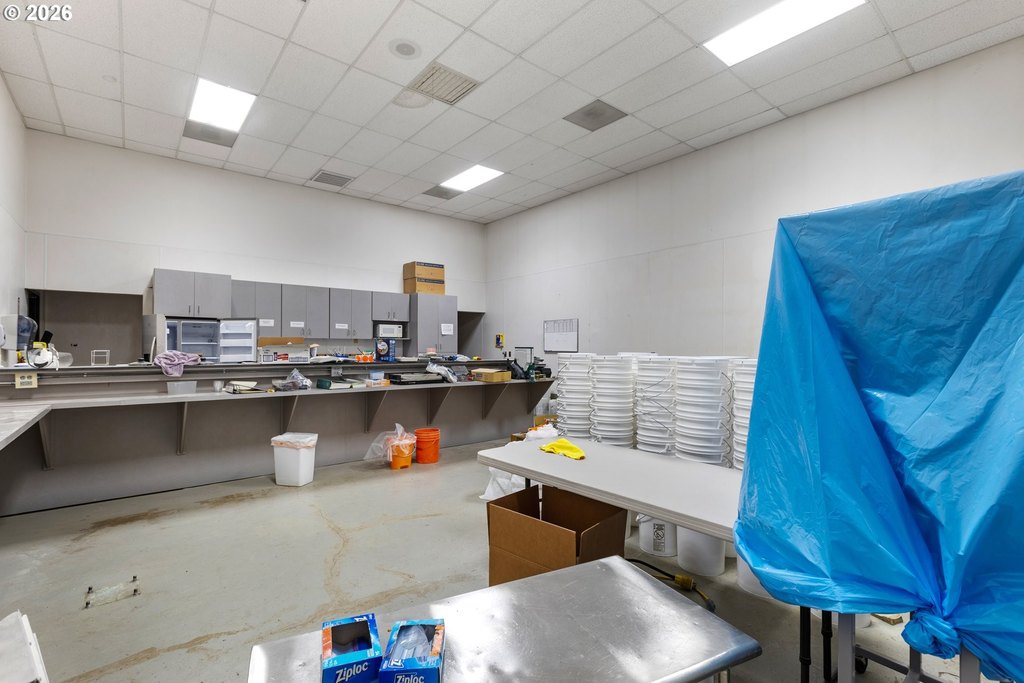
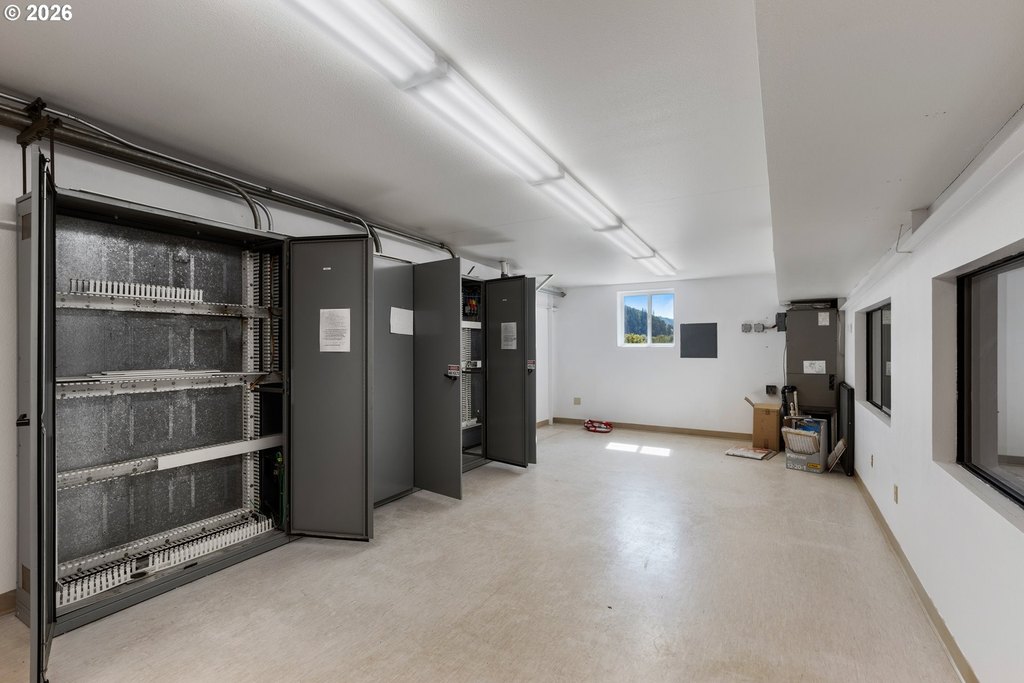
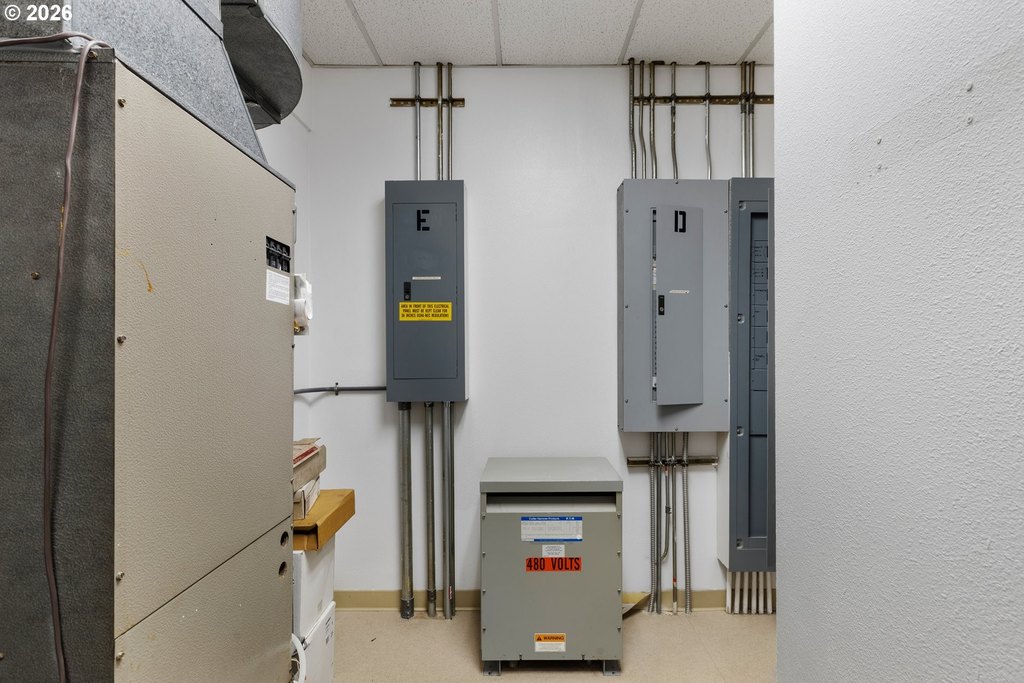
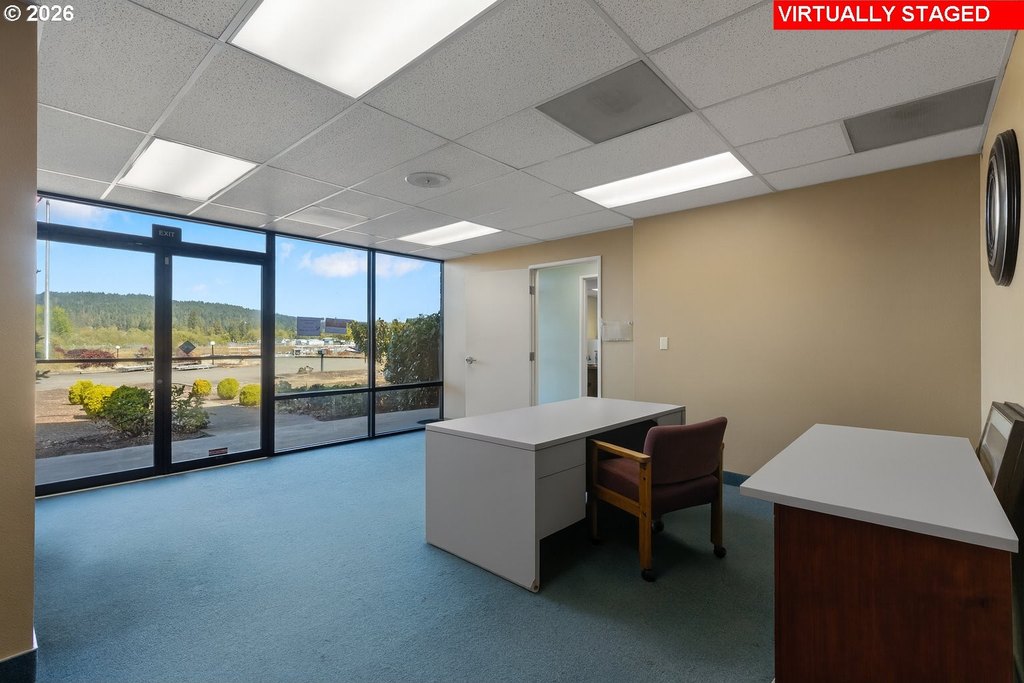
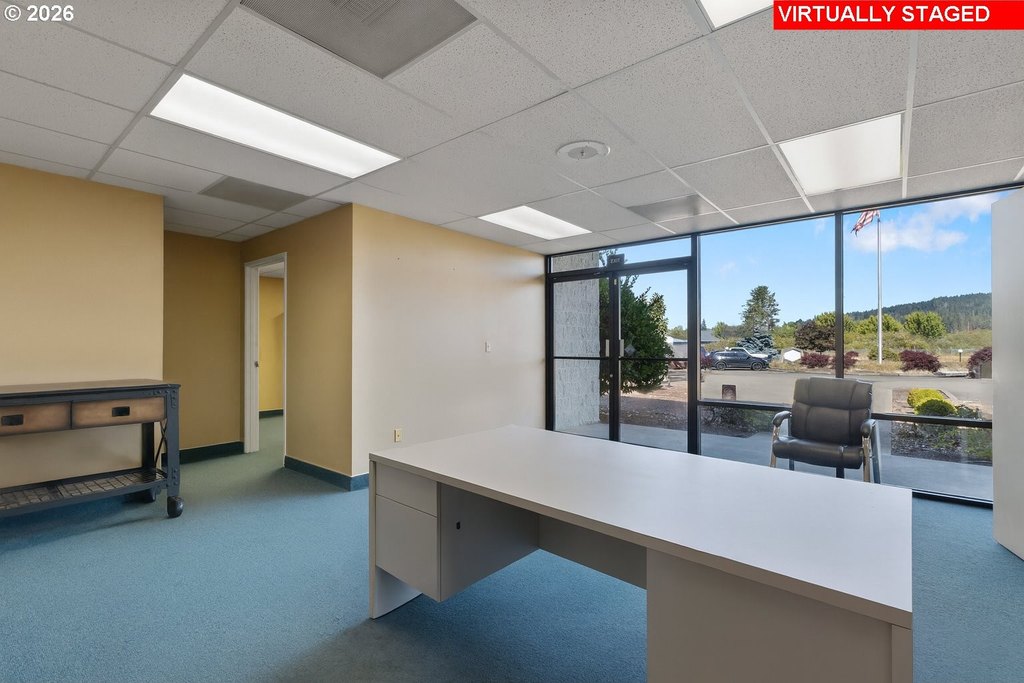
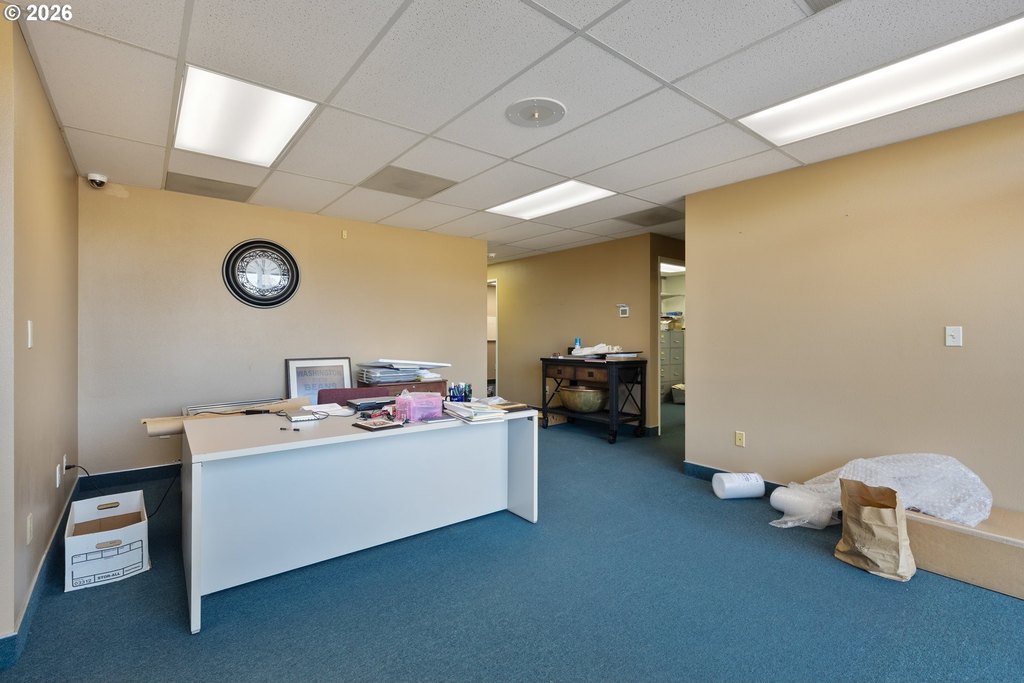
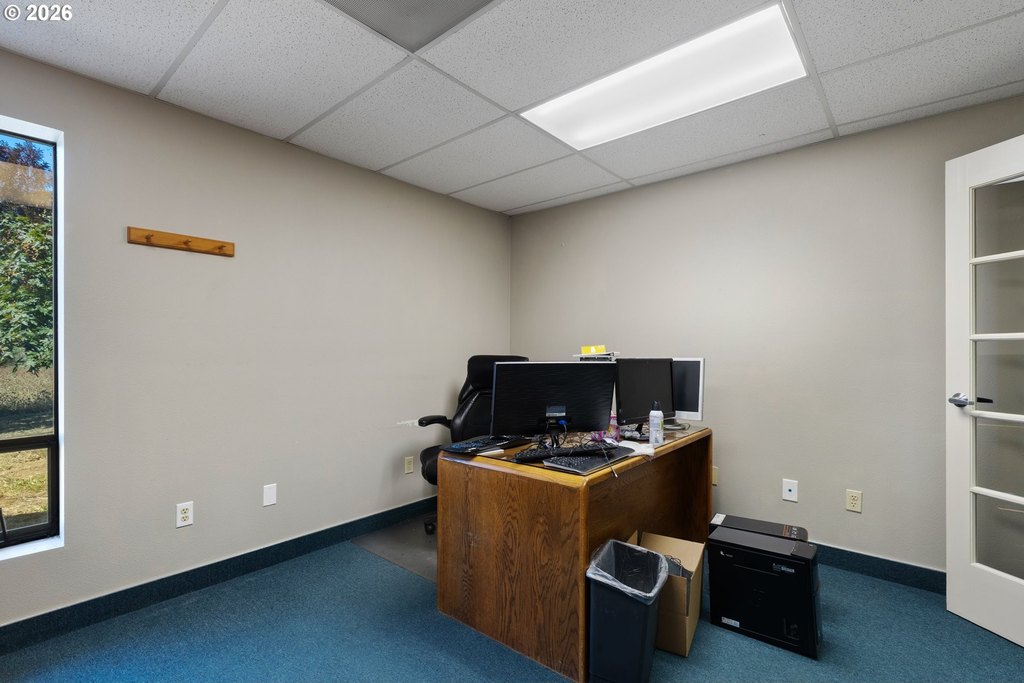
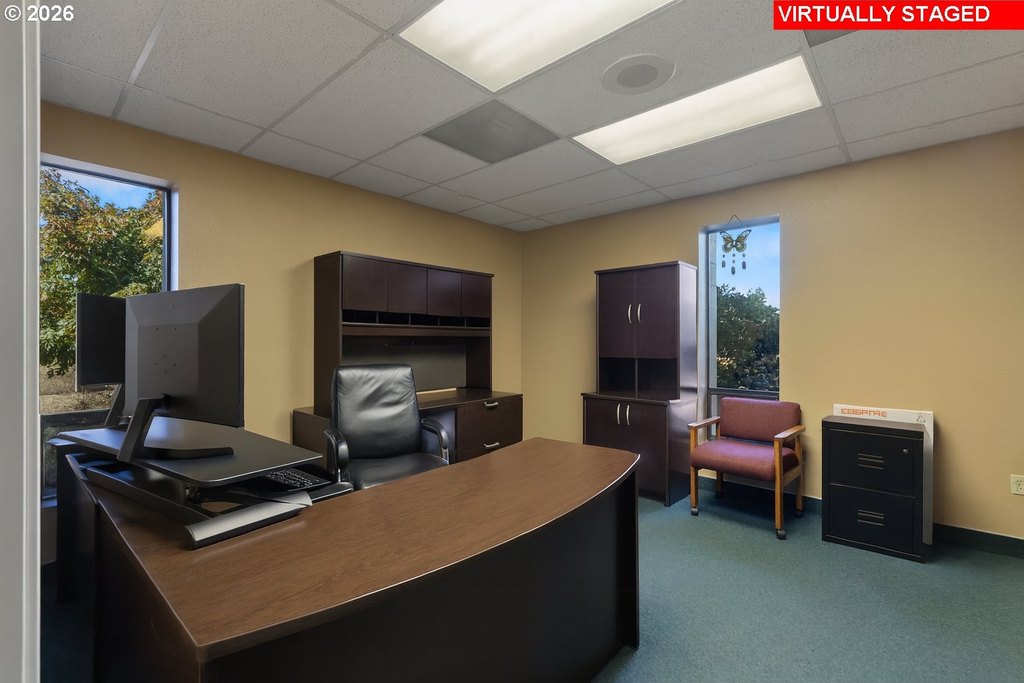
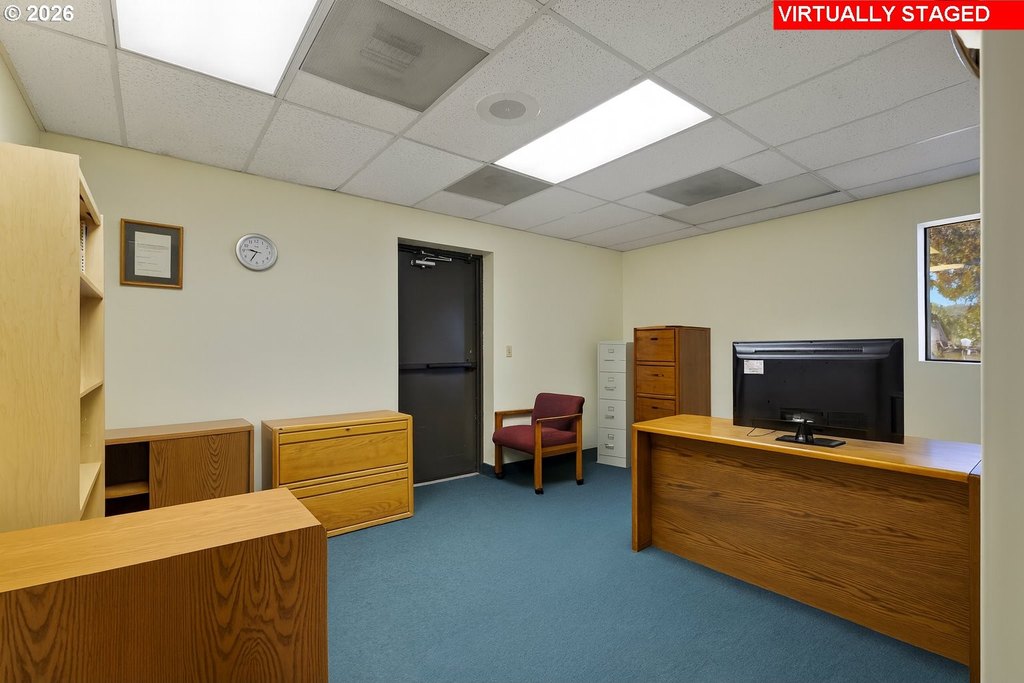
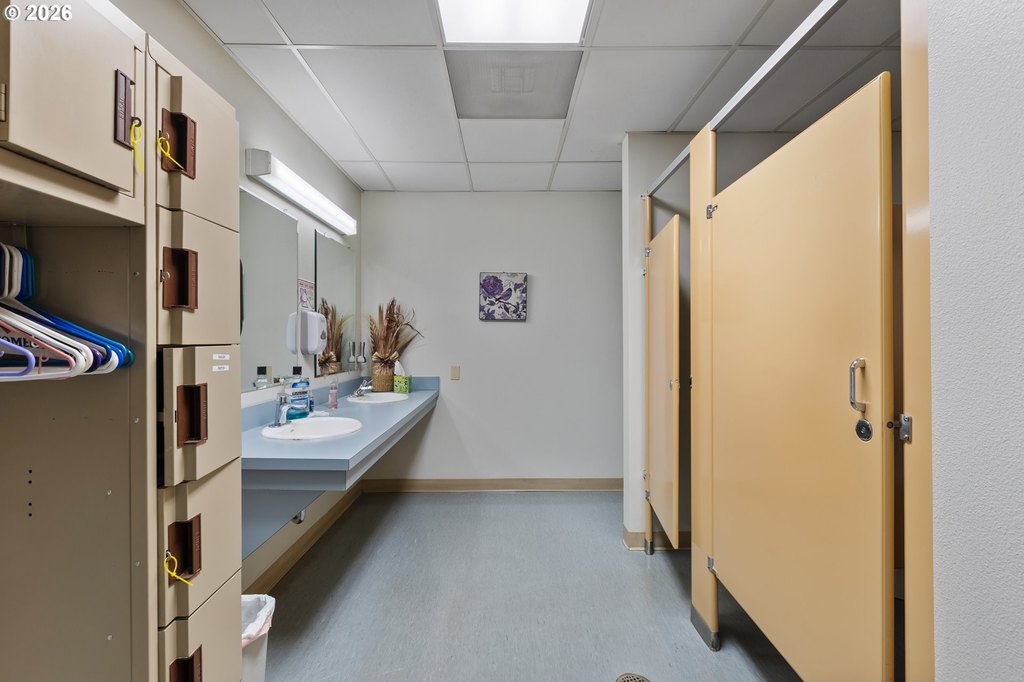
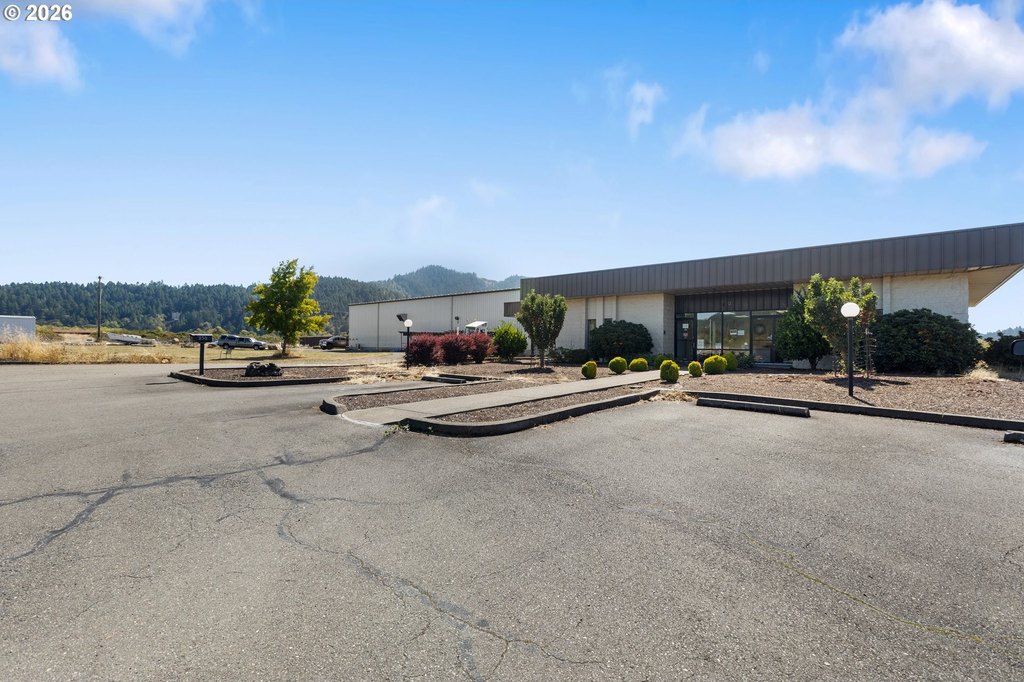
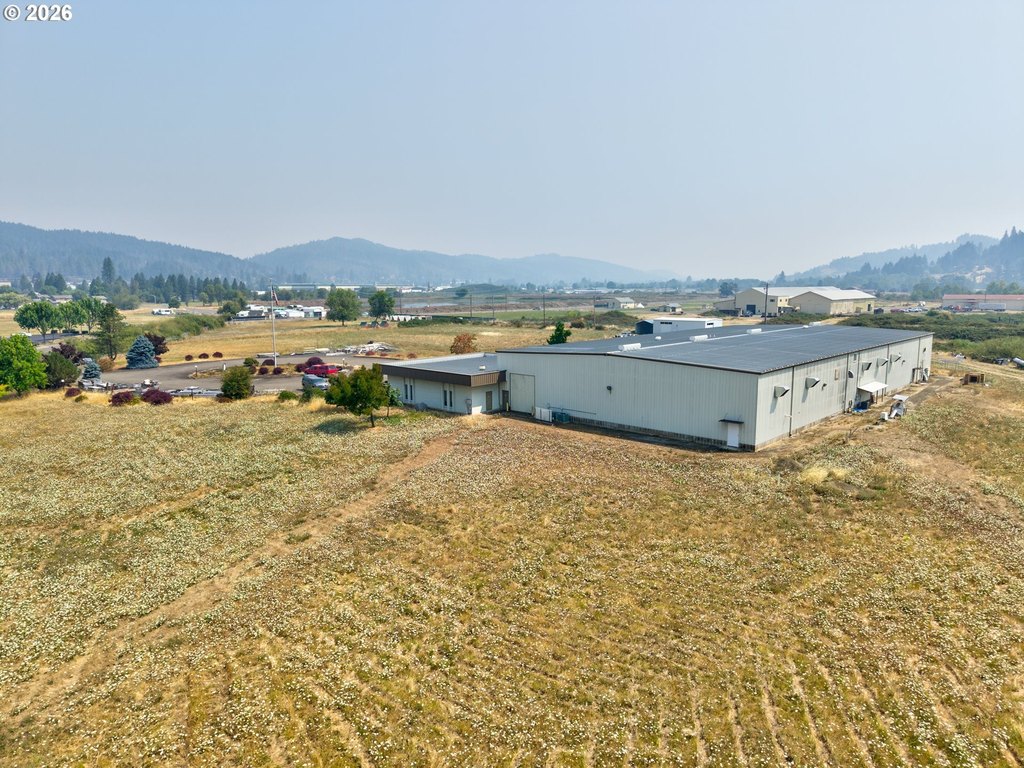
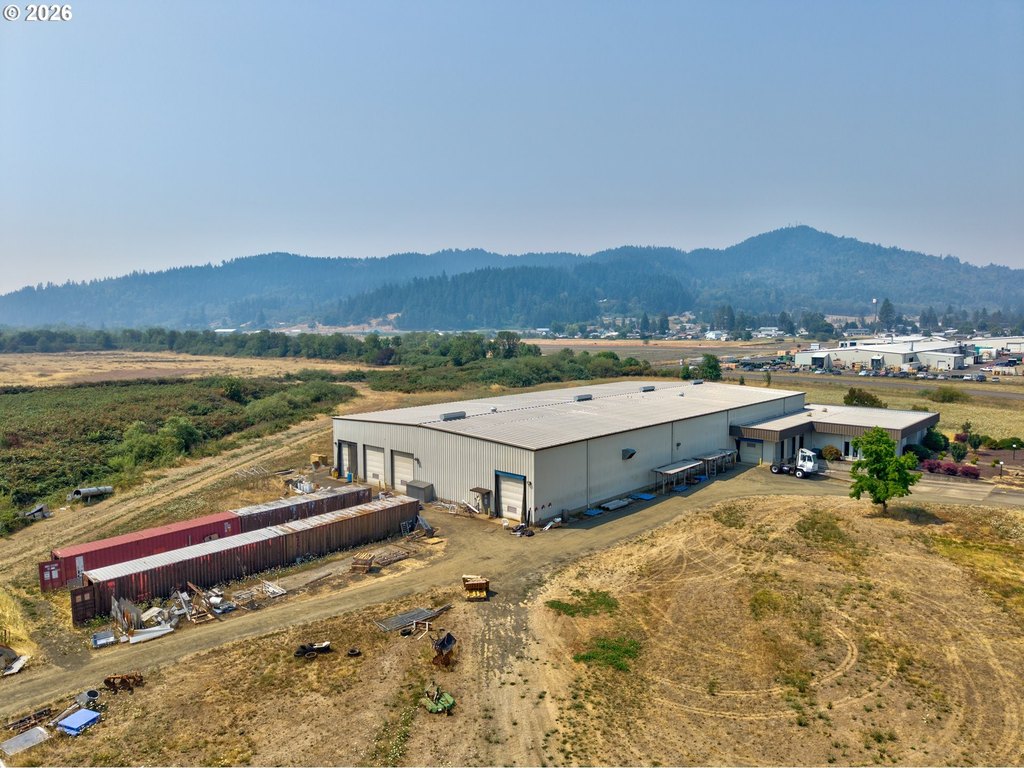
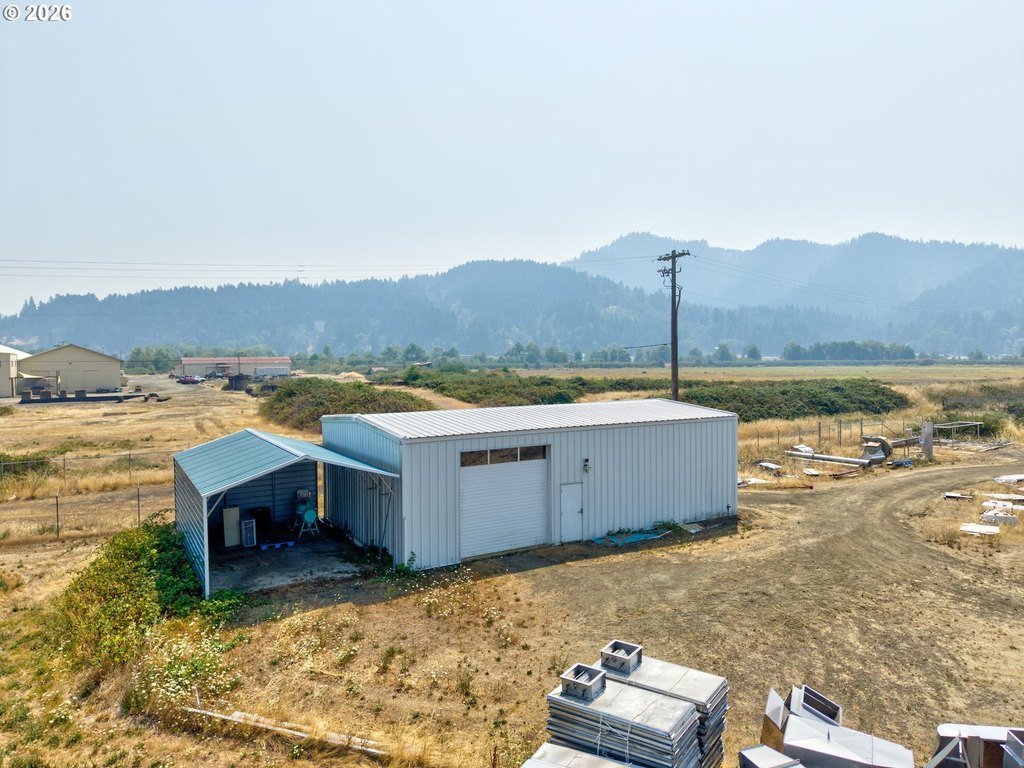
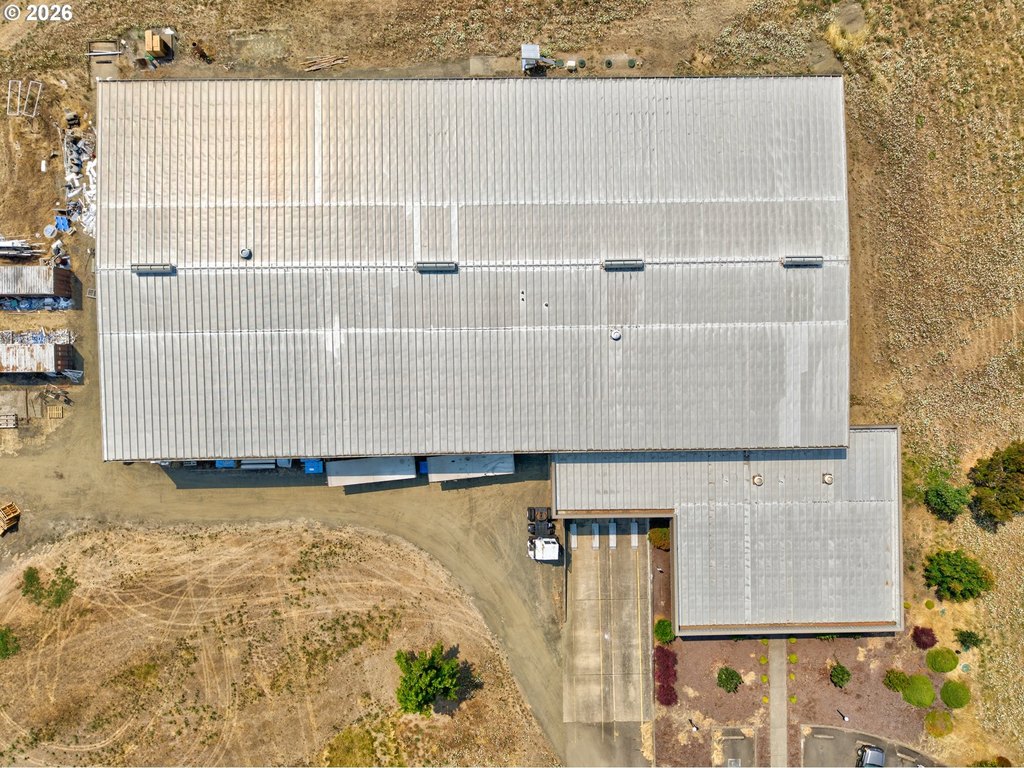
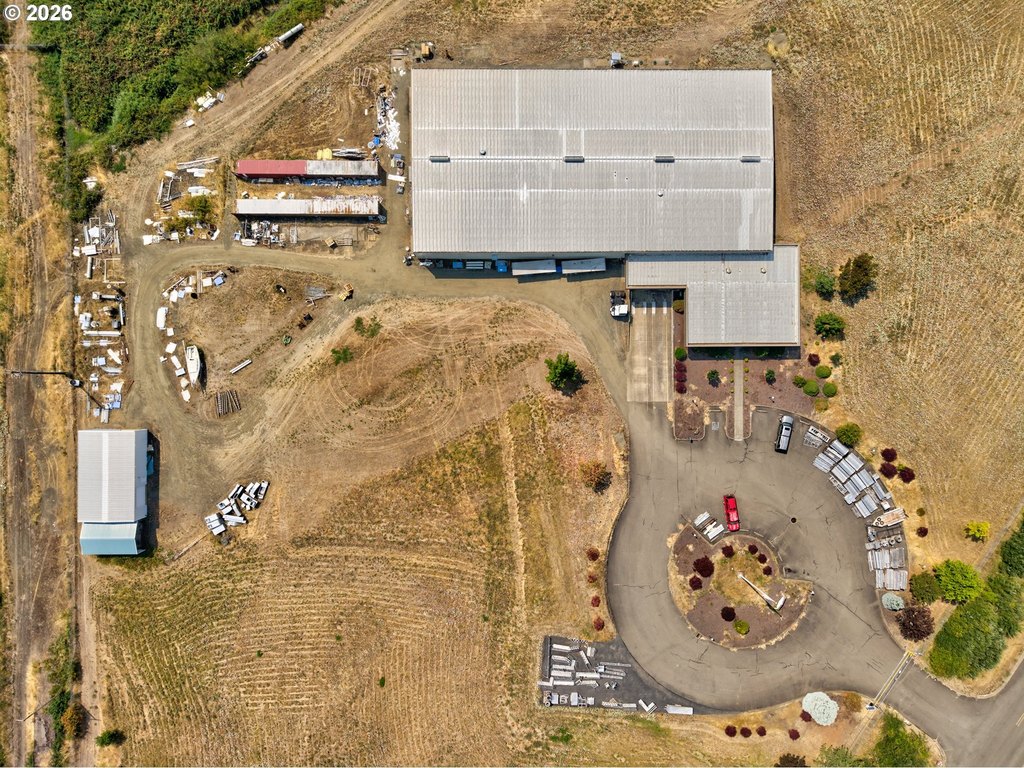
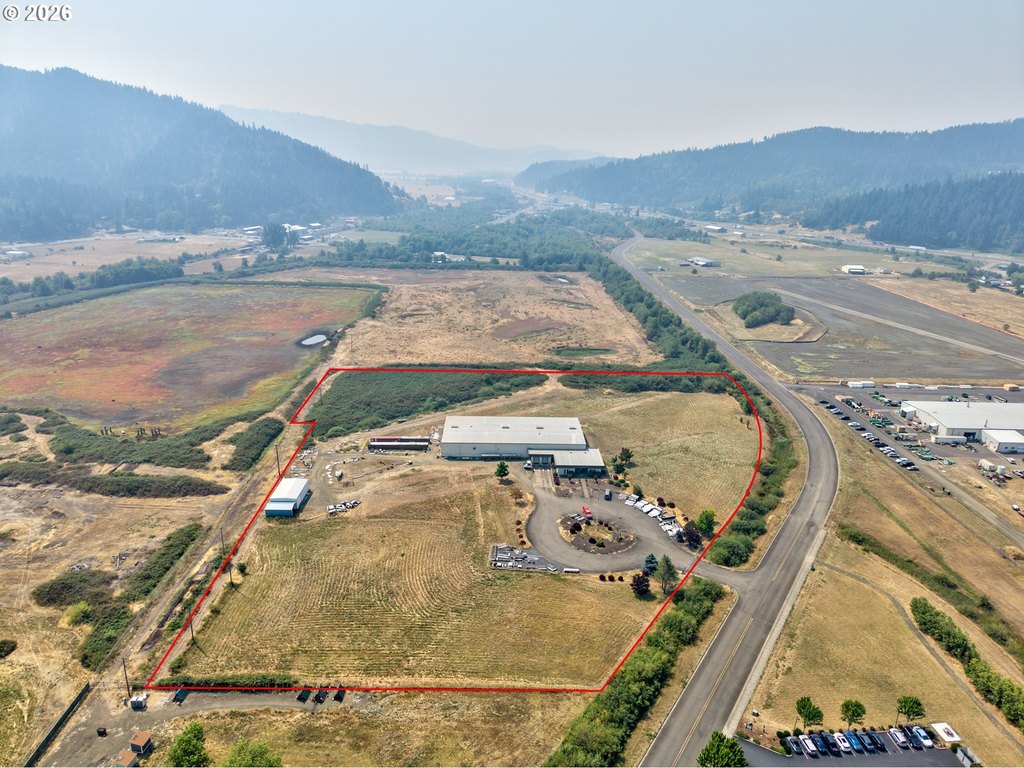
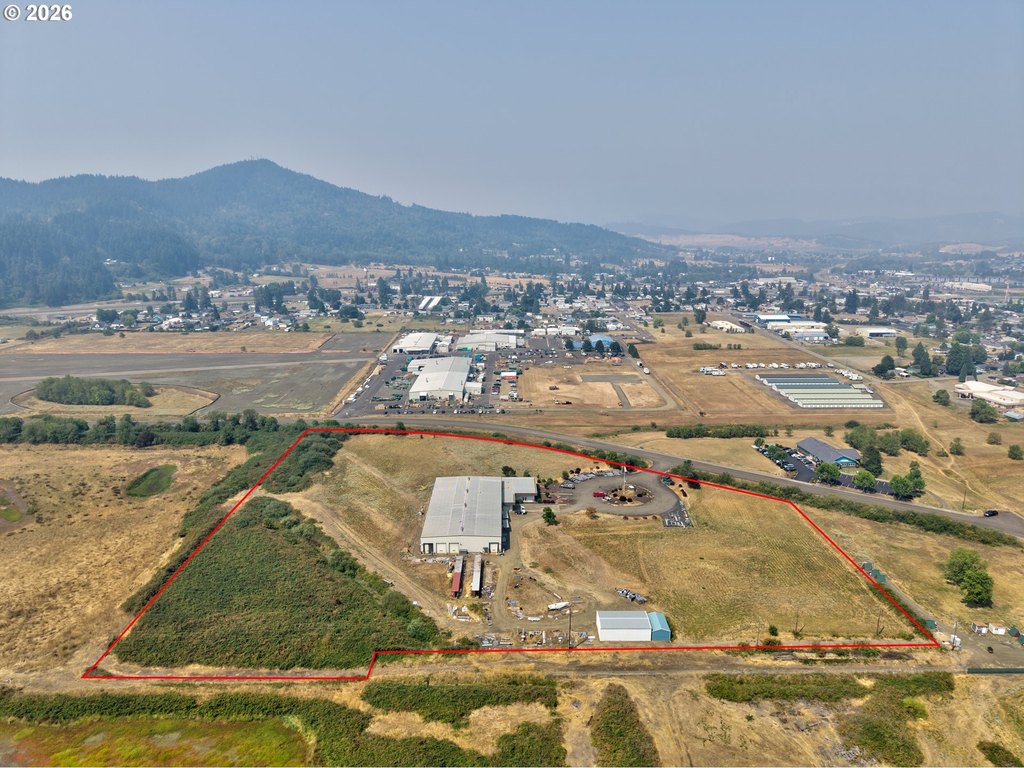
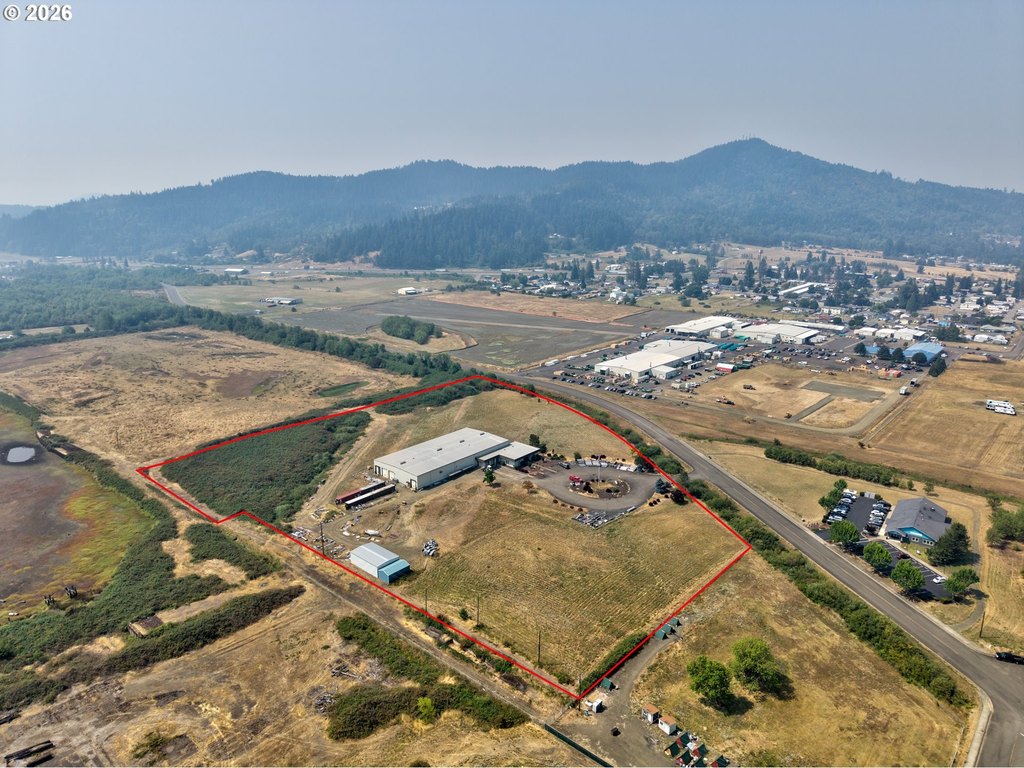
This 23,662-square-foot manufacturing facility occupies a 11.22-acre site in Sutherlin Industrial Park. Built in 1995, the metal-framed building includes finished offices, an employee break room, testing room, processing areas, cold storage, finished-goods storage, and loading and unloading docks. A second shop provides additional storage space. The property also features 3-phase power, fire suppression, central air, forced-air and ceiling heating, and a metal roof.
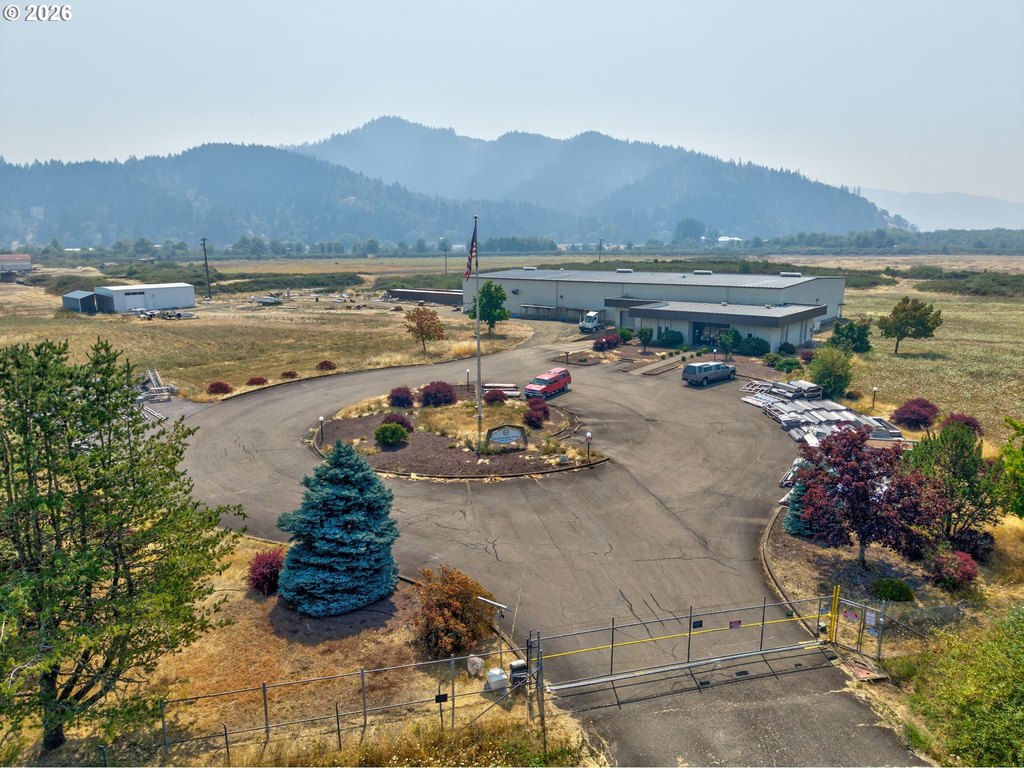
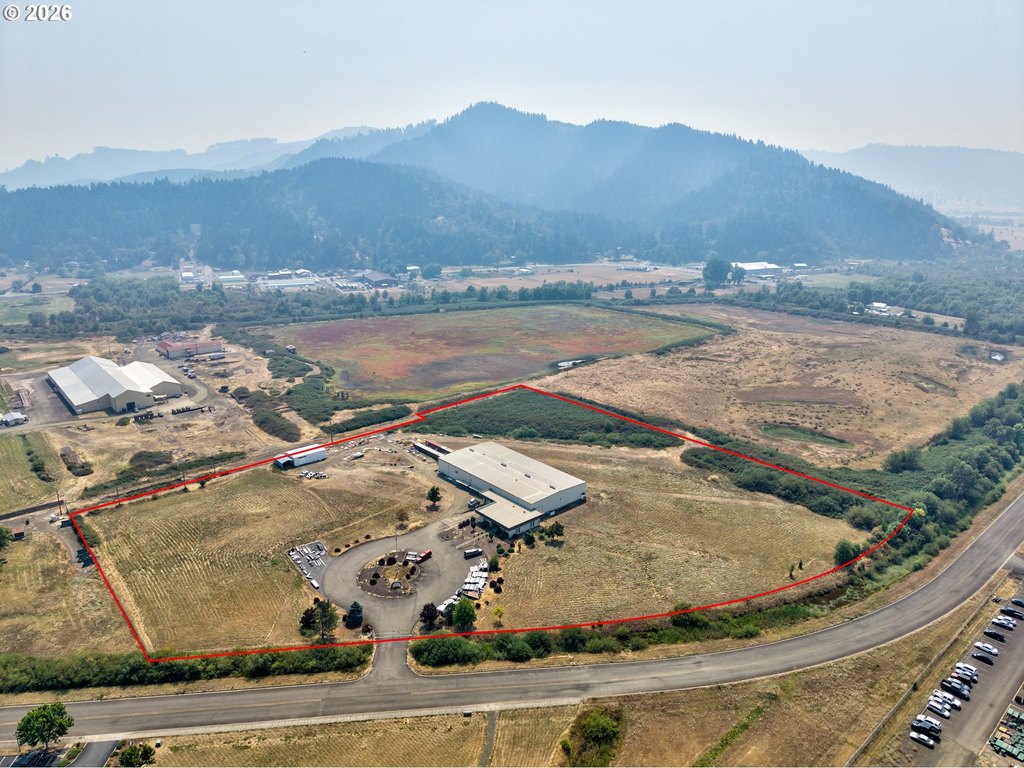
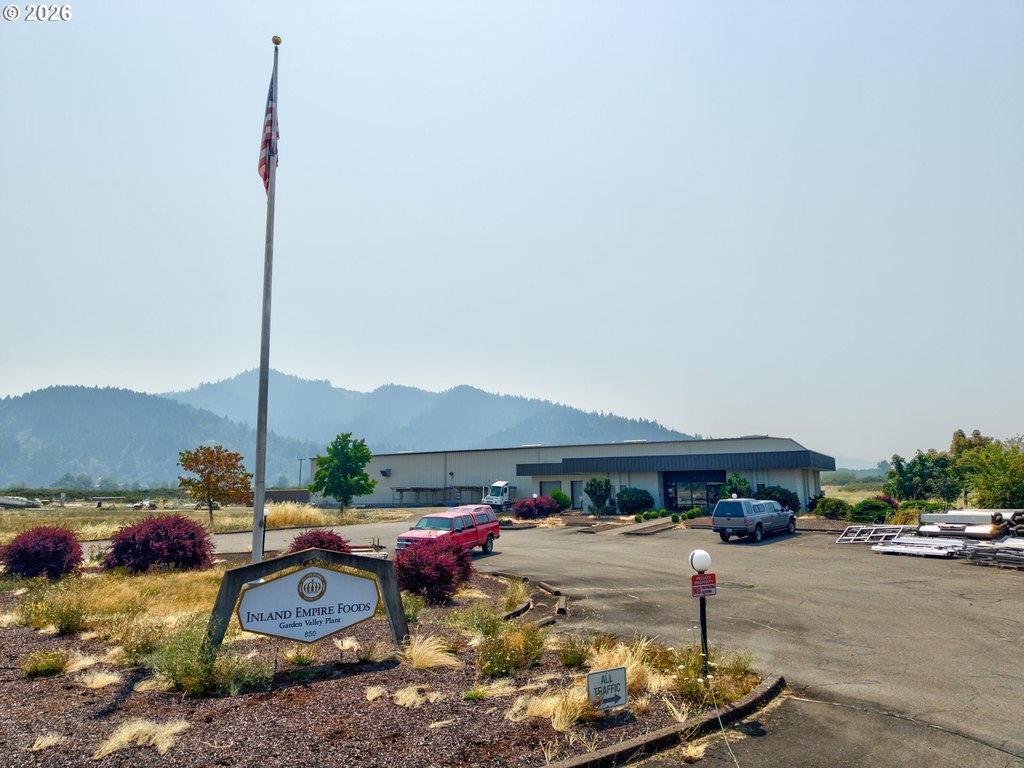
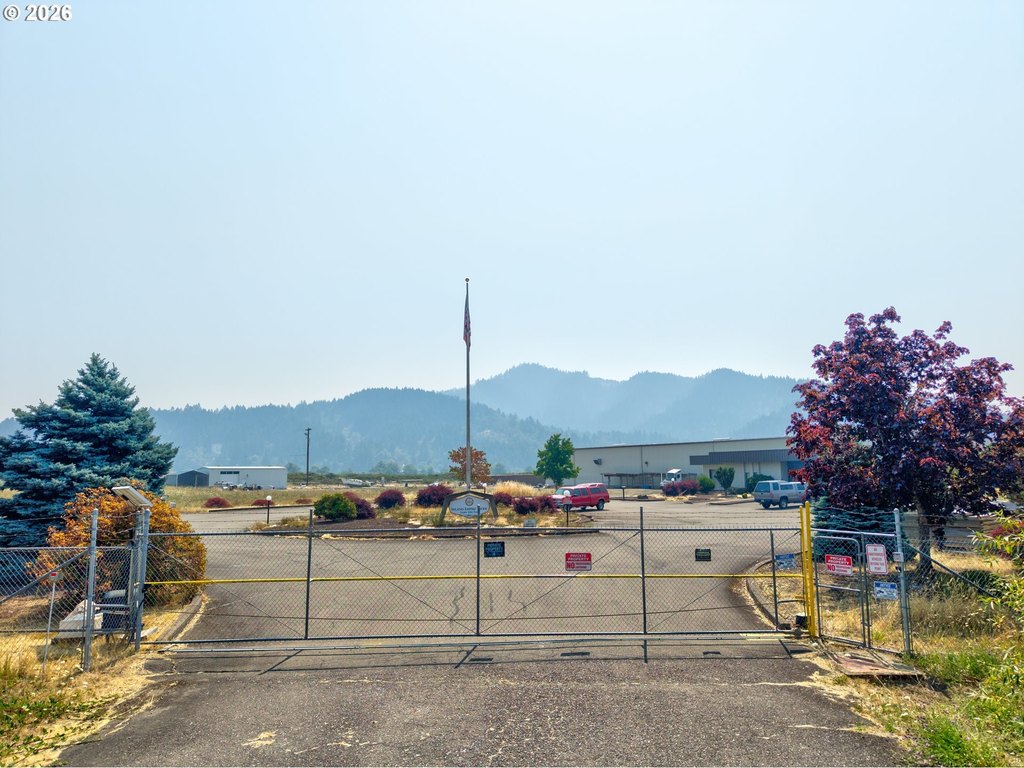
The fully fenced grounds are served by city utilities and include an additional well. The site is near I-5 Exit 136, with room for parking, equipment storage, truck circulation, and staging. M2 zoning is identified for the property. The facility was formerly used for food processing and includes infrastructure associated with production, storage, and distribution operations.
The fully fenced grounds are served by city utilities and include an additional well. The site is near I-5 Exit 136, with room for parking, equipment storage, truck circulation, and staging. M2 zoning is identified for the property. The facility was formerly used for food processing and includes infrastructure associated with production, storage, and distribution operations.
Key Highlights
- 23,662 SF manufacturing facility on 11.22 acres
- M2 zoning in Sutherlin Industrial Park
- Near I‑5 Exit 136 with access to the interstate corridor
Financial Insights
Estimated NOI and Cap Rate
NOI / Yr
$173,973
Cap Rate
5.90%
Suggested Prices Based on Cap Rates
Cap Rate 5%
$3,479,460
$3.5M
Cap Rate 7%
$2,485,329
$2.5M
Cap Rate 9%
$1,933,033
$1.9M
Market Conditions
NOI Build-Up for 23,662 SF
Gross rent
$213.0K $9.00/SF
− Vacancy
−$8.3K −$0.35/SF
EGI
$204.7K $8.65/SF
− OpEx
−$30.7K −$1.30/SF
NOI
$174.0K $7.35/SF
Area
Douglas County, OR
Vacancy
3.89%
Lease Rate
$9.00 /SF/Yr
Expense Ratio
15.00%
Simulate Cap Rate and NOI
Suggested Prices Based on Cap Rates
Cap Rate 5%
$3,479,460
Cap Rate 7%
$2,485,329
Cap Rate 9%
$1,933,033
Alternative Uses
Best Use
Warehouse
$2.49M
$2.17M – $2.90M
NOI $173,973 @ 7.0% cap · market cap 5.90%
Second Best
Industrial
$2.05M
$1.79M – $2.39M
NOI $143,272 @ 7.0% cap · market cap 4.86%
Theoretical Best
Specialty Retail
$4.10M
$3.58M – $4.78M
NOI $286,676 @ 7.0% cap · market cap 9.72%
Zoning and permitted uses should be independently verified with authorities.
Property Analytics
Unlock full access to Insights
Subscribe to Realmo Intelligence
Open Analytics
Current Use
Lease Details
Yes
Sprinkler system
Yes
Fenced yard
Yes
Highway access
Yes
Utilities to site
Location Intelligence
Trade Area within ½ mile
198
Businesses Nearby
Explore this area
Business Placement
Demographics for 97479, OR
10,161
Population
4,759
Households
2.1
Avg Household Size
47
Median Age
15%
College-Educated
94%
High-School Grad
67.5 sq mi
ZIP Area
151
Density / Sq Mi
$56,493
Median Household Income
$36,867
Median Earnings
$1,207
Median Rent
$281,500
Median Home Value
Check the figures for this property
Cap Rate, Value Estimation, Potential NOI and more
View Realmo Analytics
Market
Vacancy Rate% for Industrial in West region

Questions? Ask Rey
Realmo’s AI knows this listing — price, zoning, demand, history. Ask anything.


Frequently Asked Questions
What type of property is this?
Manufacturing property - Industrial facility with production, office, storage, and loading areas on a secure site with interstate access.
Where is this manufacturing property located?
The property is located at 850 GARDEN VALLEY Cir Sutherlin, OR.
What is the asking price?
The asking price for this property is $2,950,000.
What are key features of this property?
This property features: 23,662 SF manufacturing facility on 11.22 acres; M2 zoning in Sutherlin Industrial Park; Near I‑5 Exit 136 with access to the interstate corridor


