Mixed-Use Property with Fenced
For Sale
$249,900
358 S Calapooia ST, Sutherlin, OR 97479
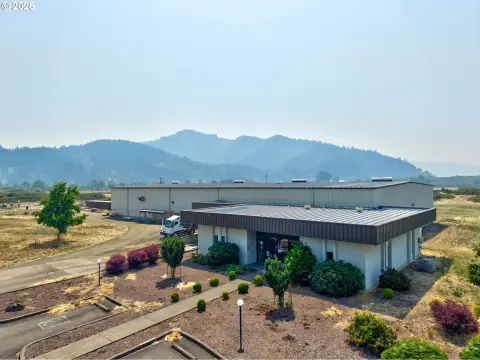
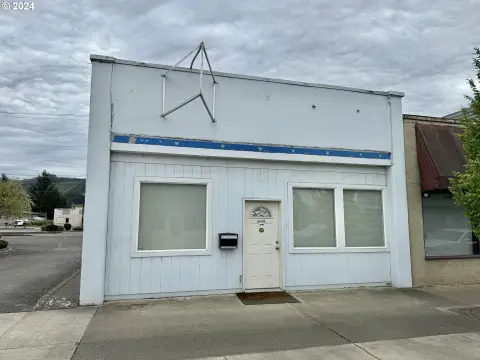
C3-zoned space combines an occupied preschool and one-bedroom apartment with access from S. Calapooia and Valentine Street.
Property Size1,833 SF
Price / SF$136.33
Days on Market48
Property Features for 358 S Calapooia ST
General Information
Standard status
Active
Size
1,833 SF
Property subtype
Commercial
Zoning
C3
Occupancy
100%
Site & Location
Highway Access
Yes
Road Access
Yes
Amenities
fenced back yard
mini-split heating and air-conditioning
Building Details
Year Built
1960
Tenancy
Multi
Listing Agency:
Oregon First
(503) 481-7555
Listed By:
Brittany Gibbs · License #201209867
(503) 836-2010
Source:
Findhousesinoregon
Added: Sep 6
Changed: Oct 21
Last Checked: Oct 20 at 9:07PM
Displayed information is deemed reliable but is not guaranteed and should be independently verified. All listing content including descriptions, pricing, images are the copyrighted material of Oregon First

Ask AI about this property
Review the available facts, identify missing information and prepare questions for the agent.
Investment Insights
Based on property information with market context.
This 1,833-square-foot mixed-use property, built in 1960, includes approximately 1,160 square feet of preschool space and a 670-square-foot one-bedroom apartment. Both areas have been updated with mini-split heating and air-conditioning and are occupied by long-term tenants. The property is zoned C3 and fronts S. Calapooia, identified as Hwy 99S, with additional access from Valentine Street. A large fenced backyard supports the existing preschool configuration. The building also shares its south wall with a mini market, providing an established commercial setting for the current combination of uses.
Key Highlights
- C3‑zoned mixed‑use property with 1,833 square feet
- Approximately 1,160 SF preschool space and 670 SF one‑bedroom apartment
- Both spaces occupied by long‑term tenants
Financial Insights
Estimated NOI and Cap Rate
NOI / Yr
$12,716
Cap Rate
5.09%
Suggested Prices Based on Cap Rates
Cap Rate 5%
$254,320
$254.3K
Cap Rate 7%
$181,657
$181.7K
Cap Rate 9%
$141,289
$141.3K
Market Conditions
NOI Build-Up for 1,833 SF
Gross rent
$22.0K $12.00/SF
− Vacancy
−$1.6K −$0.90/SF
EGI
$20.3K $11.10/SF
− OpEx
−$7.6K −$4.16/SF
NOI
$12.7K $6.94/SF
Area
Douglas County, OR
Vacancy
7.50%
Lease Rate
$12.00 /SF/Yr
Expense Ratio
37.50%
Simulate Cap Rate and NOI
Suggested Prices Based on Cap Rates
Cap Rate 5%
$254,320
Cap Rate 7%
$181,657
Cap Rate 9%
$141,289
Alternative Uses
Best Use
Mixed Use
$181.7K
$159.0K – $211.9K
NOI $12,716 @ 7.0% cap · market cap 5.09%
Second Best
—
—
no second resolved use
Theoretical Best
Specialty Retail
$317.3K
$277.6K – $370.1K
NOI $22,208 @ 7.0% cap · market cap 8.89%
Zoning and permitted uses should be independently verified with authorities.
How Realmo checks its estimates
Property Analytics
Who owns this building?
See the owner, sales and loan history
Open Analytics
Current Use
Lease Details
100%
Occupancy
Multi-tenant
Tenancy
Yes
Highway access
Yes
Paved road access
Location Intelligence
Trade Area within ½ mile
305
Businesses Nearby
Explore this area
Business Placement
Demographics for 97479, OR
10,161
Population
4,759
Households
2.1
Avg Household Size
47
Median Age
15%
College-Educated
94%
High-School Grad
67.5 sq mi
ZIP Area
151
Density / Sq Mi
$56,493
Median Household Income
$36,867
Median Earnings
$1,207
Median Rent
$281,500
Median Home Value
Check the figures for this property
Cap Rate, Value Estimation, Potential NOI and more
View Realmo Analytics


Frequently Asked Questions
What type of property is this?
Mixed-use property - C3-zoned space combines an occupied preschool and one-bedroom apartment with access from S. Calapooia and Valentine Street.
Where is this mixed-use property located?
The property is located at 358 S Calapooia ST Sutherlin, OR.
What is the asking price?
The asking price for this property is $249,900.
What are key features of this property?
This property features: C3‑zoned mixed‑use property with 1,833 square feet; Approximately 1,160 SF preschool space and 670 SF one‑bedroom apartment; Both spaces occupied by long‑term tenants