Remodeled Mixed-Use
For Sale
$595,000
843 E 4th Street, Long Beach, CA 90802
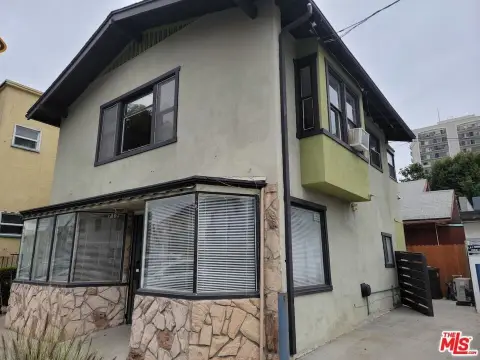
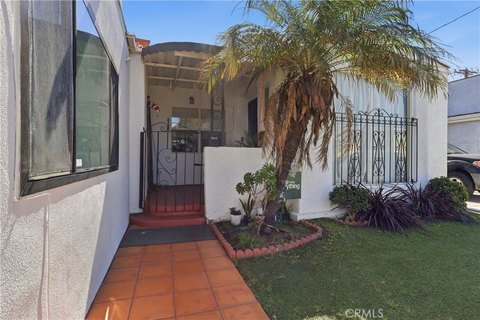
Unit D offers an open ground-floor layout with a restroom and second-floor mezzanine.
Property Size921 SF
Days on Market48
Property Features for 843 E 4th Street
General Information
Standard status
Active
Size
921 SF
Class
Class A
Property subtype
Retail
Additional Details
Floor
Ground Floor
Office Units
1
Building Details
Building Size
921 SF
Year Built
2004
Tenancy
Multi
Listing Agency:
Coldwell Banker Commercial BLAIR
Listed By:
Sheva Hosseinzadeh · License #01922147
(562) 400-5949
Source:
Cbcworldwide
Added: Sep 2
Changed: Oct 13
Last Checked: Oct 16 at 5:49AM
Displayed information is deemed reliable but is not guaranteed and should be independently verified. All listing content including descriptions, pricing, images are the copyrighted material of Coldwell Banker Commercial BLAIR

Ask AI about this property
Review the available facts, identify missing information and prepare questions for the agent.
Investment Insights
Based on property information with market context.
Unit D is a fully remodeled mixed-use condominium within a project developed in 2004. The suite provides open space on the ground floor, a restroom, and additional mezzanine area on the second floor.
The project includes 25 residential loft-style condominiums and 8 office/retail condominiums. It is situated between Downtown Long Beach and the Belmont Heights neighborhood, providing a combination of residential, office, and retail condominium uses within the same development.
The project includes 25 residential loft-style condominiums and 8 office/retail condominiums. It is situated between Downtown Long Beach and the Belmont Heights neighborhood, providing a combination of residential, office, and retail condominium uses within the same development.
Key Highlights
- Unit D has a fully remodeled interior
- Open ground‑floor space with restroom
- Second‑floor mezzanine included
Financial Insights
Estimated NOI and Cap Rate
NOI / Yr
$23,466
Cap Rate
3.94%
Suggested Prices Based on Cap Rates
Cap Rate 5%
$469,320
$469.3K
Cap Rate 7%
$335,229
$335.2K
Cap Rate 9%
$260,733
$260.7K
Market Conditions
NOI Build-Up for 921 SF
Gross rent
$42.0K $45.60/SF
− Vacancy
−$10.7K −$11.63/SF
EGI
$31.3K $33.97/SF
− OpEx
−$7.8K −$8.49/SF
NOI
$23.5K $25.48/SF
Area
Long Beach, CA
Vacancy
25.50%
Lease Rate
$45.60 /SF/Yr
Expense Ratio
25.00%
Simulate Cap Rate and NOI
Suggested Prices Based on Cap Rates
Cap Rate 5%
$469,320
Cap Rate 7%
$335,229
Cap Rate 9%
$260,733
Alternative Uses
Best Use
Office B
$335.2K
$293.3K – $391.1K
NOI $23,466 @ 7.0% cap · market cap 3.94%
Second Best
Mixed Use
$229.4K
$200.8K – $267.7K
NOI $16,060 @ 7.0% cap · market cap 2.70%
Theoretical Best
Office A
$493.1K
$431.5K – $575.3K
NOI $34,517 @ 7.0% cap · market cap 5.80%
Zoning and permitted uses should be independently verified with authorities.
How Realmo checks its estimates
Property Analytics
Current Use
Lease Details
1
Office units
Multi-tenant
Tenancy
Location Intelligence
Trade Area within ½ mile
5,672
Businesses Nearby
Explore this area
Business Placement
Demographics for 90802, CA
41,686
Population
25,055
Households
1.7
Avg Household Size
37
Median Age
44%
College-Educated
88%
High-School Grad
6.5 sq mi
ZIP Area
6,413
Density / Sq Mi
$72,152
Median Household Income
$52,011
Median Earnings
$1,855
Median Rent
$546,700
Median Home Value
Market
Vacancy Rate% for Office in West region




Frequently Asked Questions
What type of property is this?
Mixed-use property - Unit D offers an open ground-floor layout with a restroom and second-floor mezzanine.
Where is this mixed-use property located?
The property is located at 843 E 4th Street Long Beach, CA.
What is the asking price?
The asking price for this property is $595,000.
What are key features of this property?
This property features: Unit D has a fully remodeled interior; Open ground‑floor space with restroom; Second‑floor mezzanine included


