Mixed-Use Building with Restaurant &
For Sale
Contact for pricing
828 Fifth Ave, San Diego, CA 92101
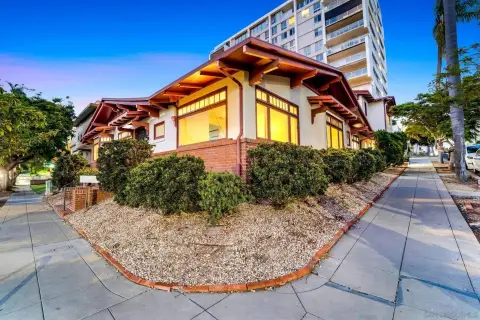
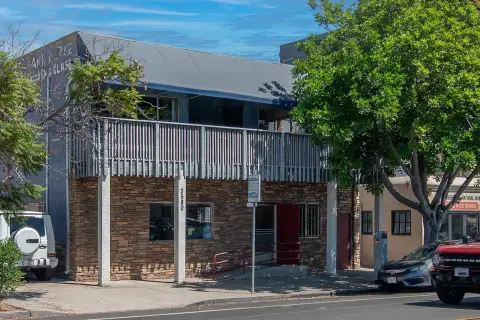
Two-story mixed-use building featuring restaurant and executive office spaces.
Property Size8,729 SF
Price / SF$572.80
Days on Market890
Property Features for 828 Fifth Ave
General Information
Standard status
Active
Size
8,729 SF
Property subtype
Mixed Use, Office, Retail
Investment Type
Value Add
Net Operating Income
$319,040
Site & Location
Neighborhood
Gaslamp
Building Details
Year Built
1895
Year Renovated
2001
Units
3
Listing Agency:
Marcus & Millichap - San Diego
Listed By:
Ali Valiahdi · License #CA 01980677
(858) 373-3288
Source:
Crexi
Added: May 18, 2024
Changed: Oct 13
Last Checked: Oct 23 at 4:01AM
Displayed information is deemed reliable but is not guaranteed and should be independently verified. All listing content including descriptions, pricing, images are the copyrighted material of Marcus & Millichap - San Diego

Ask AI about this property
Review the available facts, identify missing information and prepare questions for the agent.
Investment Insights
Based on property information with market context.
This two-story mixed-use building offers 8,729 square feet of space and is currently 85% leased. The first floor is occupied by Sadaf Restaurant and Casa Balance Restaurant, with an average rent of $5.73 per square foot on a NNN lease basis. These leases are set to expire in April 2026 and June 2026, respectively, with no remaining options. The second floor features 12 executive office units, with 9 currently leased to an architecture firm. This lease expires in April 2025 and includes one 5-year fair market option.
Key Highlights
- 2‑Story Mixed Use Building with 8,729 SF
- 85% Leased
- 1st Floor Tenants: Sadaf Restaurant & Casa Balance Restaurant
Financial Insights
Estimated NOI and Cap Rate
NOI / Yr
$168,644
Cap Rate
3.37%
Suggested Prices Based on Cap Rates
Cap Rate 5%
$3,372,880
$3.4M
Cap Rate 7%
$2,409,200
$2.4M
Cap Rate 9%
$1,873,822
$1.9M
Market Conditions
NOI Build-Up for 8,729 SF
Gross rent
$293.3K $33.60/SF
− Vacancy
−$23.5K −$2.69/SF
EGI
$269.8K $30.91/SF
− OpEx
−$101.2K −$11.59/SF
NOI
$168.6K $19.32/SF
Area
San Diego, CA
Vacancy
8.00%
Lease Rate
$33.60 /SF/Yr
Expense Ratio
37.50%
Simulate Cap Rate and NOI
Suggested Prices Based on Cap Rates
Cap Rate 5%
$3,372,880
Cap Rate 7%
$2,409,200
Cap Rate 9%
$1,873,822
Alternative Uses
Best Use
Mixed Use
$2.41M
$2.11M – $2.81M
NOI $168,644 @ 7.0% cap · market cap 3.37%
Second Best
—
—
no second resolved use
Theoretical Best
Specialty Retail
$3.45M
$3.02M – $4.02M
NOI $241,339 @ 7.0% cap · market cap 4.83%
Zoning and permitted uses should be independently verified with authorities.
How Realmo checks its estimates
Property Analytics
Contact the owner directly
Get the owner's phone numbers and email
Open Analytics
Current Use
Location Intelligence
Trade Area within ½ mile
12,817
Businesses Nearby
Explore this area
Business Placement
Demographics for 92101, CA
47,505
Population
32,909
Households
1.4
Avg Household Size
39
Median Age
57%
College-Educated
92%
High-School Grad
5.4 sq mi
ZIP Area
8,797
Density / Sq Mi
$90,477
Median Household Income
$72,371
Median Earnings
$2,351
Median Rent
$740,500
Median Home Value
Check the figures for this property
Cap Rate, Value Estimation, Potential NOI and more
View Realmo Analytics






Frequently Asked Questions
What type of property is this?
Mixed-use property - Two-story mixed-use building featuring restaurant and executive office spaces.
Where is this mixed-use property located?
The property is located at 828 Fifth Ave San Diego, CA.
What is the asking price?
The asking price for this property is $5,000,000.
What are key features of this property?
This property features: 2‑Story Mixed Use Building with 8,729 SF; 85% Leased; 1st Floor Tenants: Sadaf Restaurant & Casa Balance Restaurant


