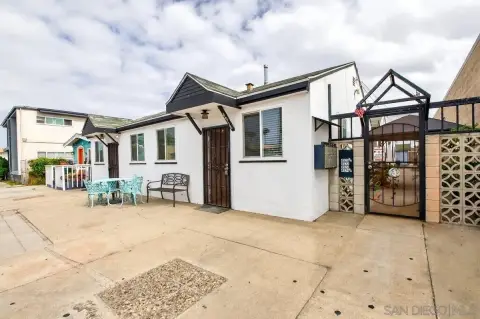
Six-Unit Apartment
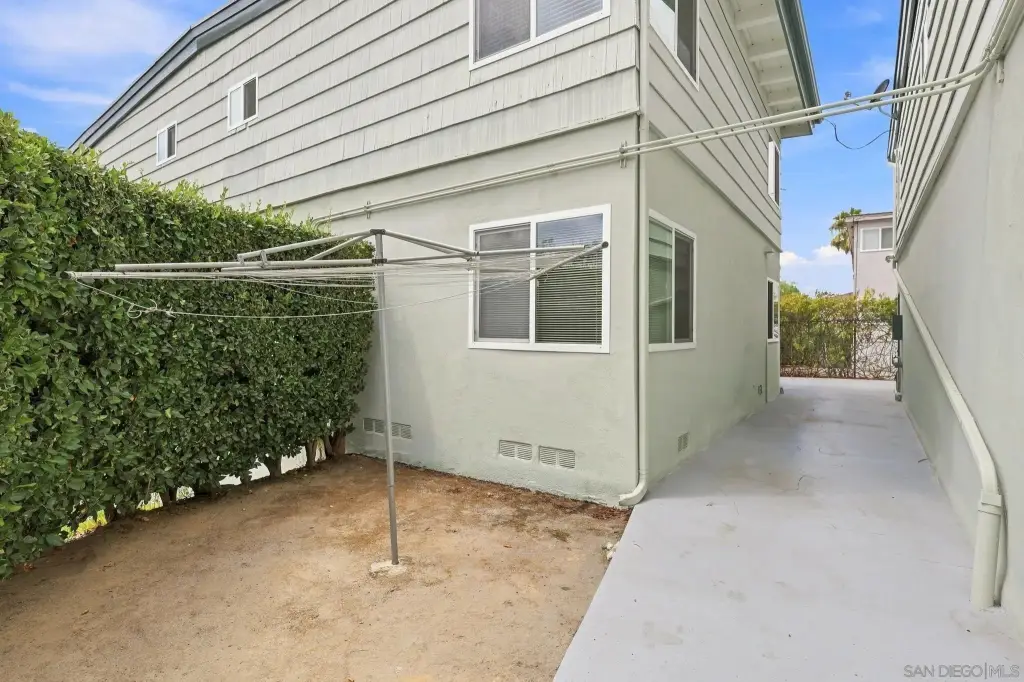
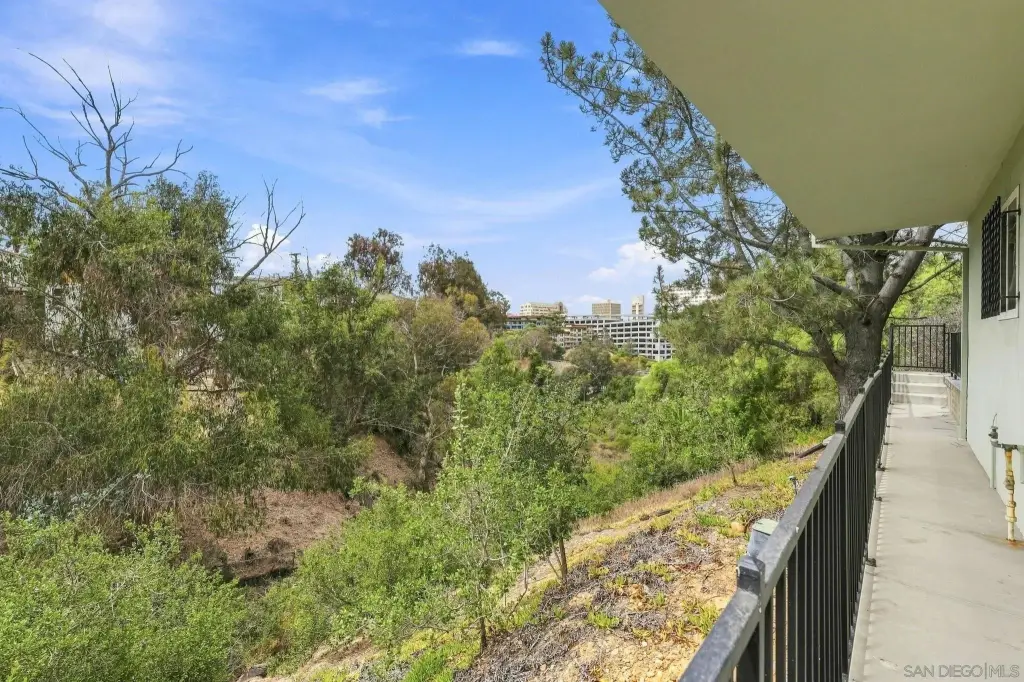
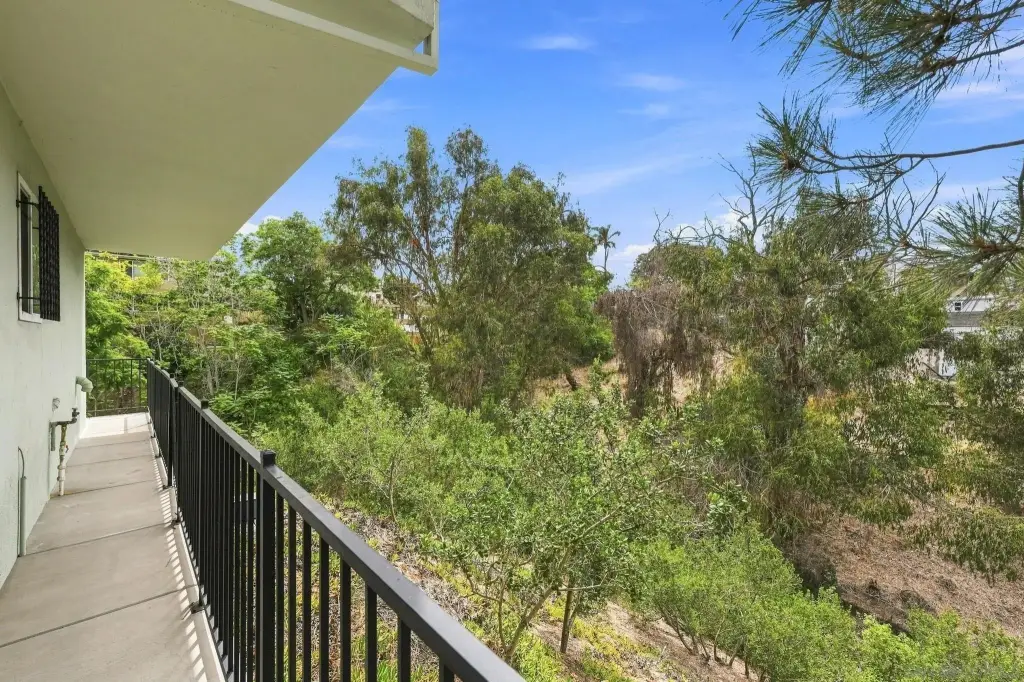
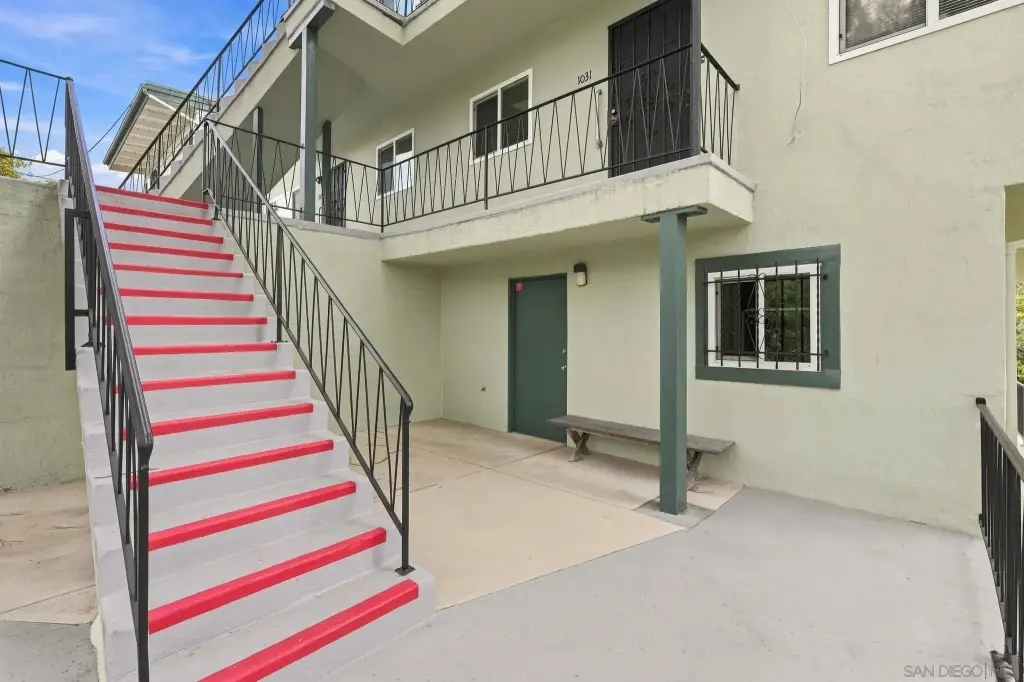





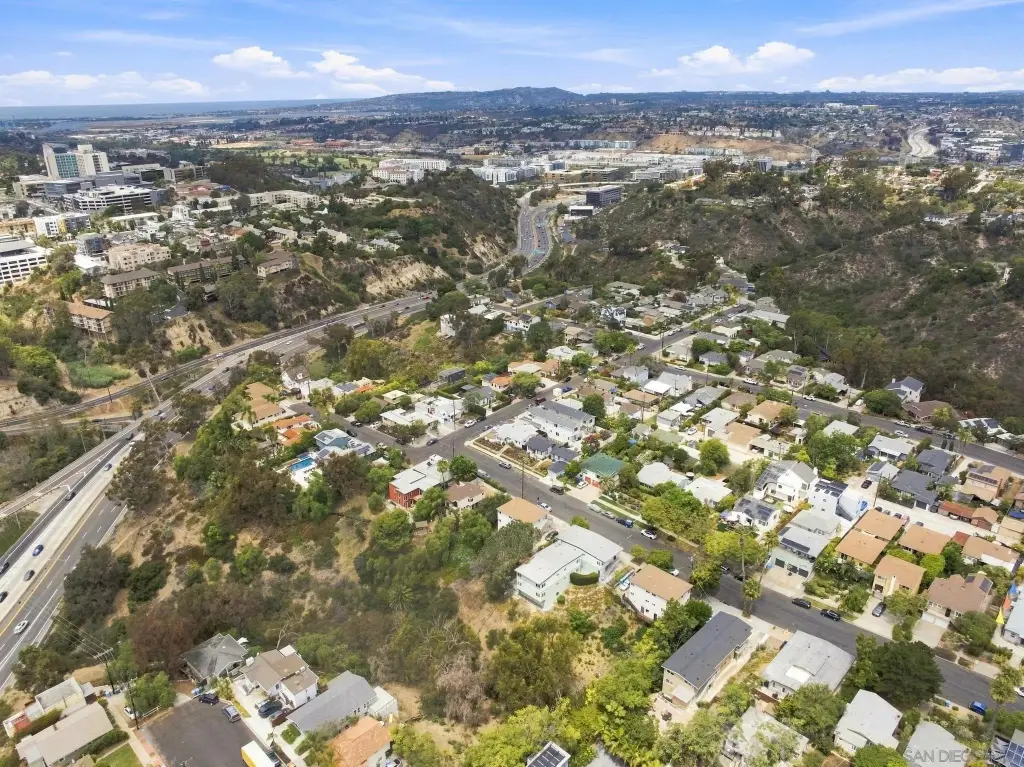
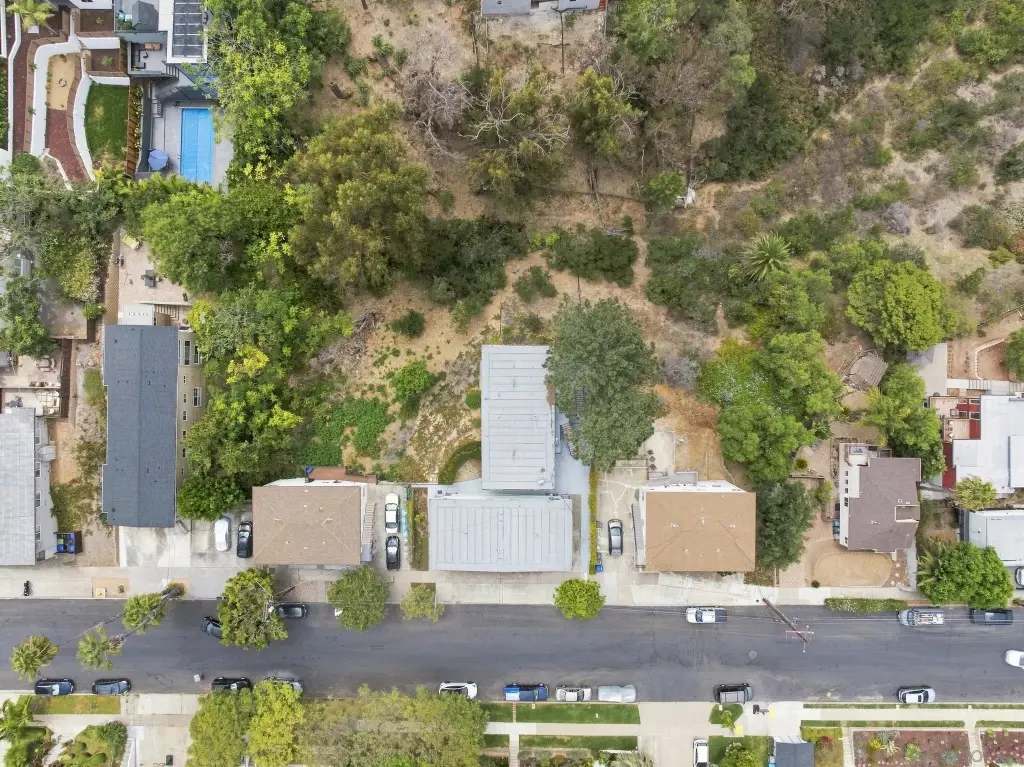
For Sale
$2,200,000
Pending
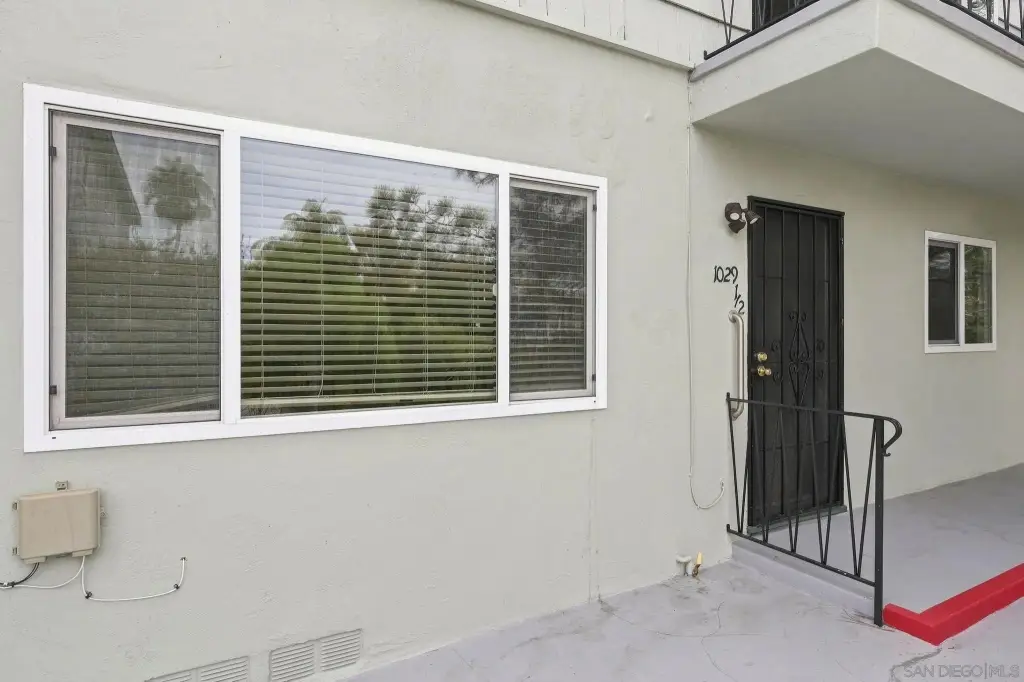
1029-33 Hayes Ave, San Diego, CA 92103
Residential Income, San Diego, CA
Property Size4,338 SF
Days on Market47
Property Features for 1029-33 Hayes Ave
General Information
Property type
Residential Multi Family
Property subtype
Other
Bedrooms
6
Bathrooms
6
Full bathrooms
6
Rooms
Bedroom 3, Bedroom 5, Bathroom 6, Bathroom 1, Bedroom 1, Bedroom 2, Bedroom 6, Bathroom 3, Bathroom 4, Bathroom 5, Bedroom 4, Bathroom 2
Parking
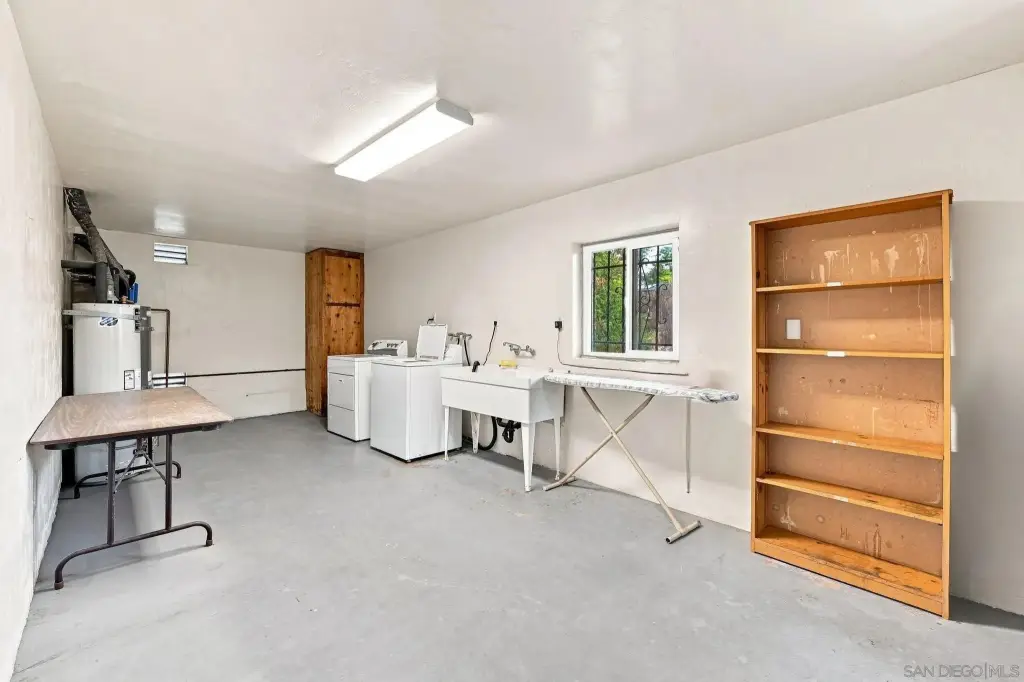
4
Parking features
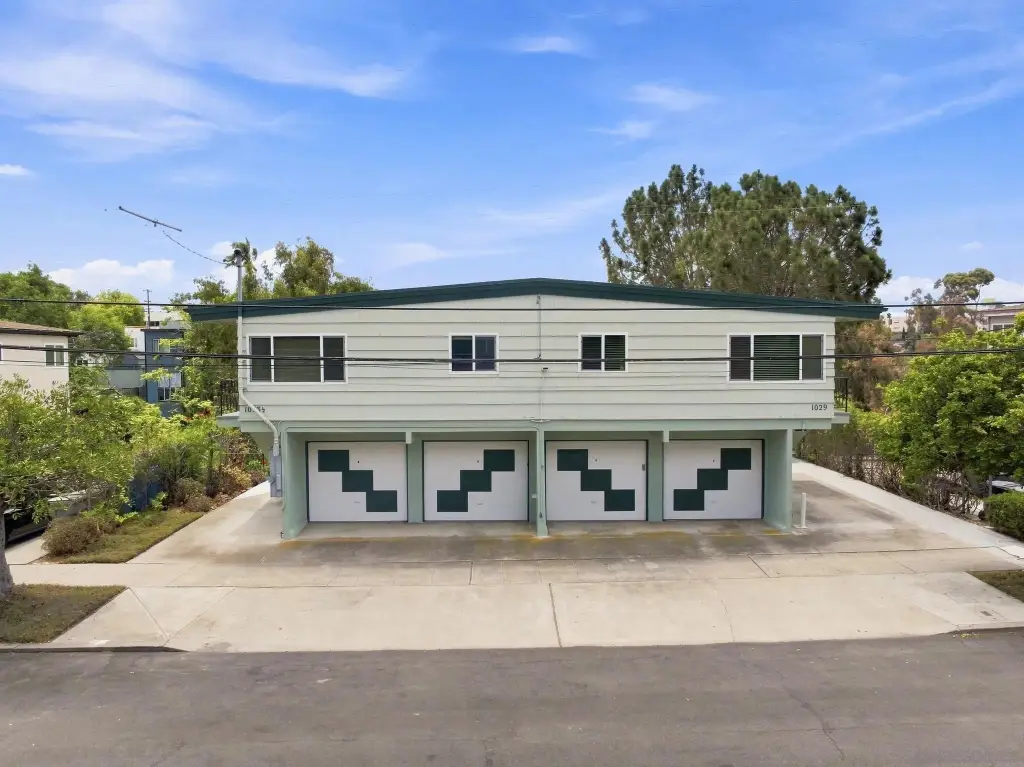
Garage
Subdivision
MISSION HILLS (92103)
Standard status
Pending
APN
444-373-02-00
Size
4,338 SF
Building Details
Floors in Building
2
Number of units
6
Flooring type
Wood
Listing Agency:
ENG Properties
(619) 574-0259
Listed By:
Katy Sullivan · License #01925534
(619) 994-5802
Added: Aug 31
Changed: Sep 28
Last Checked: Oct 16 at 9:06AM
MLS# 260021301
Copyright © 2026 San Diego MLS. All rights reserved. All information provided by the listing agent/broker is deemed reliable but is not guaranteed and should be independently verified.

Ask AI about this property
Review the available facts, identify missing information and prepare questions for the agent.
Investment Insights
Based on property information with market context.
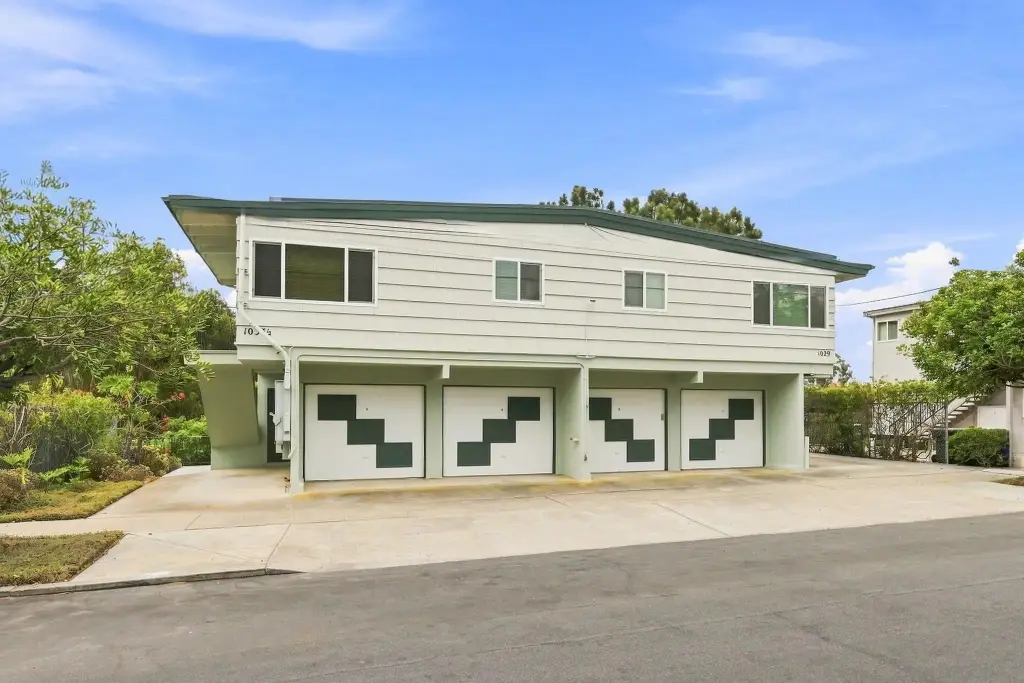
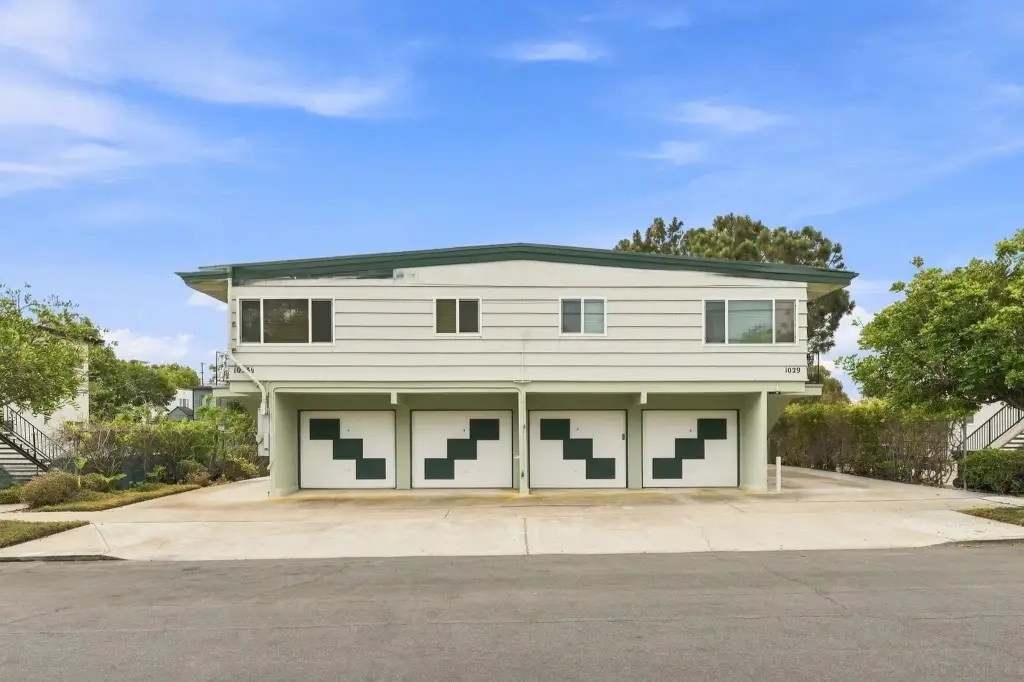
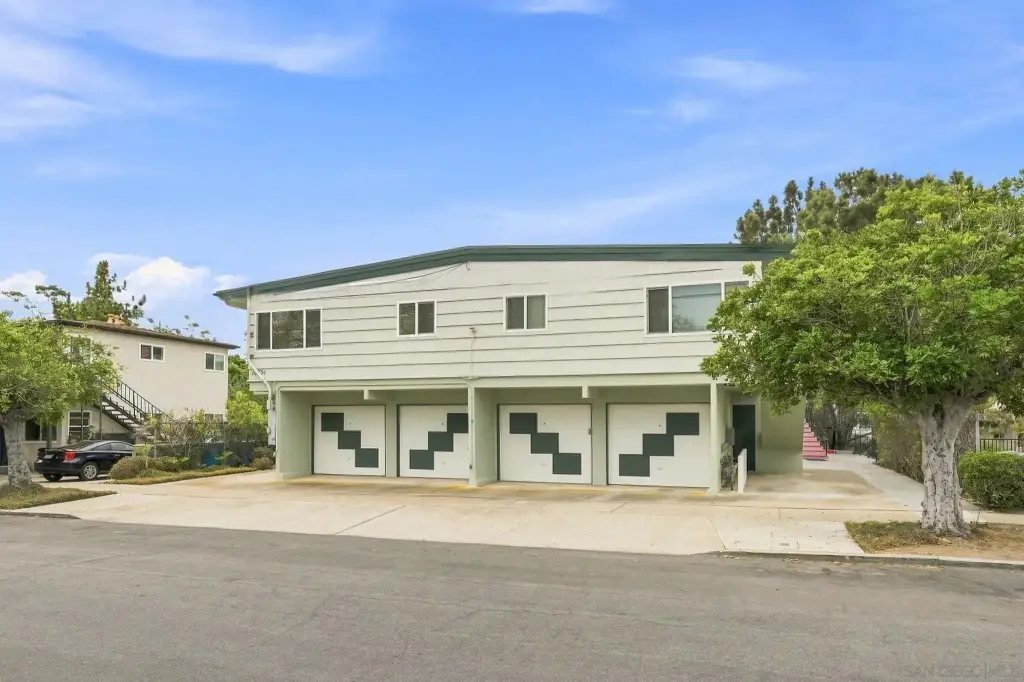
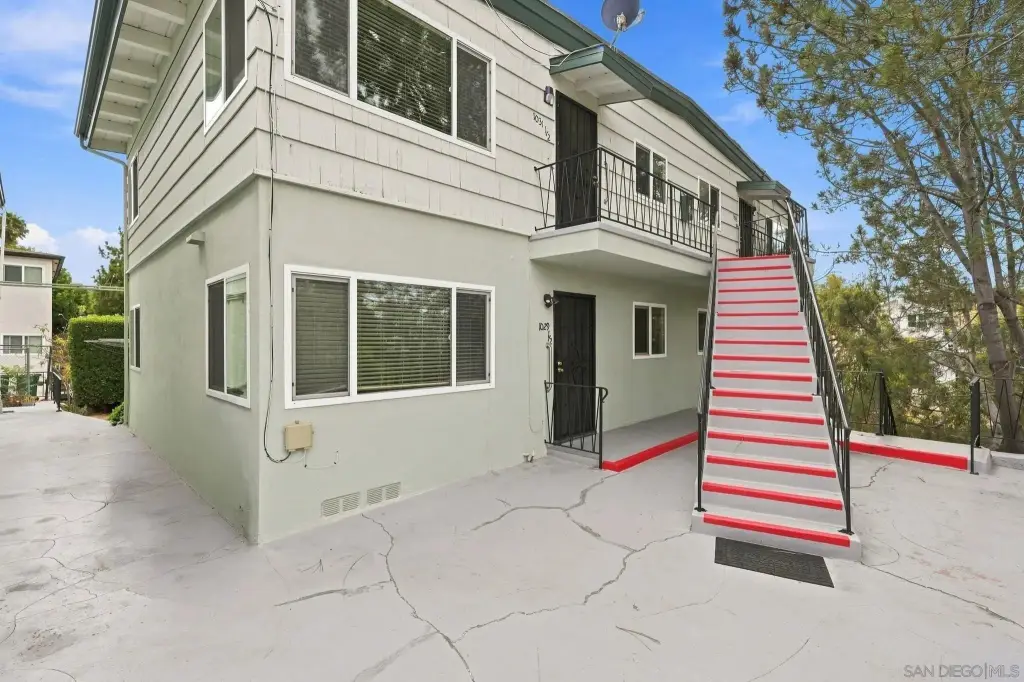
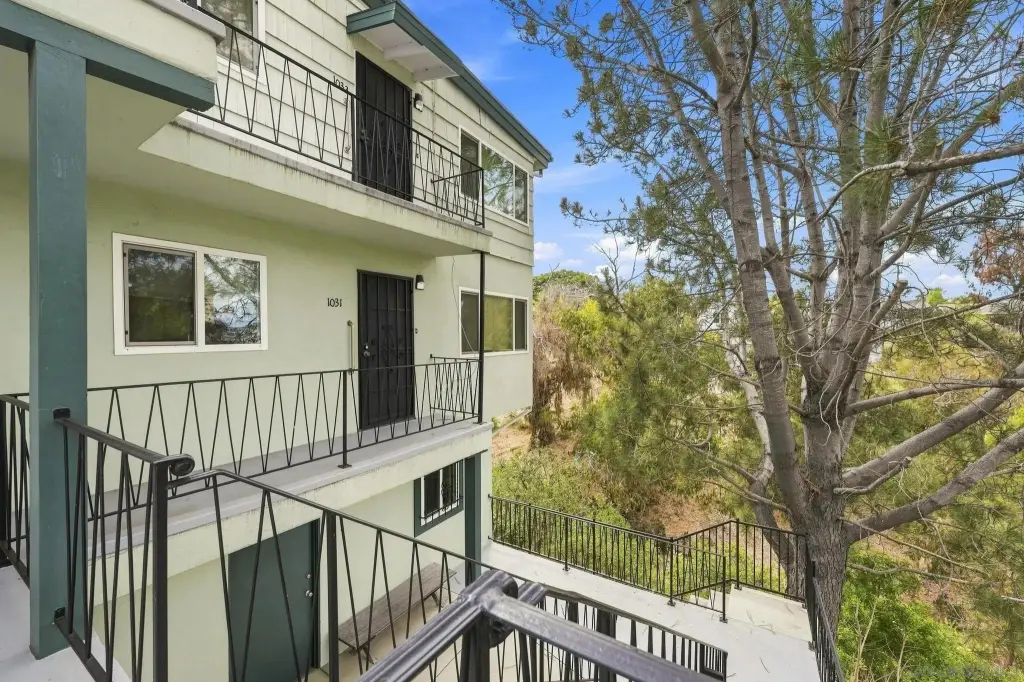
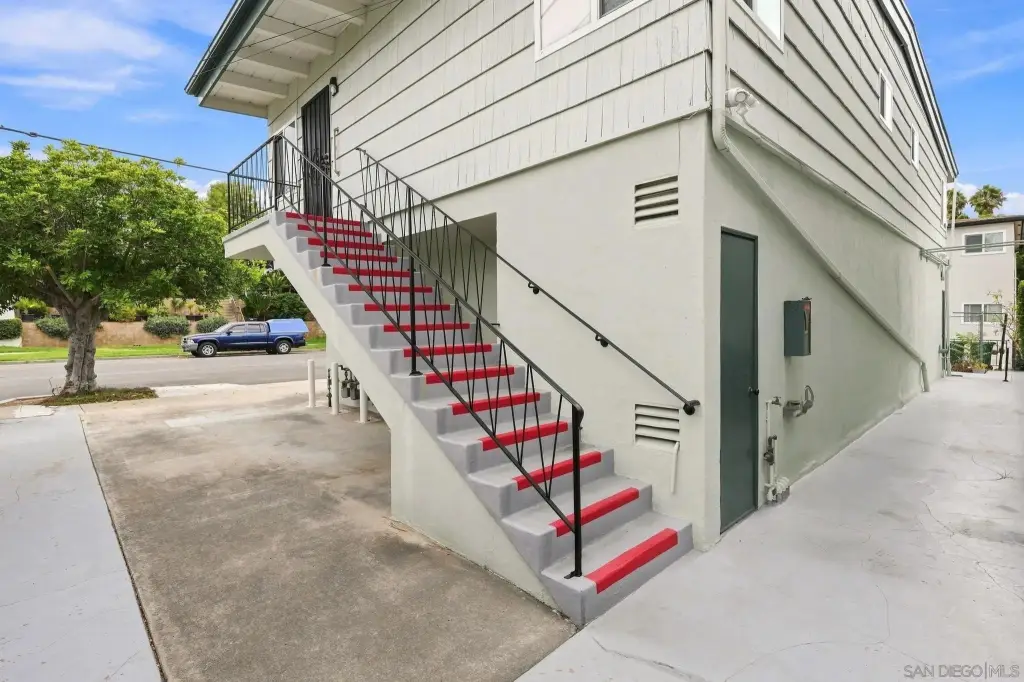
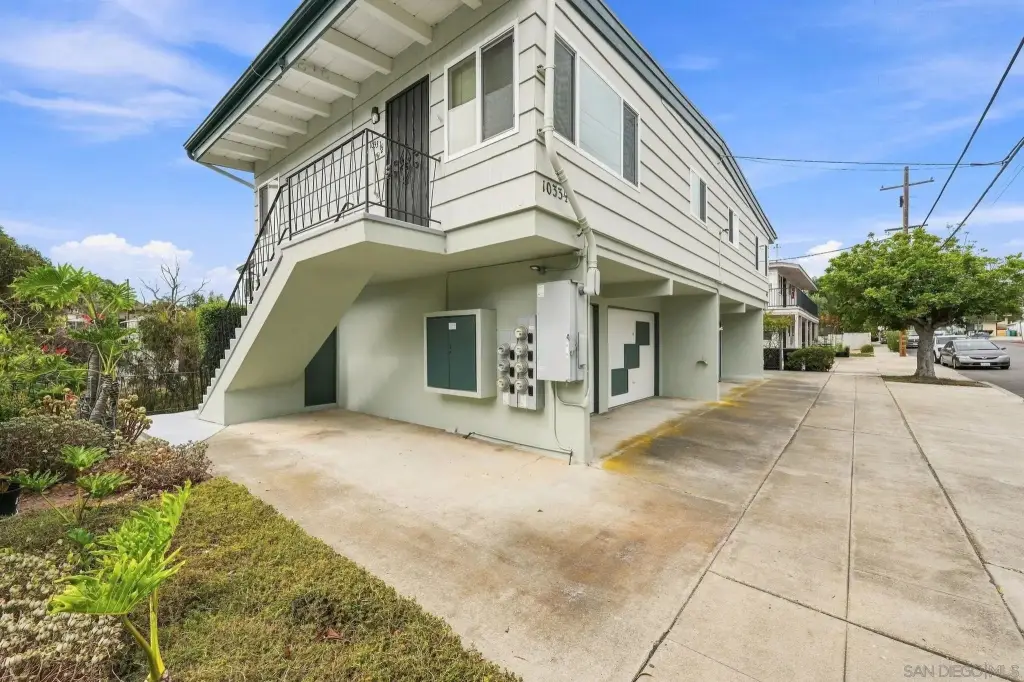
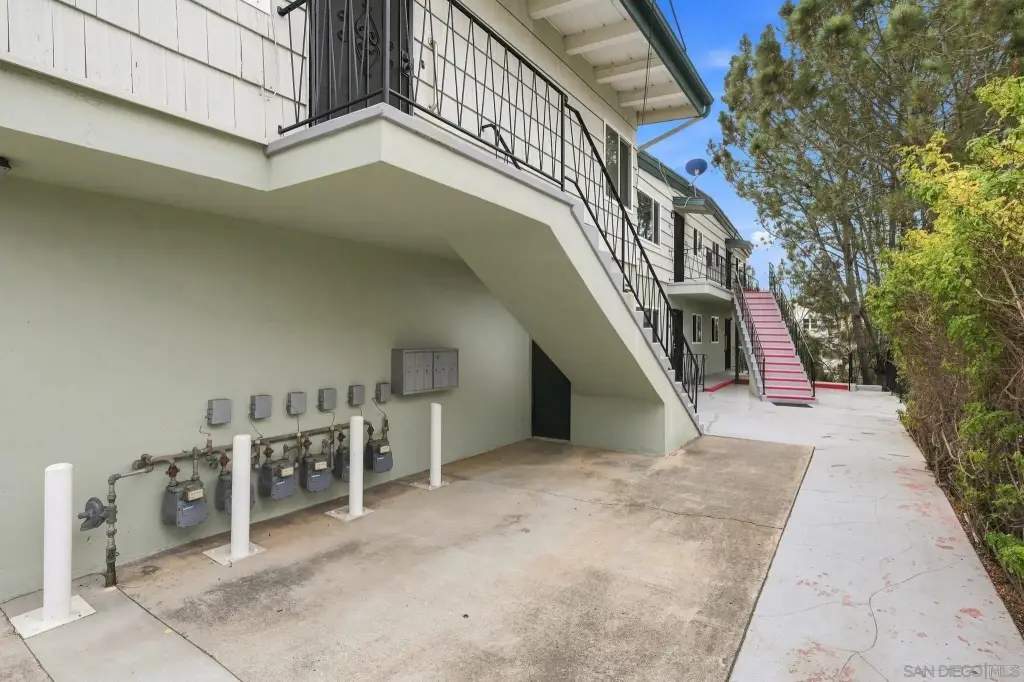
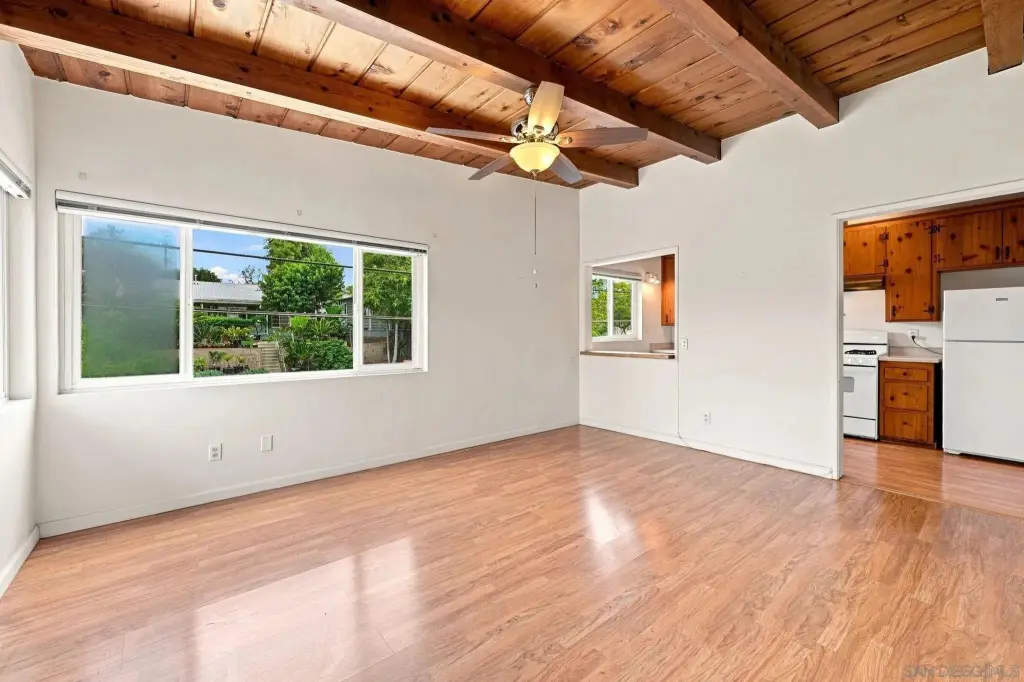
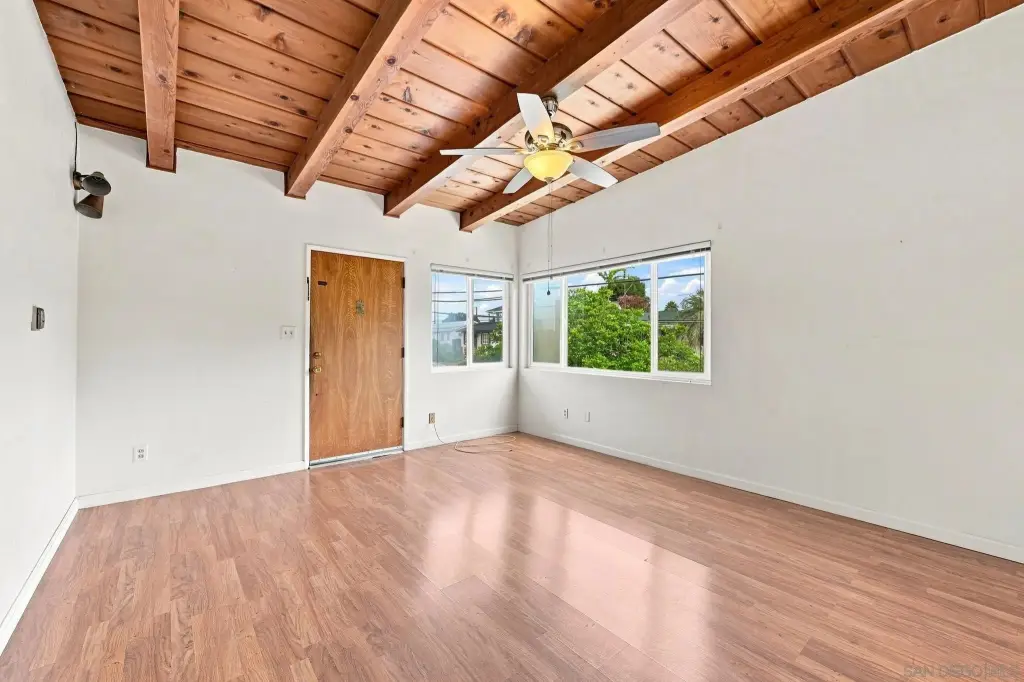
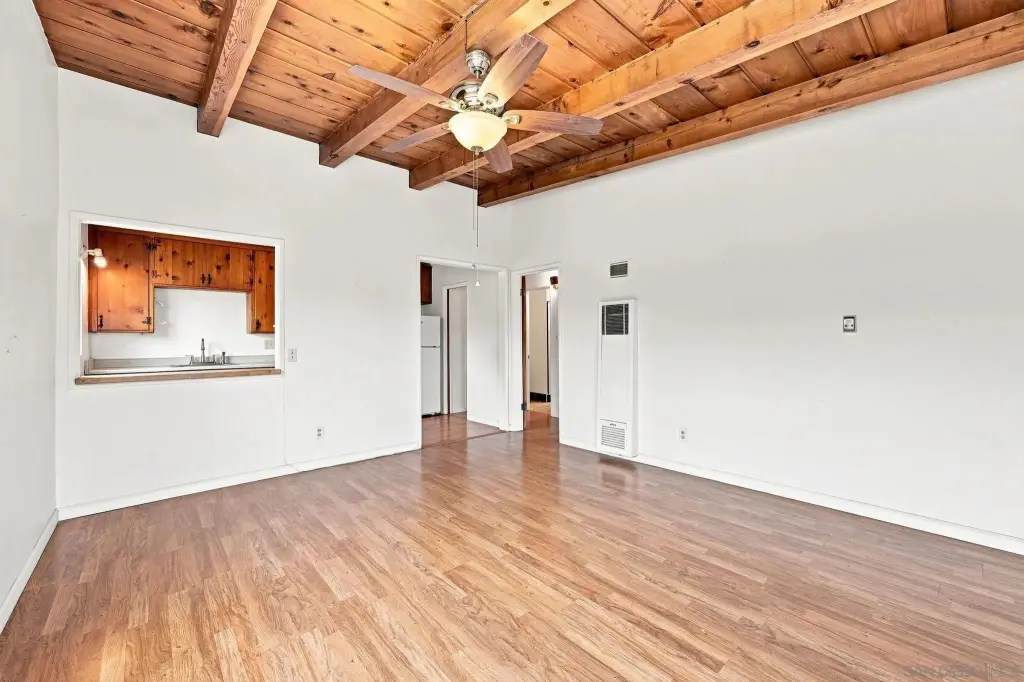
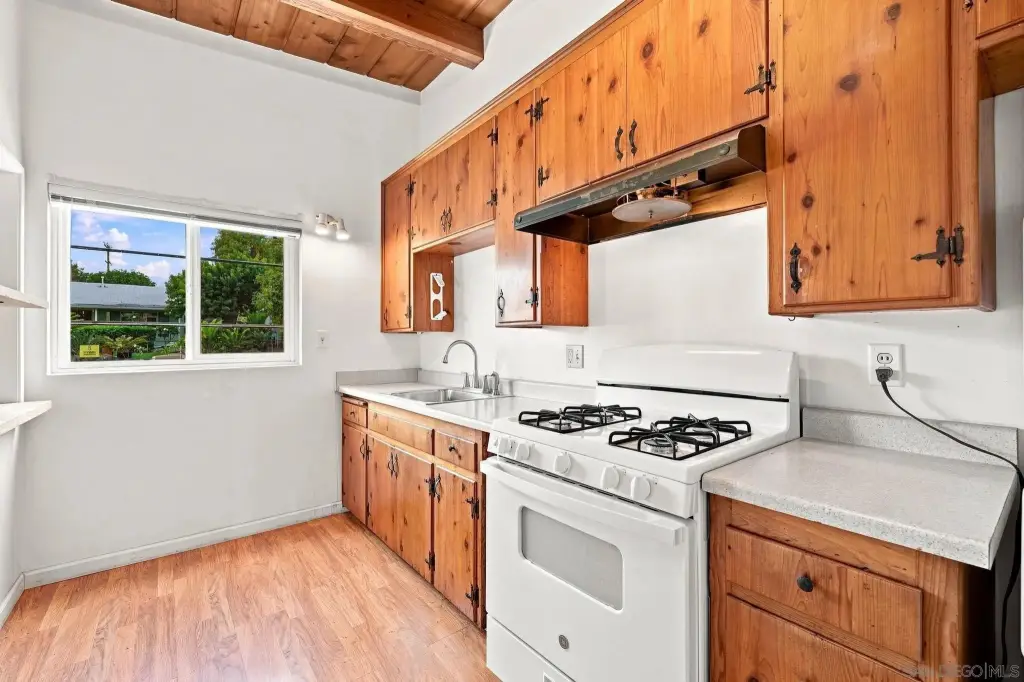
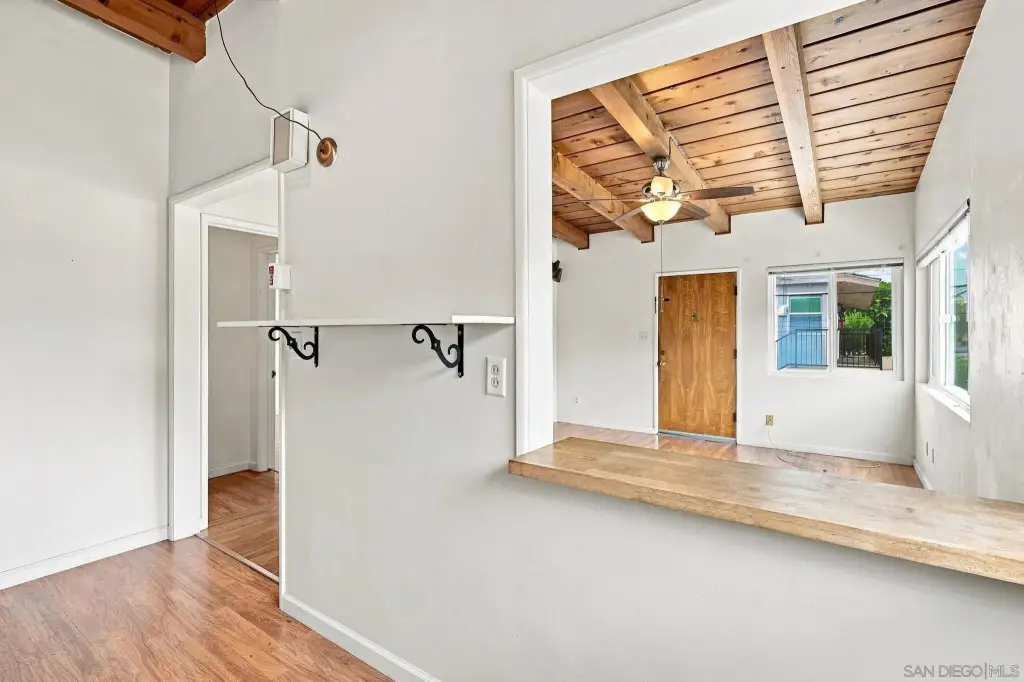
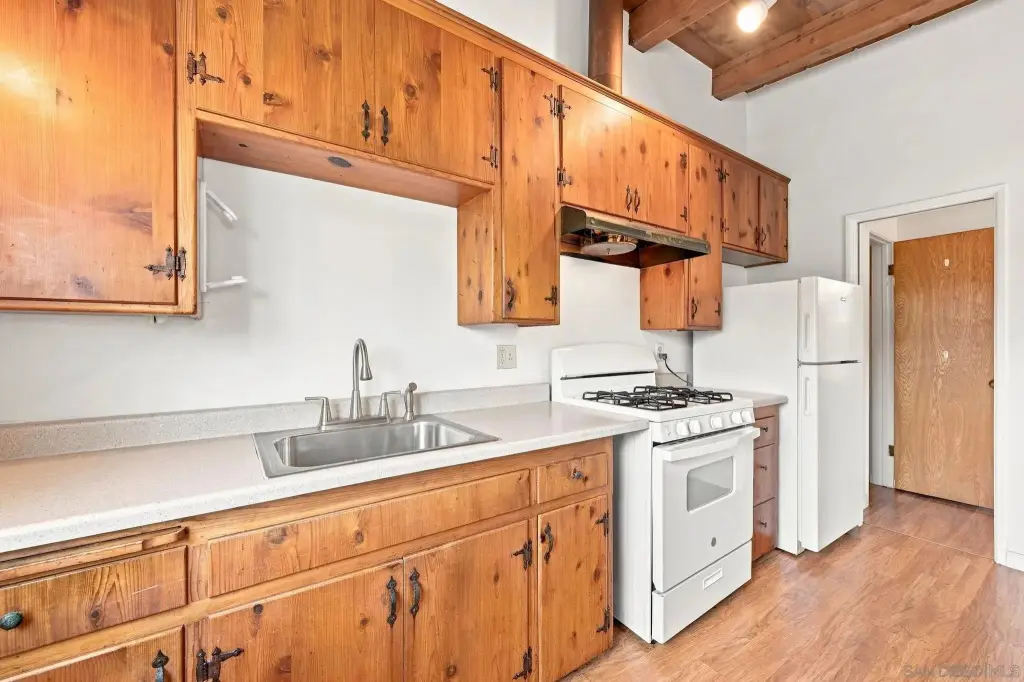
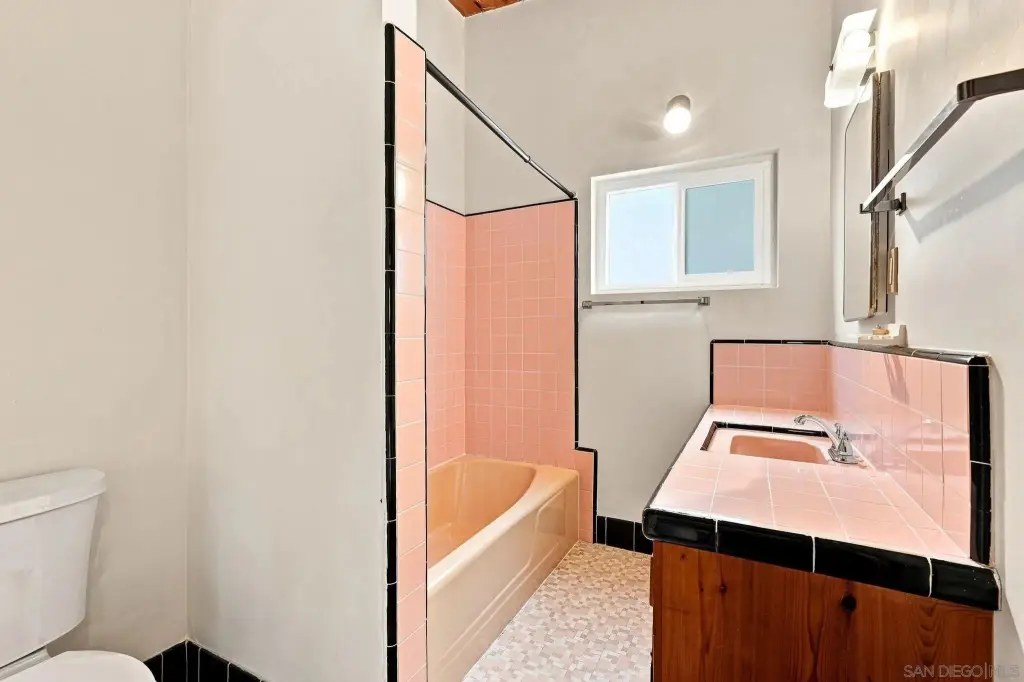
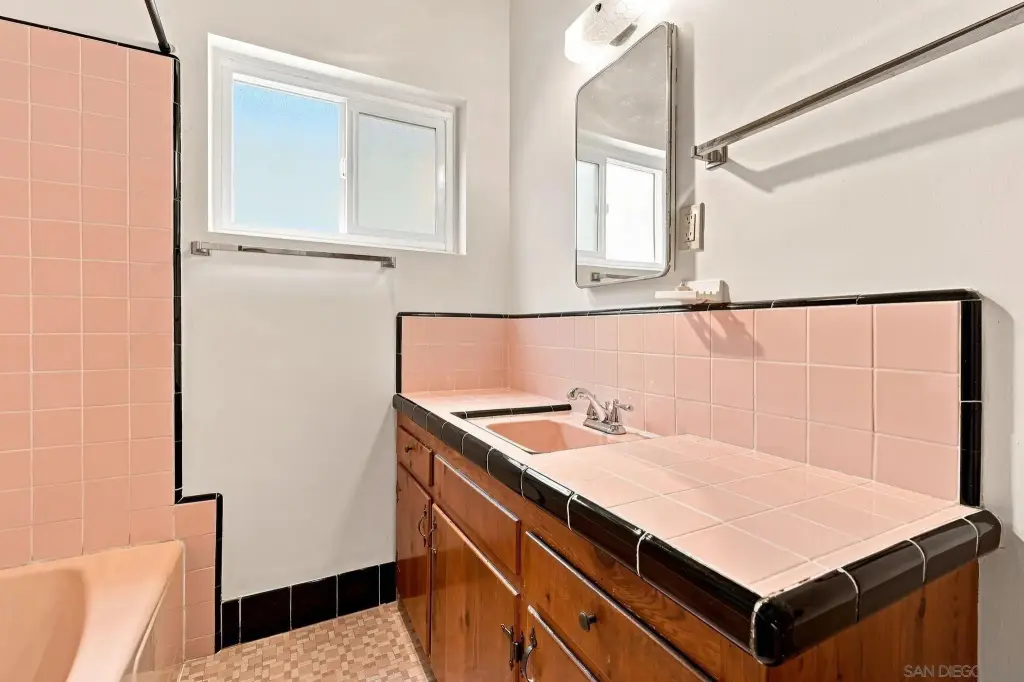
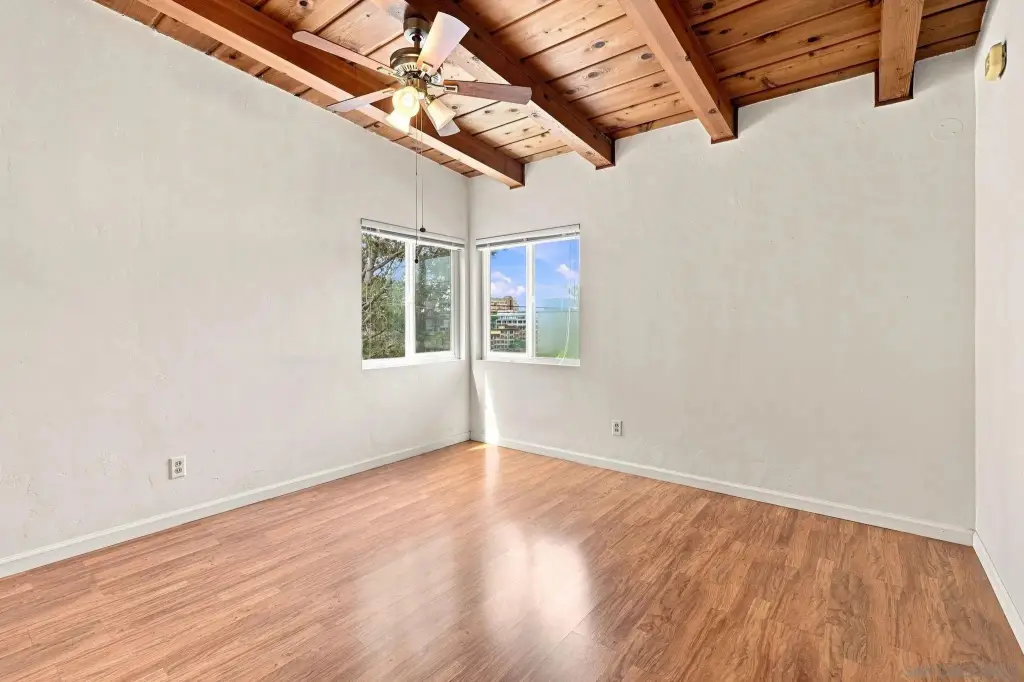
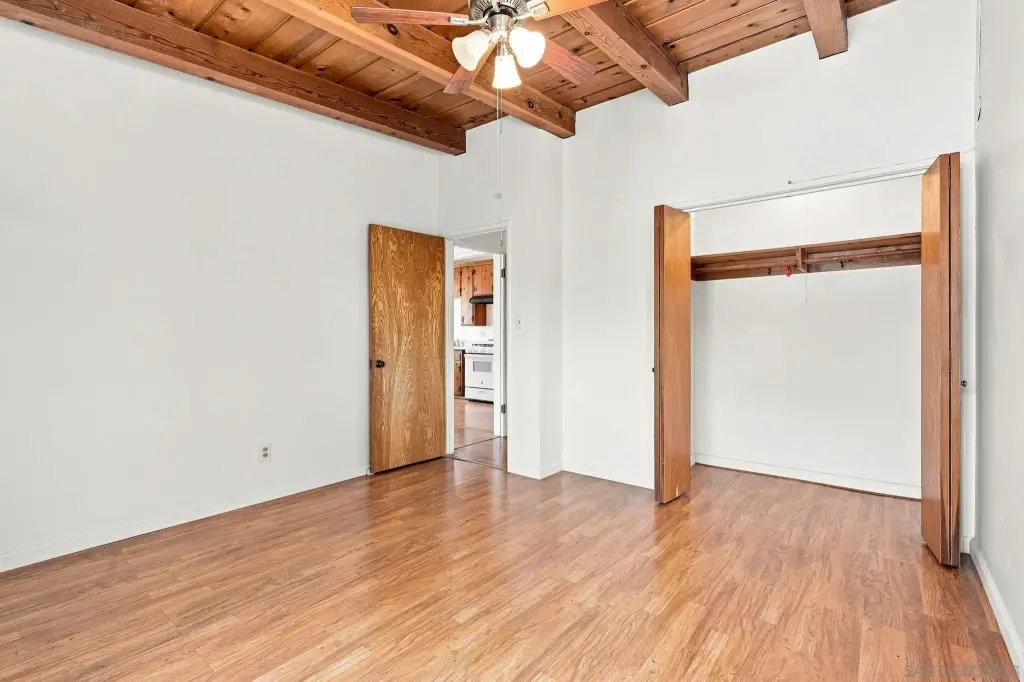
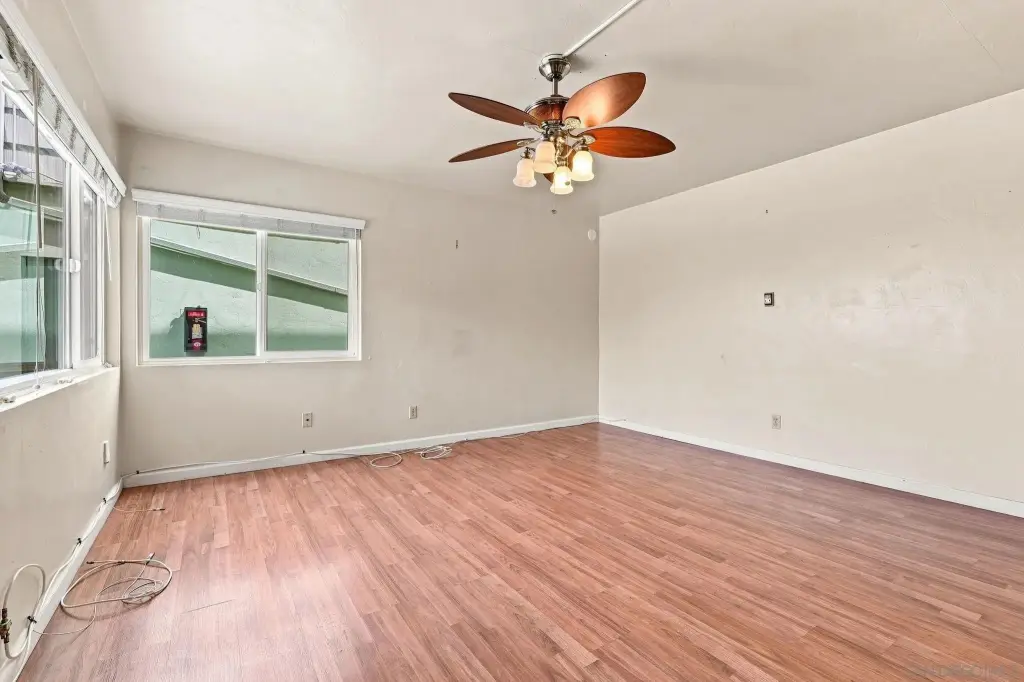
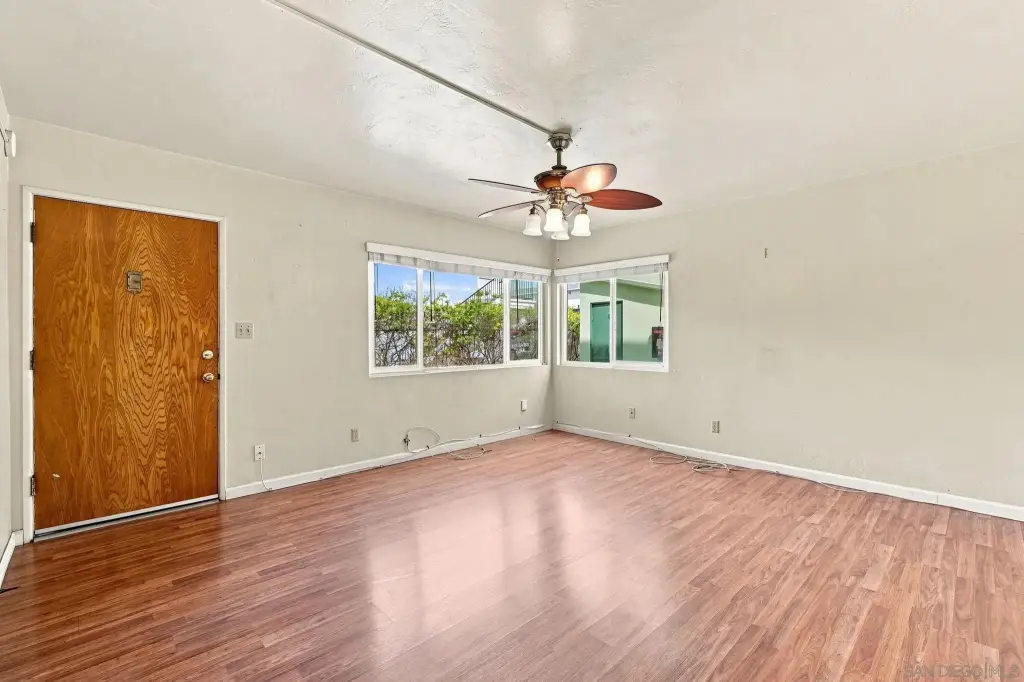
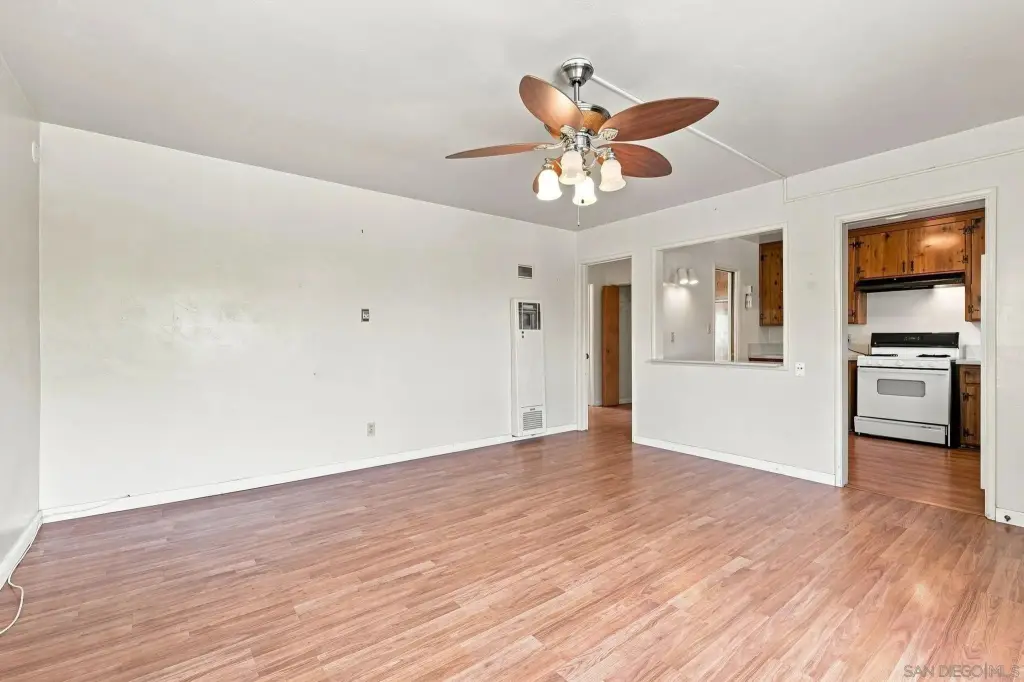
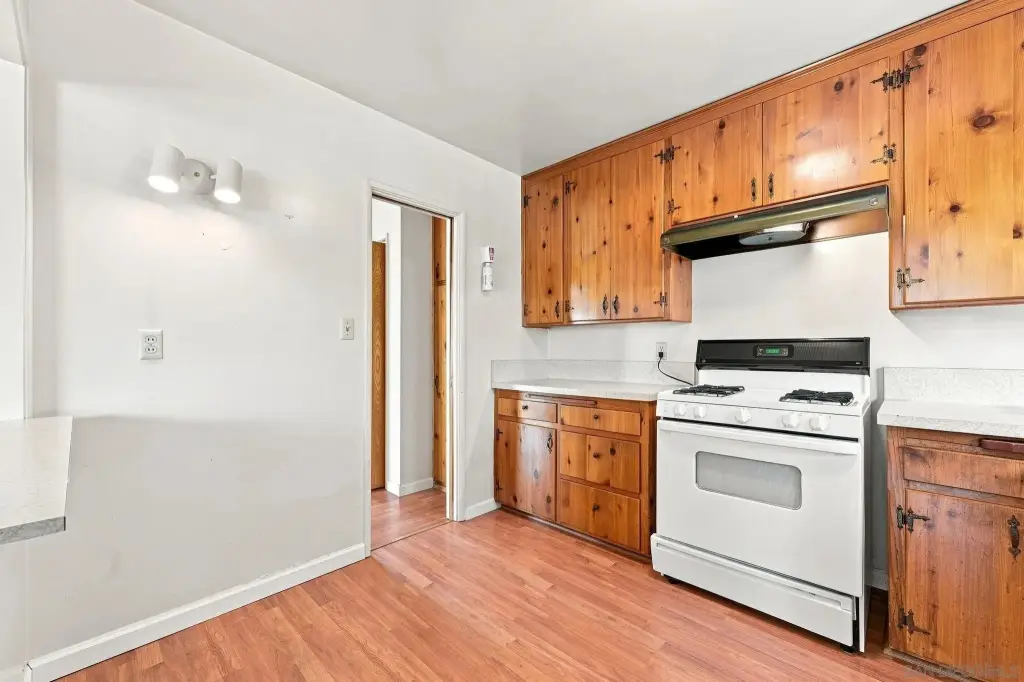
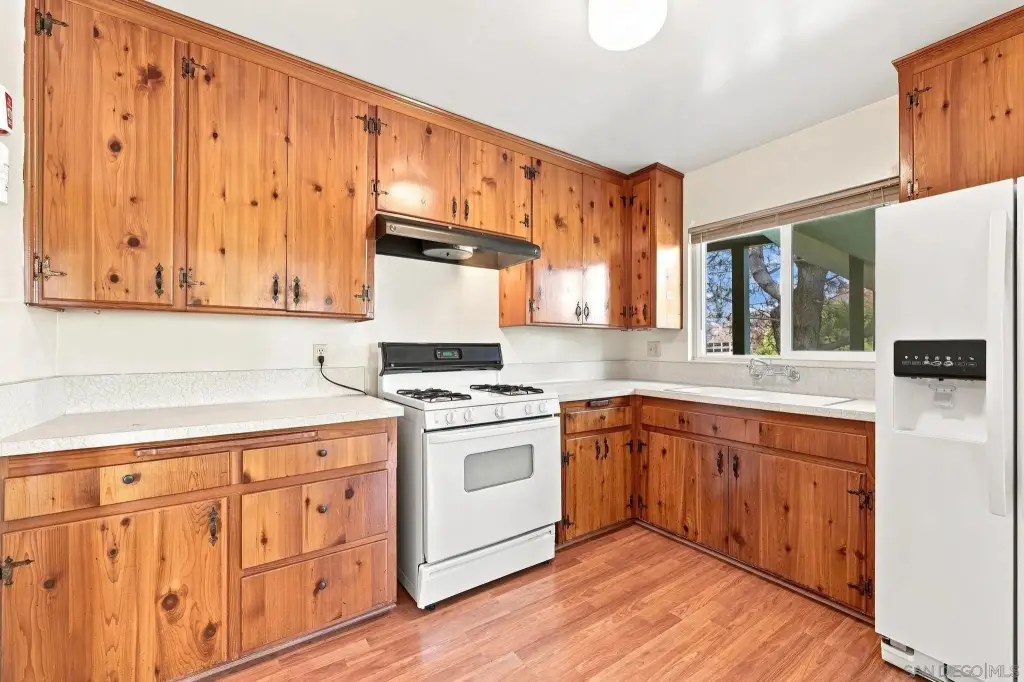
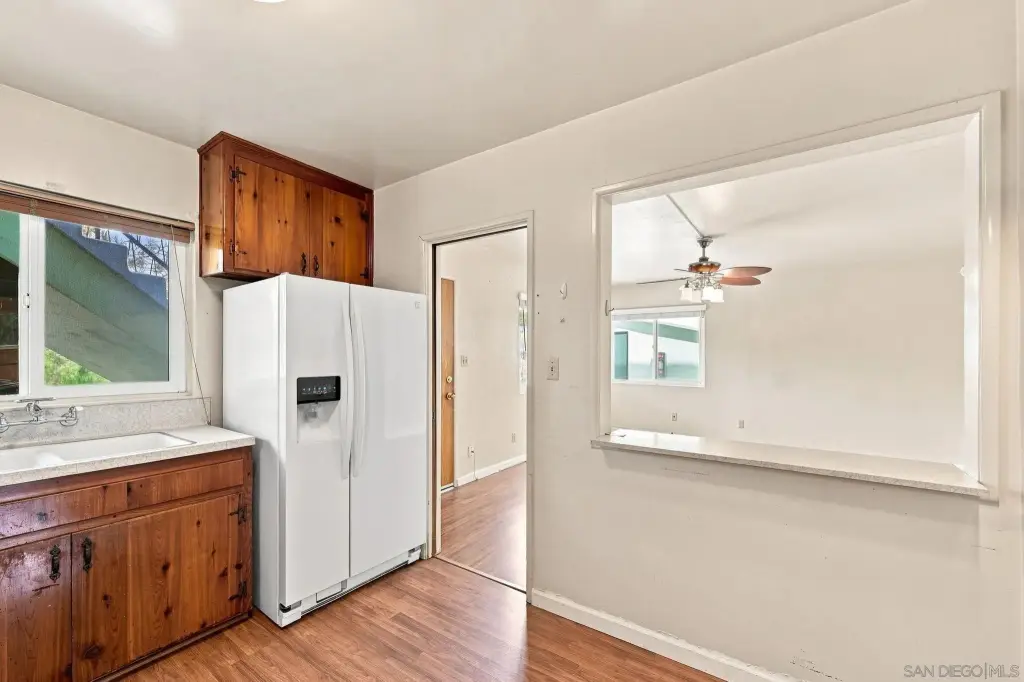
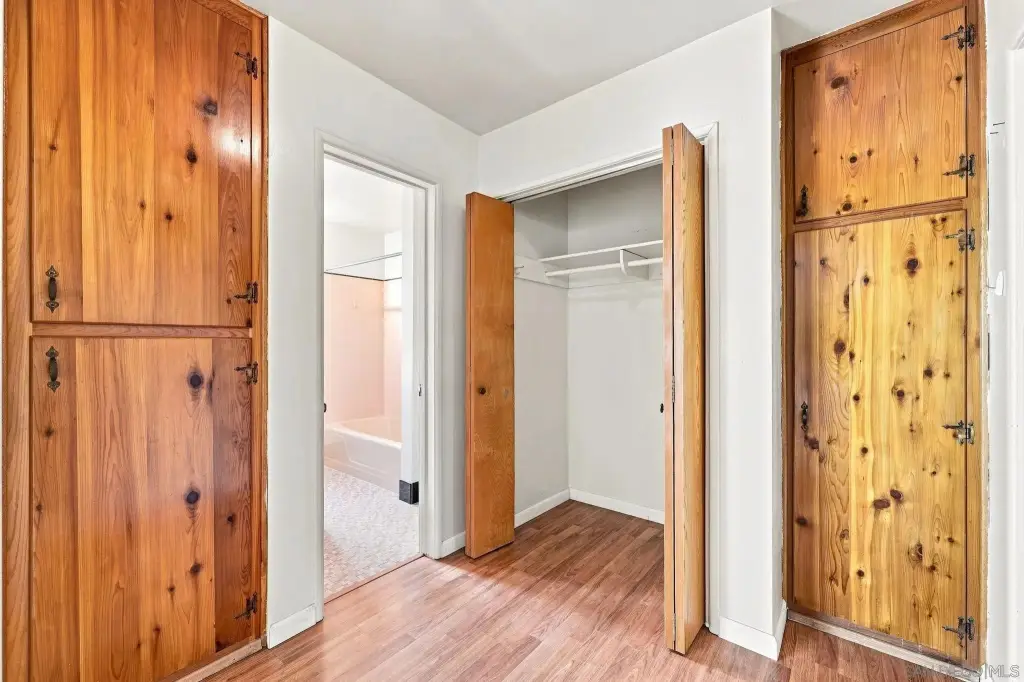
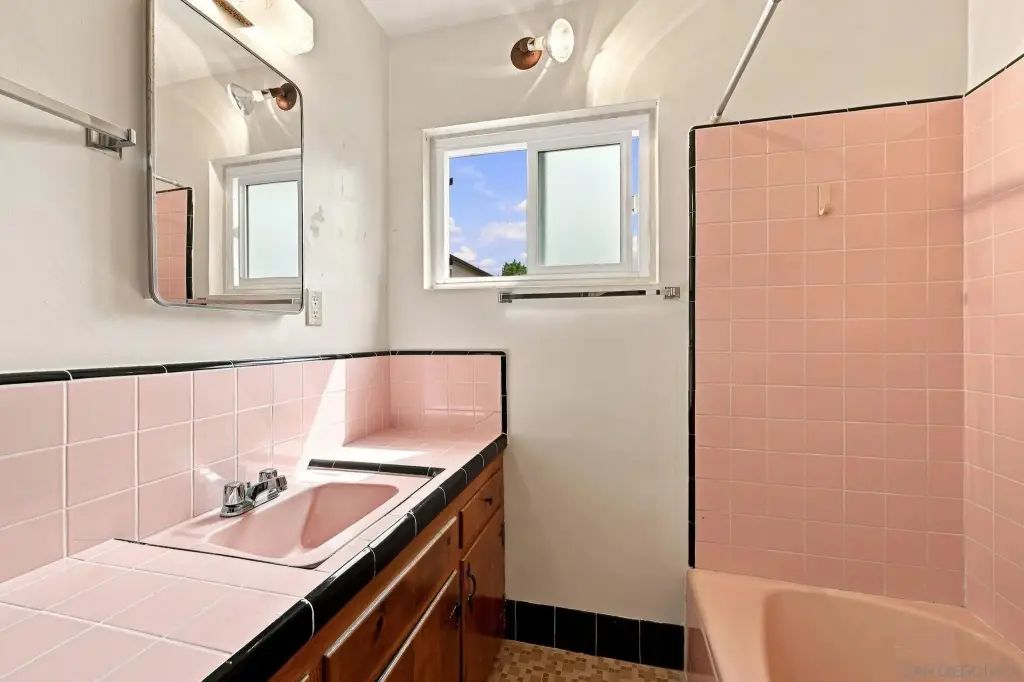
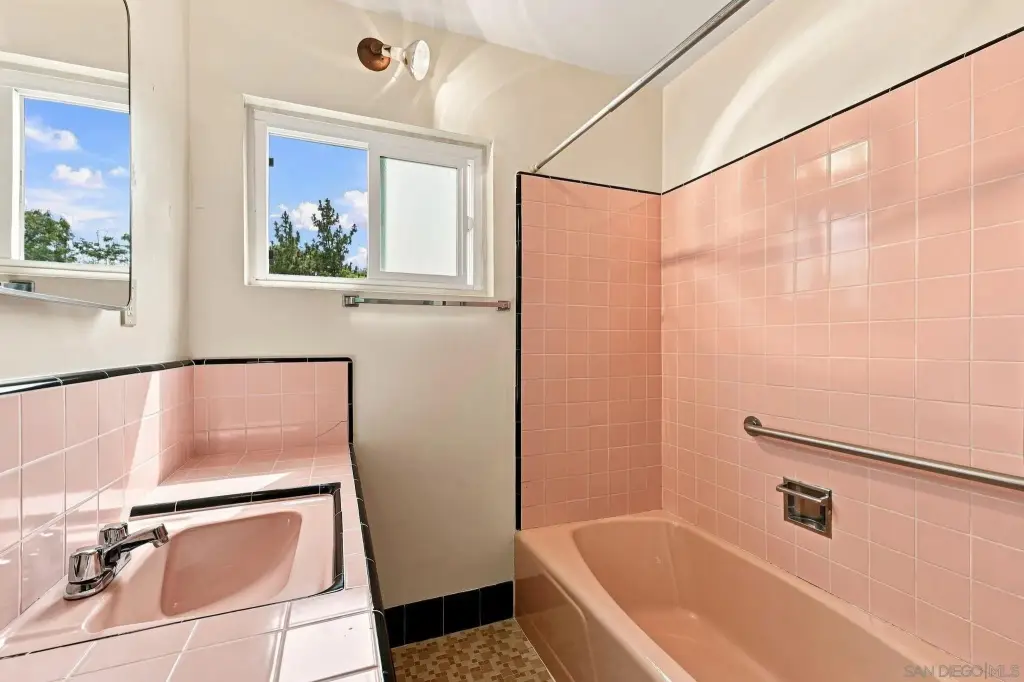
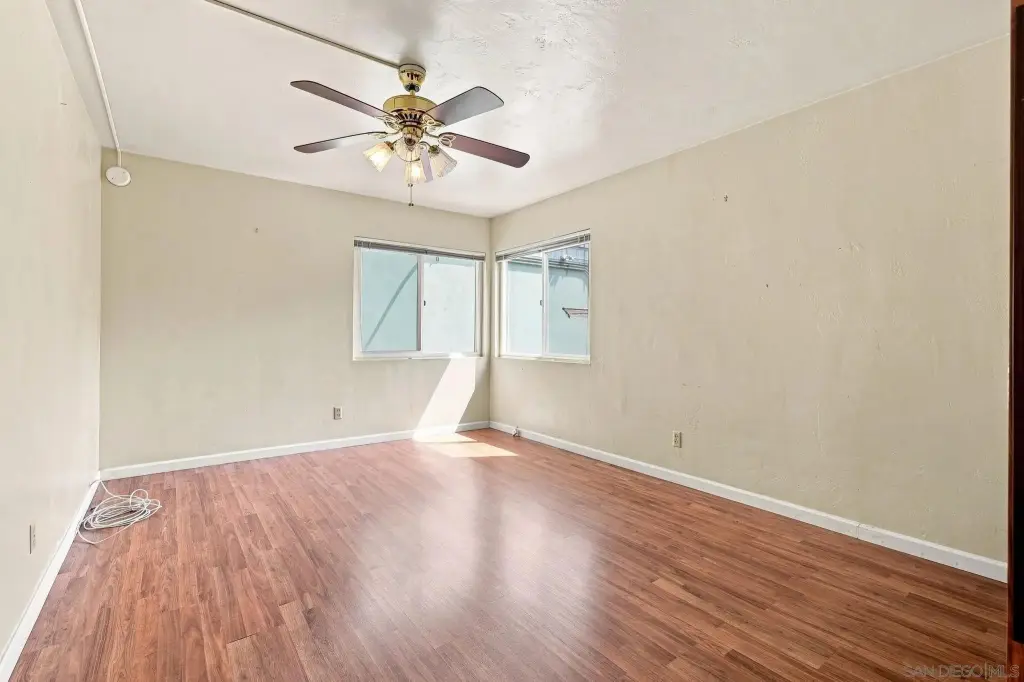
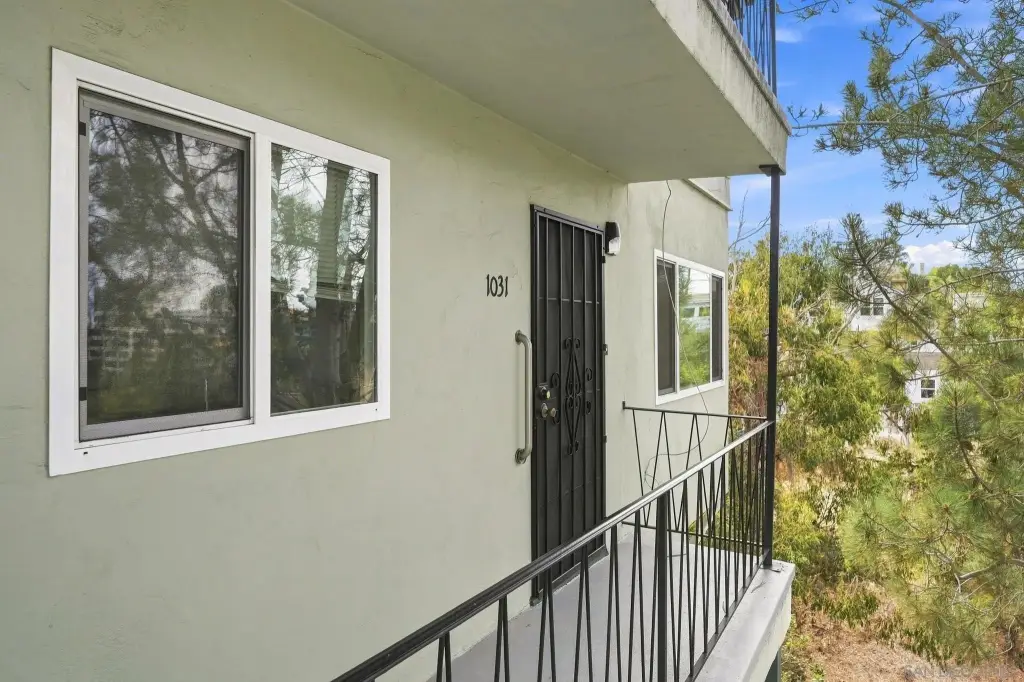
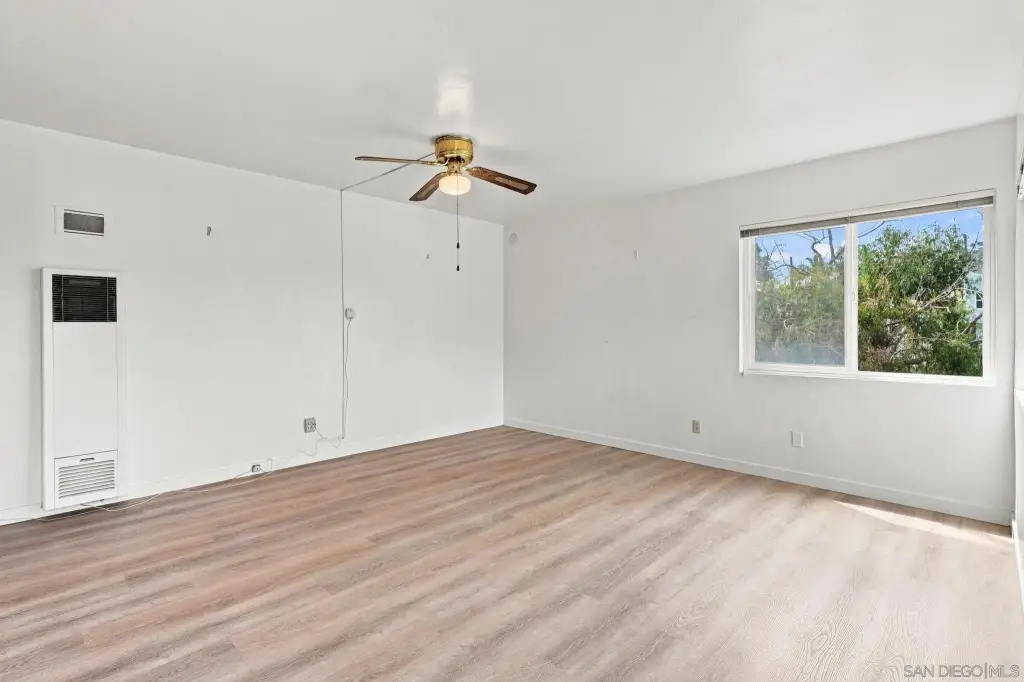
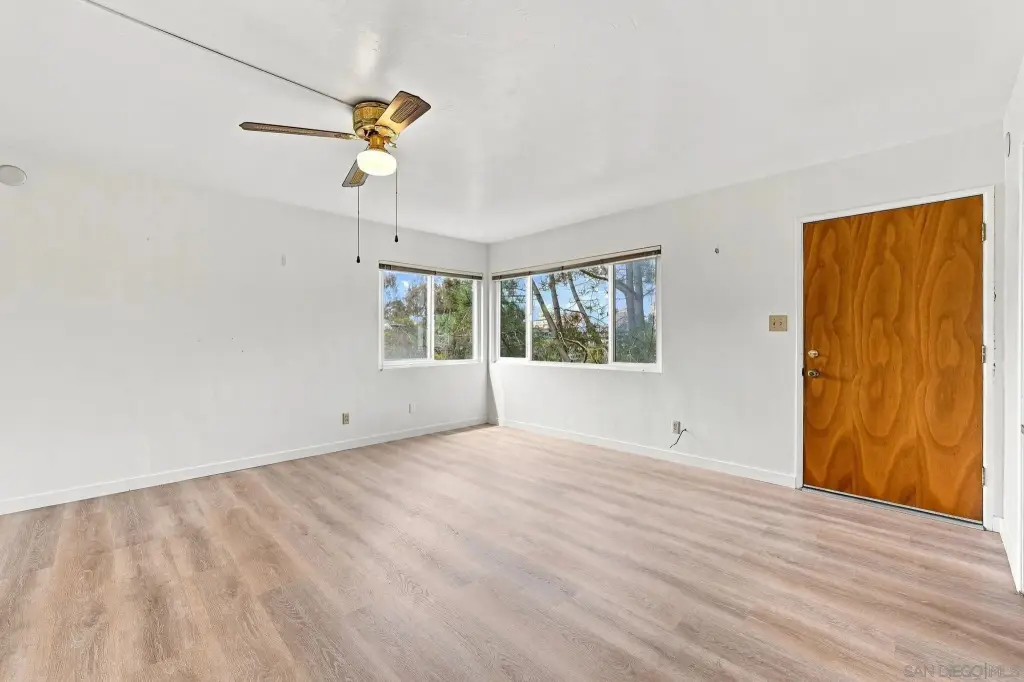
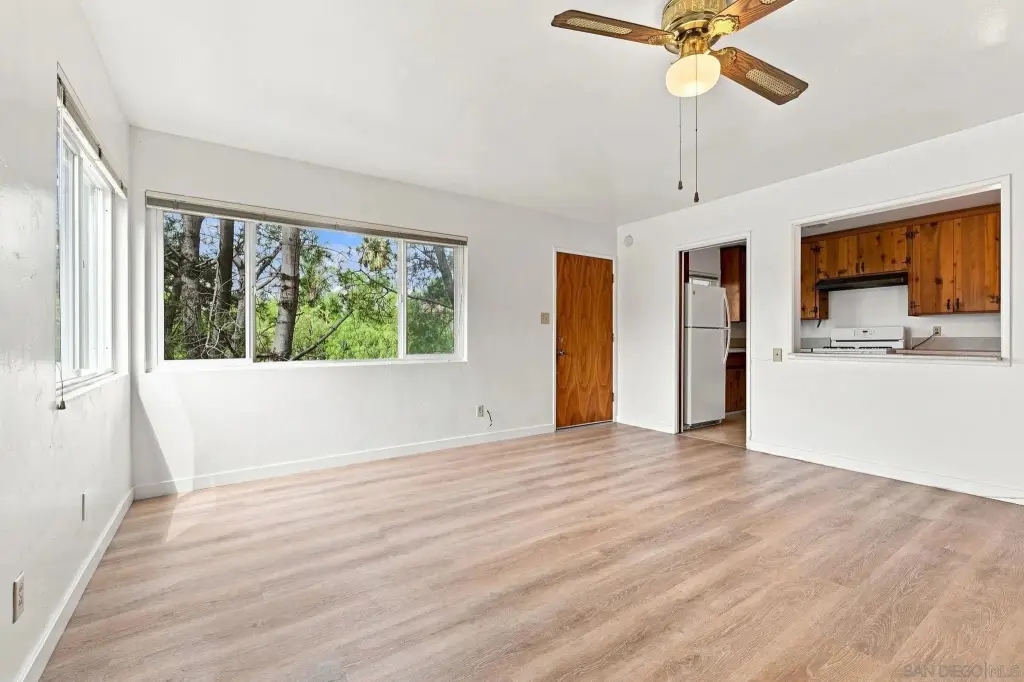
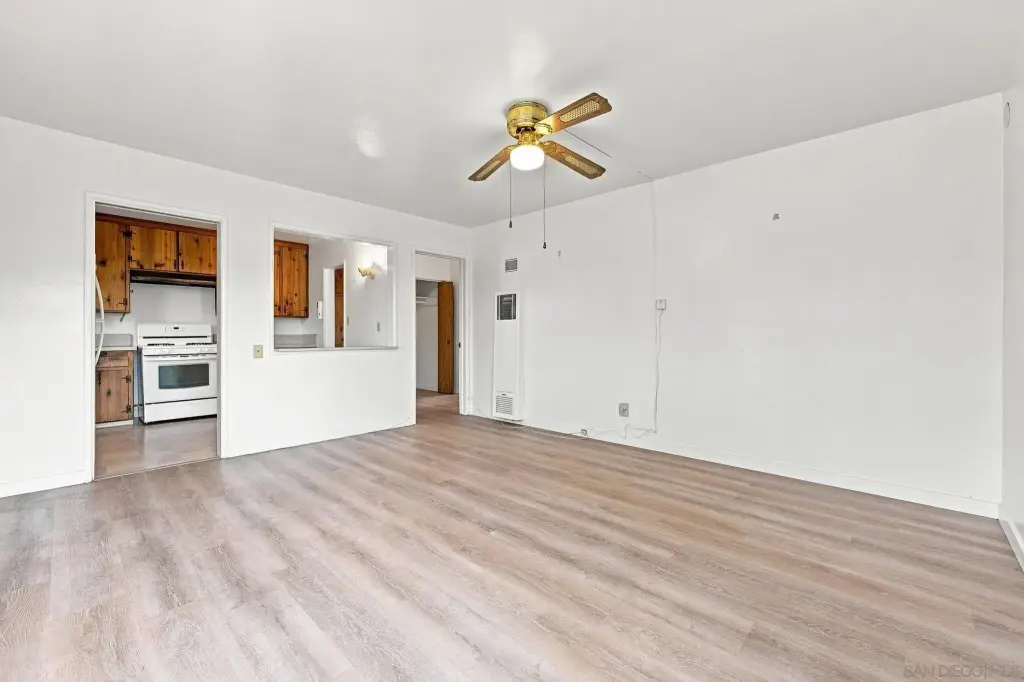
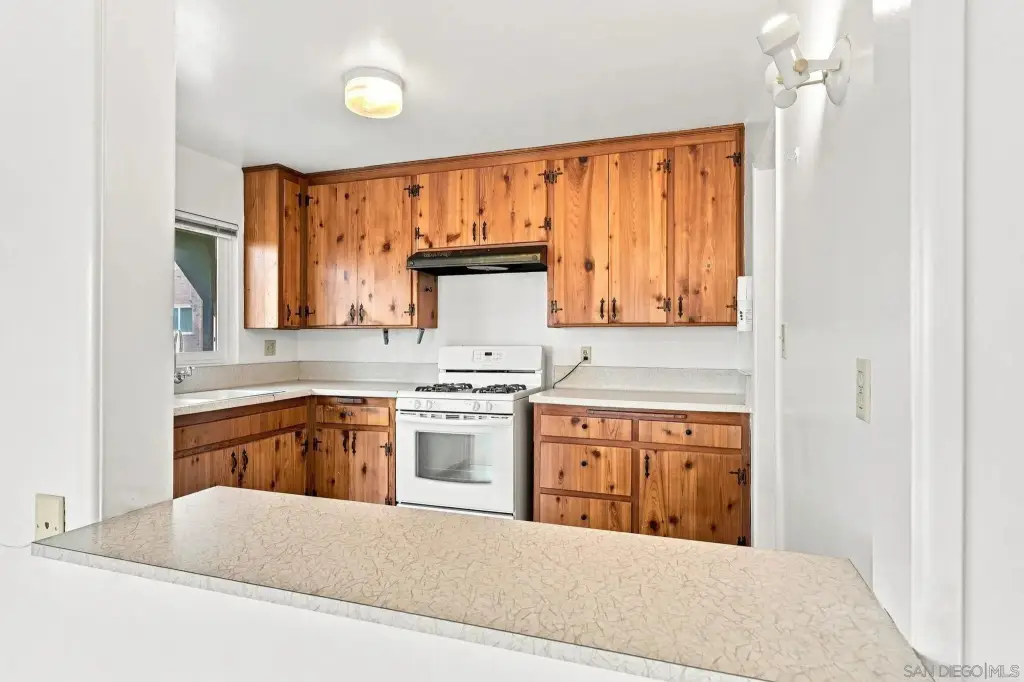
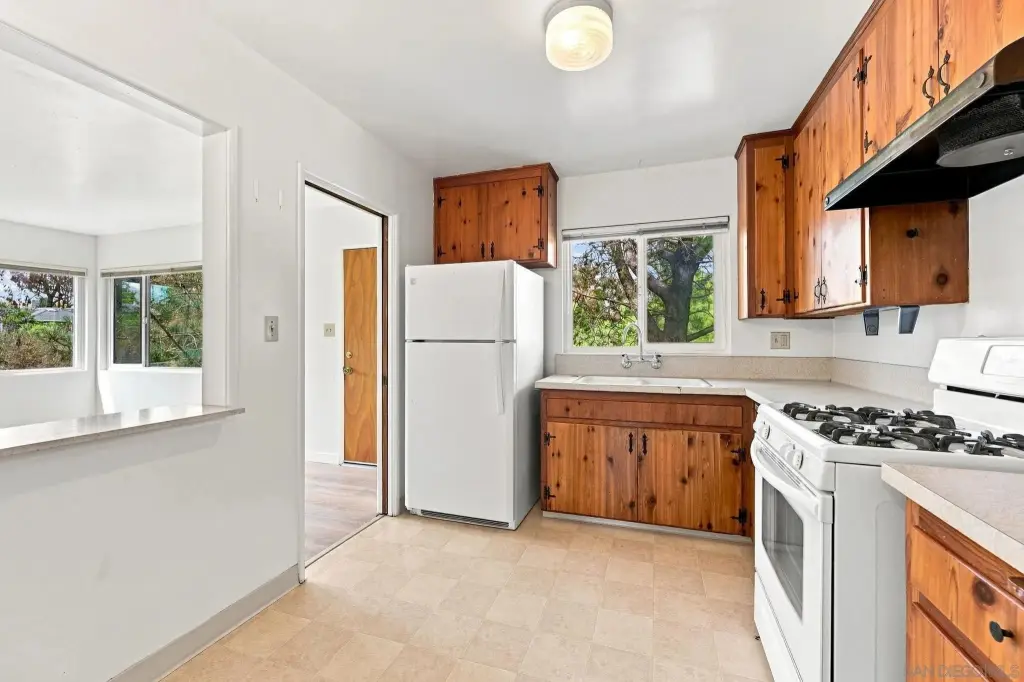
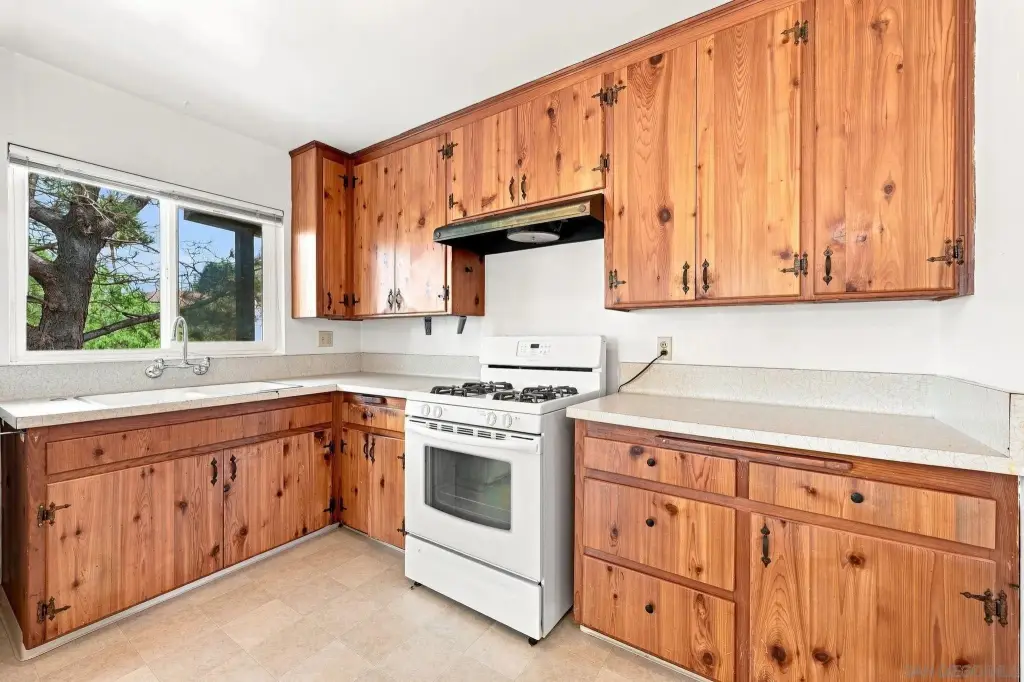
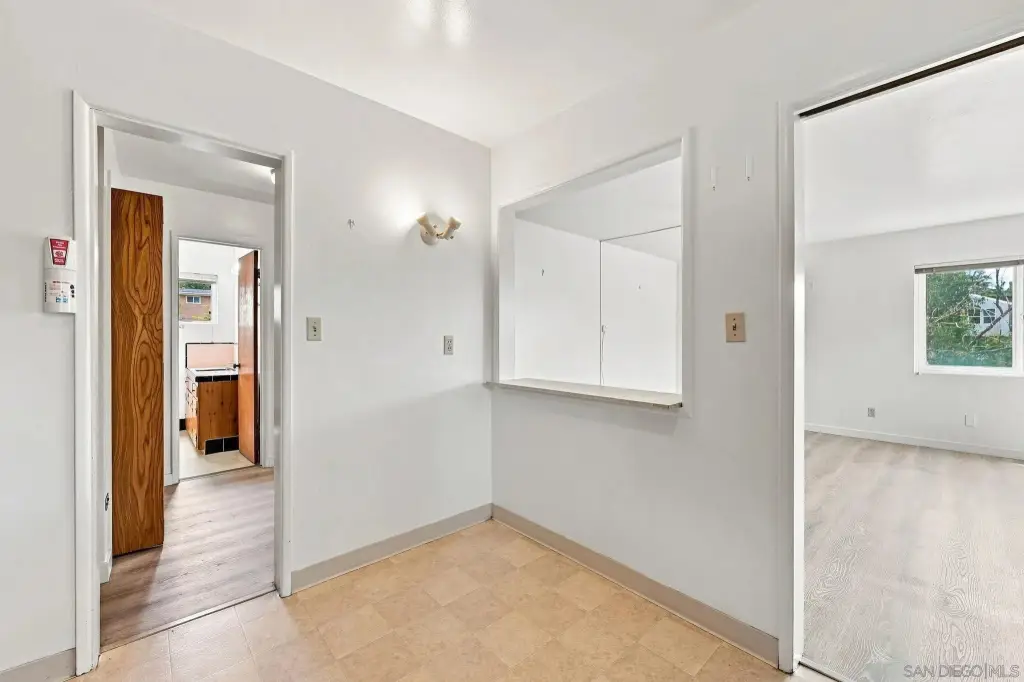
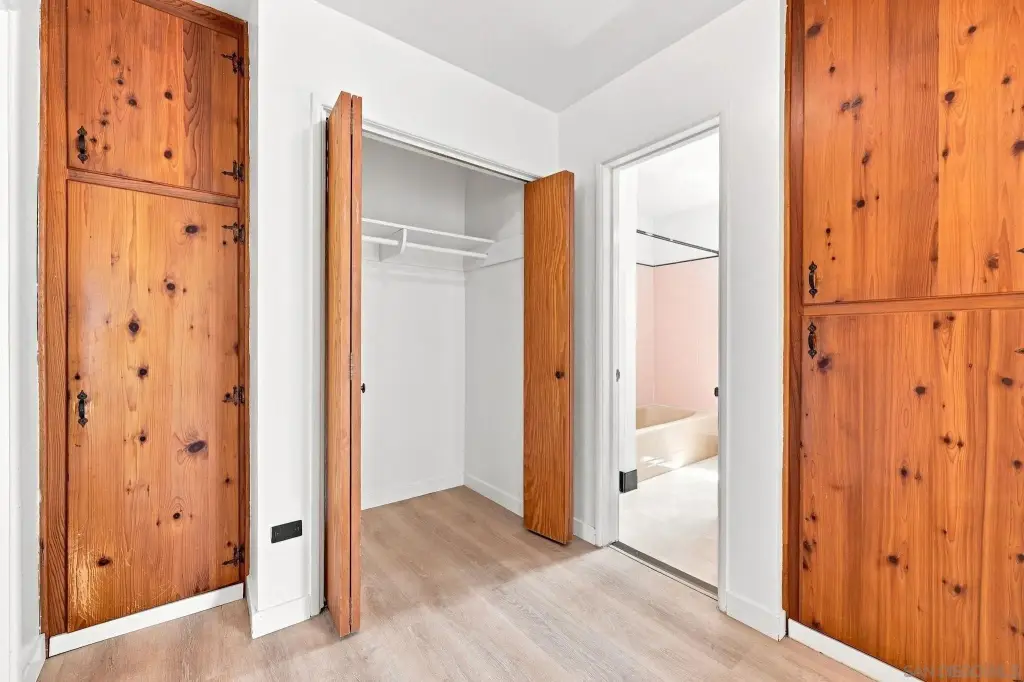
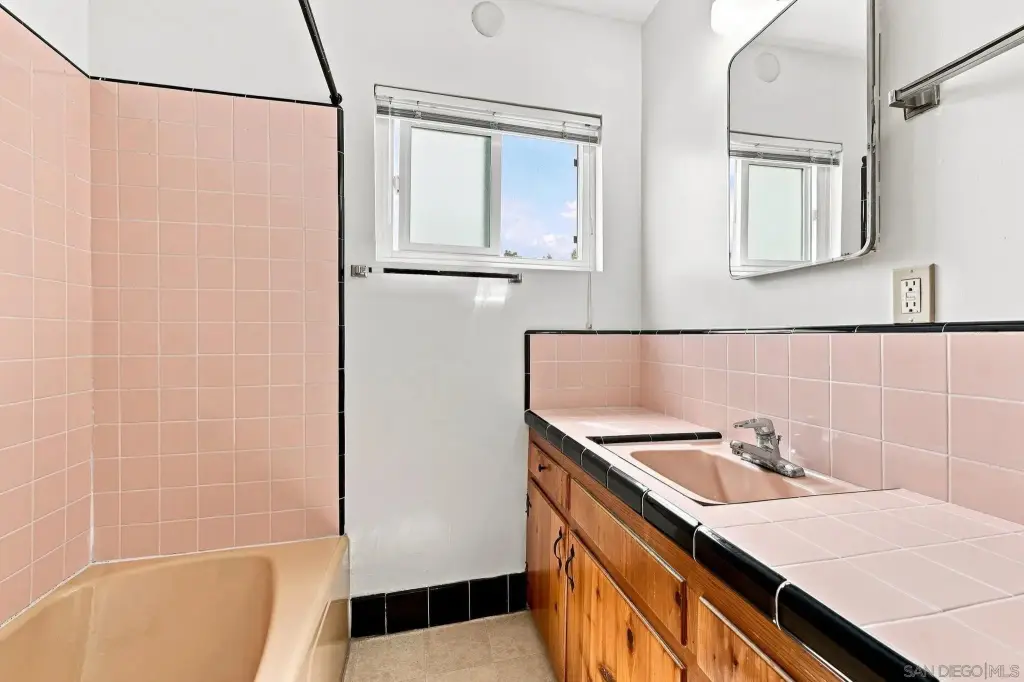
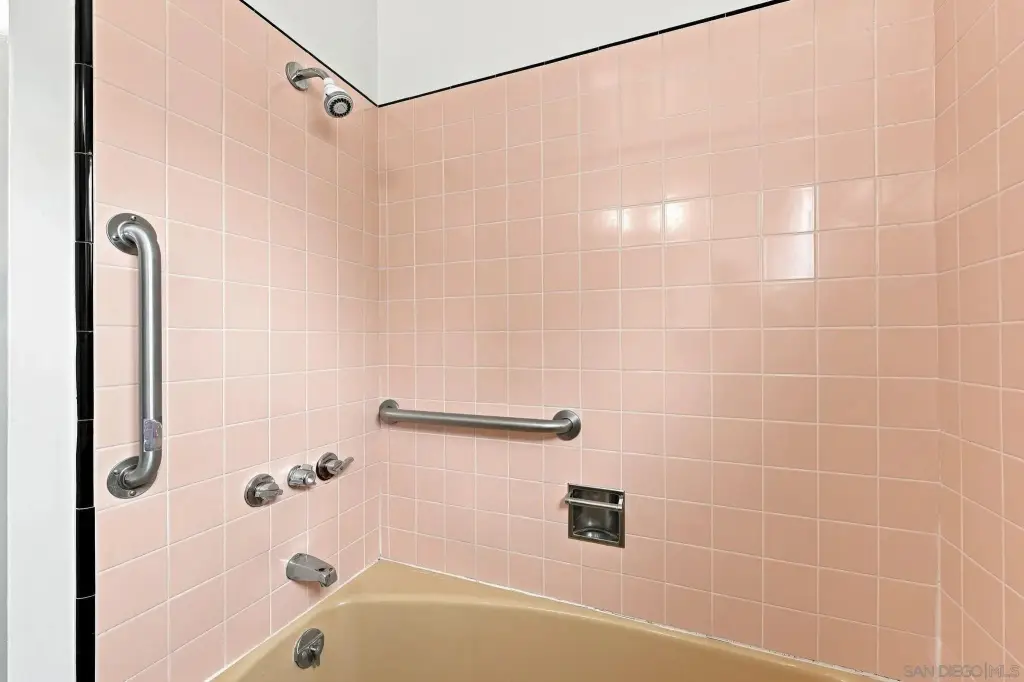
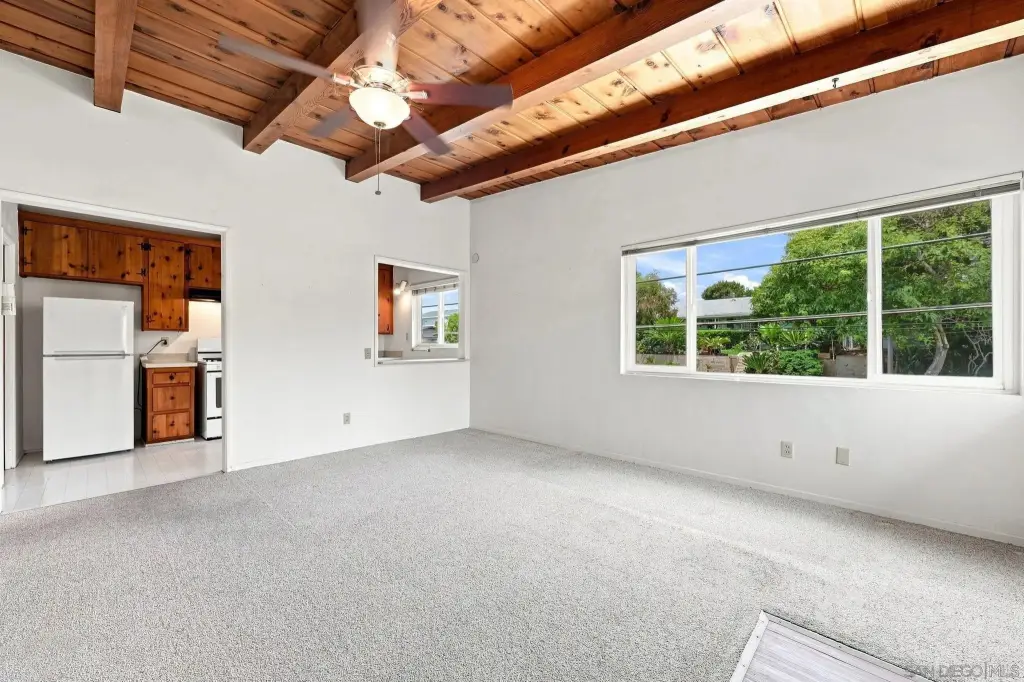
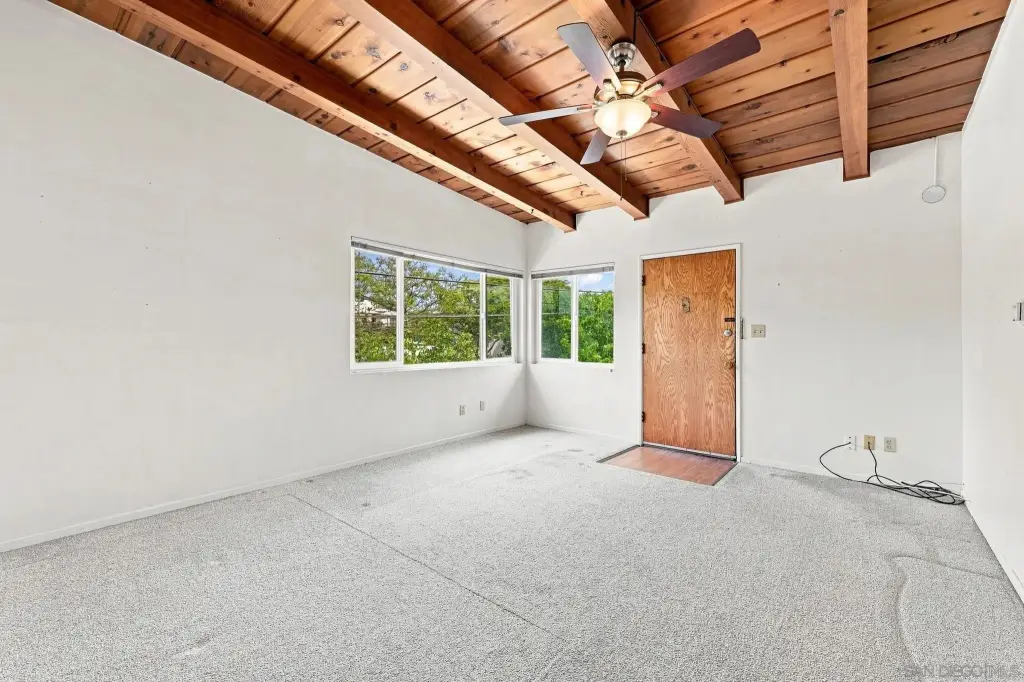
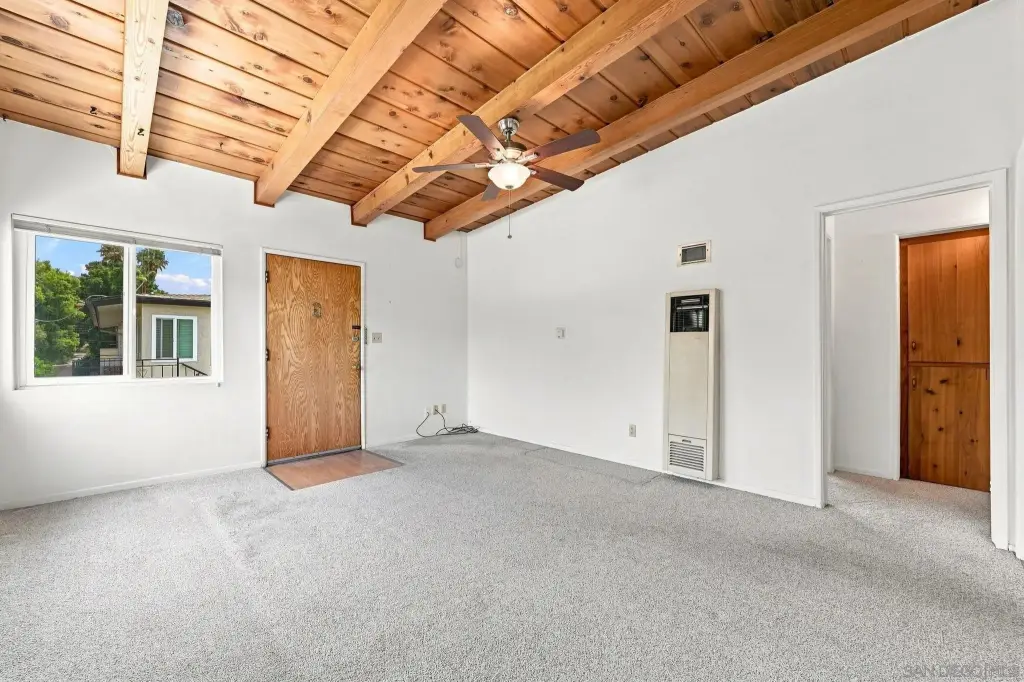
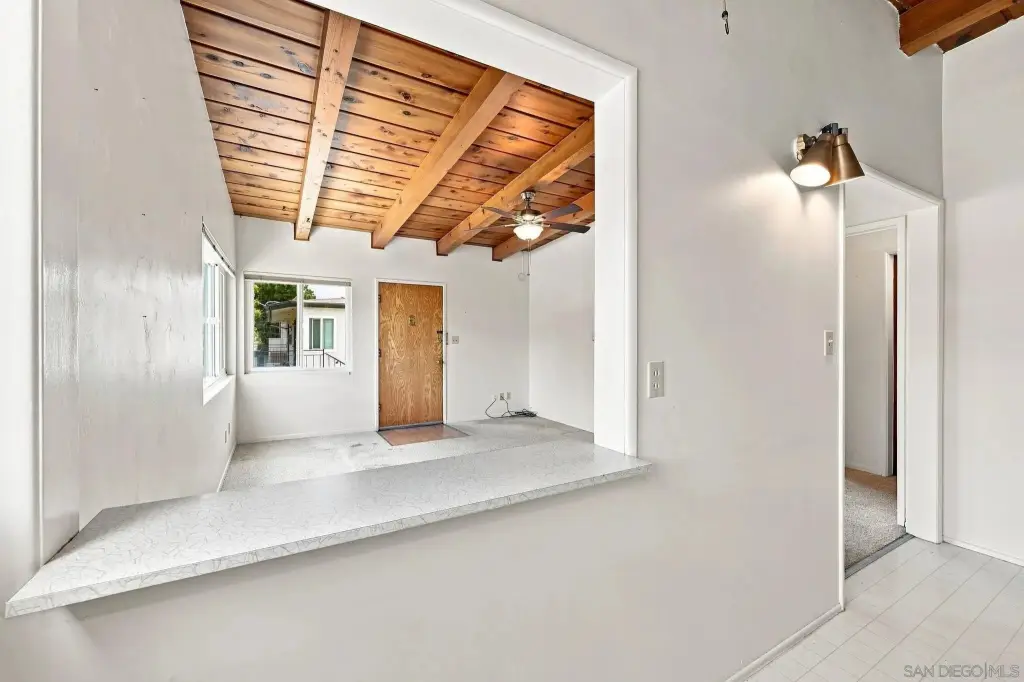
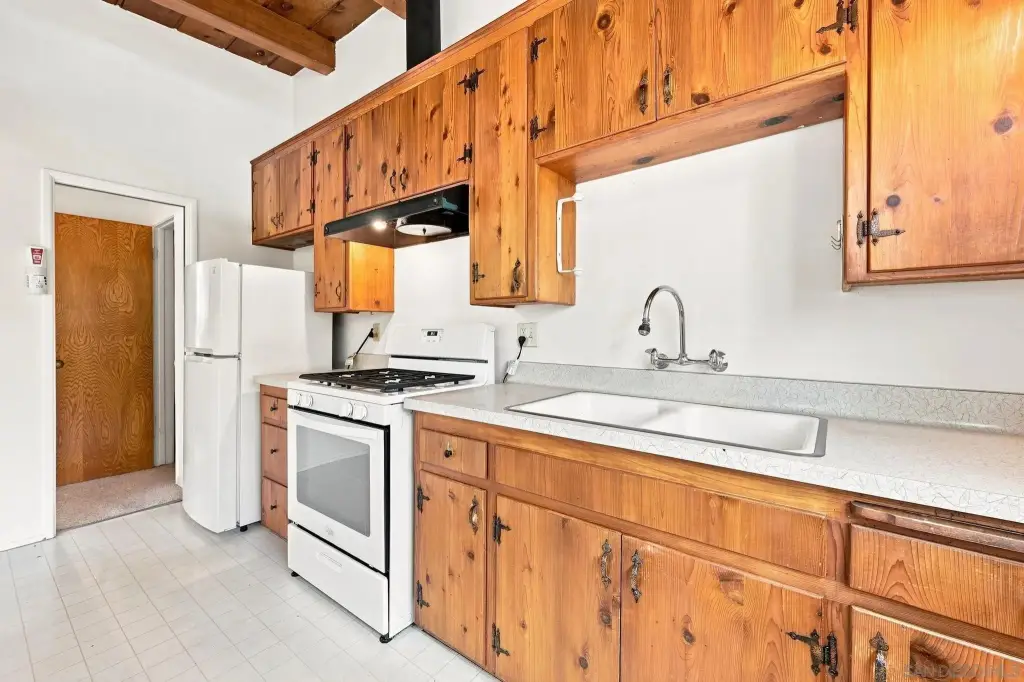
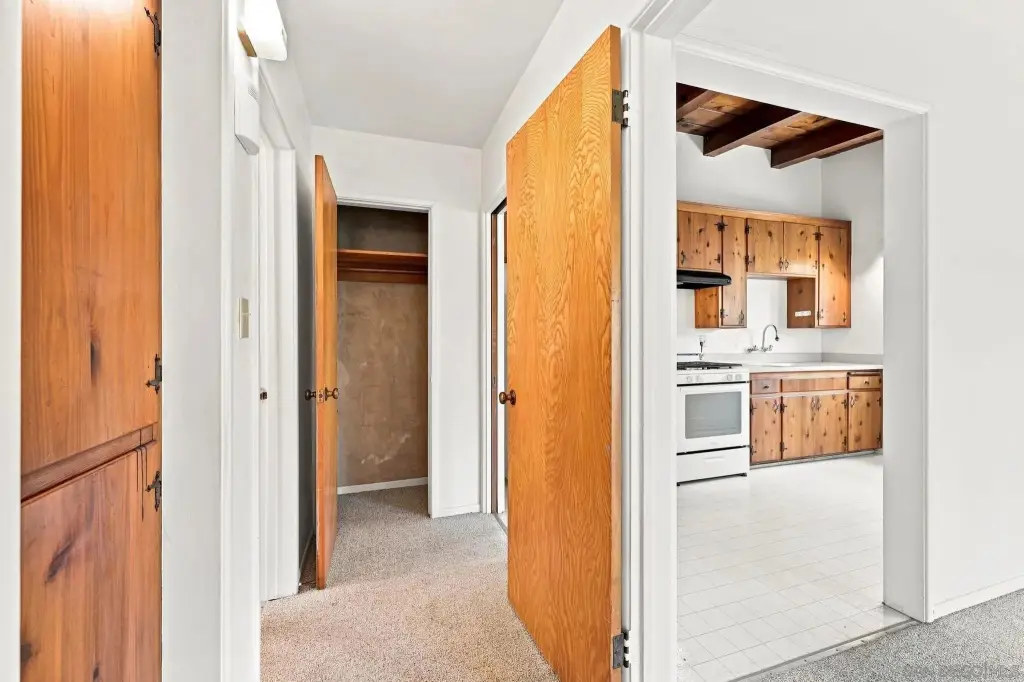
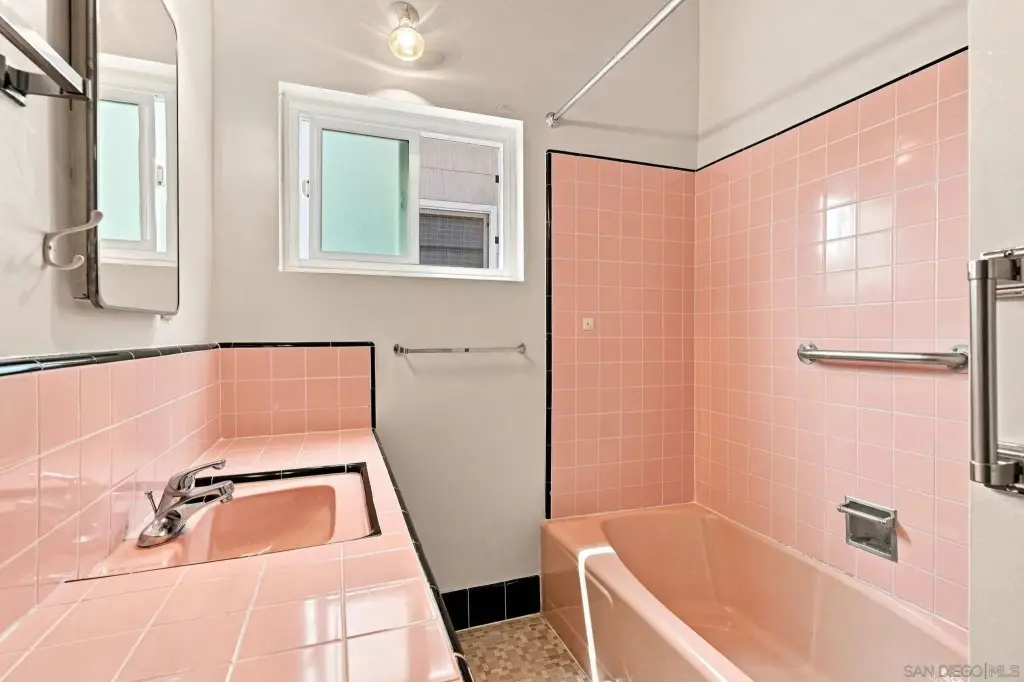
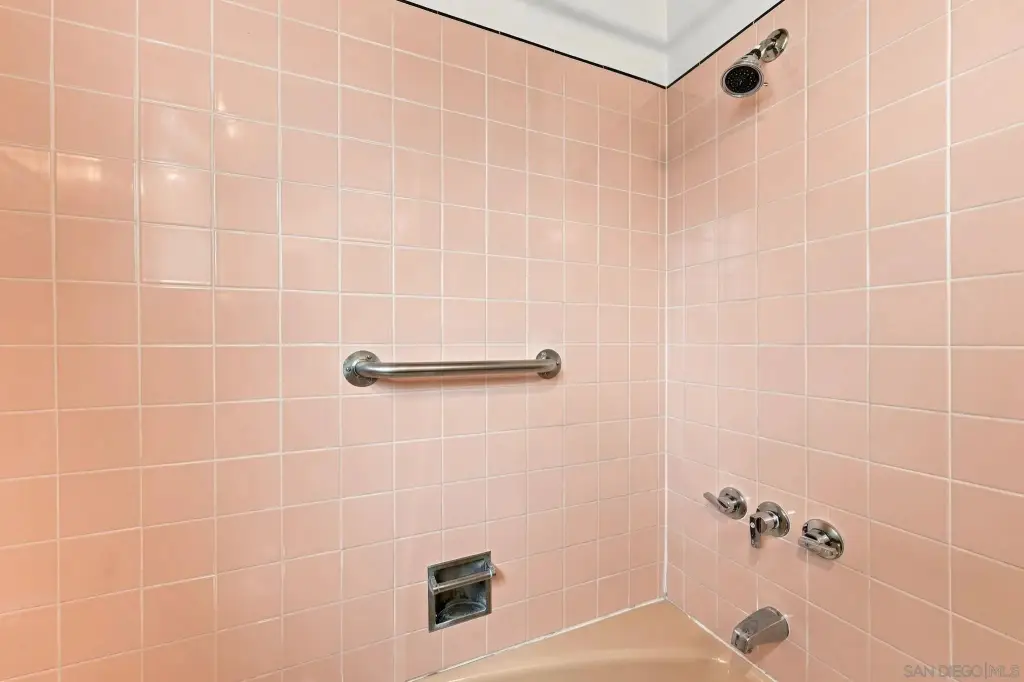
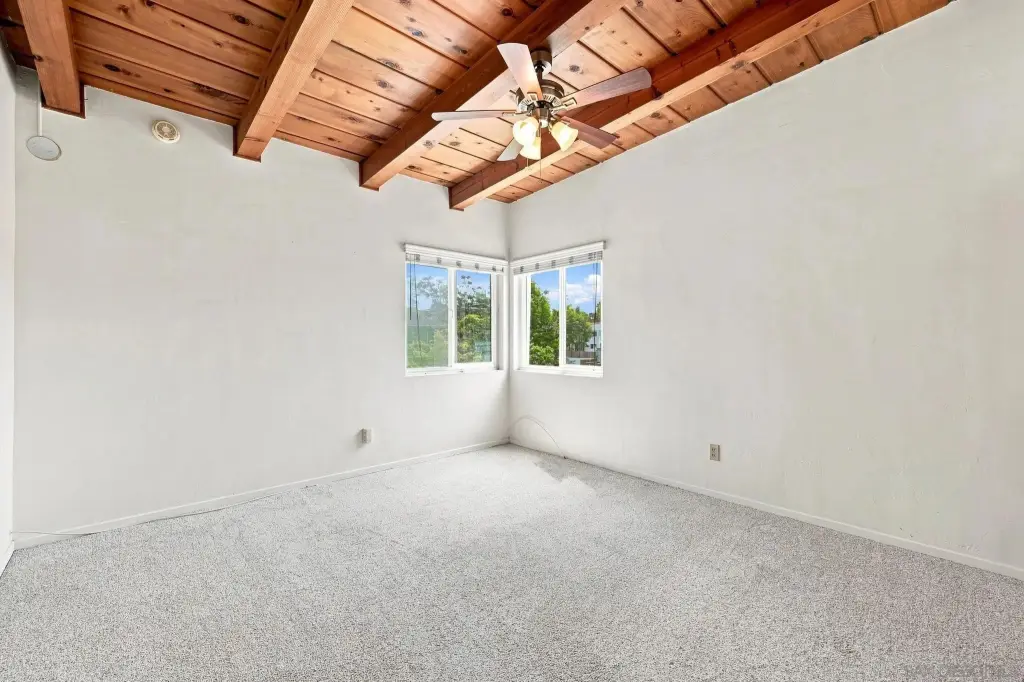
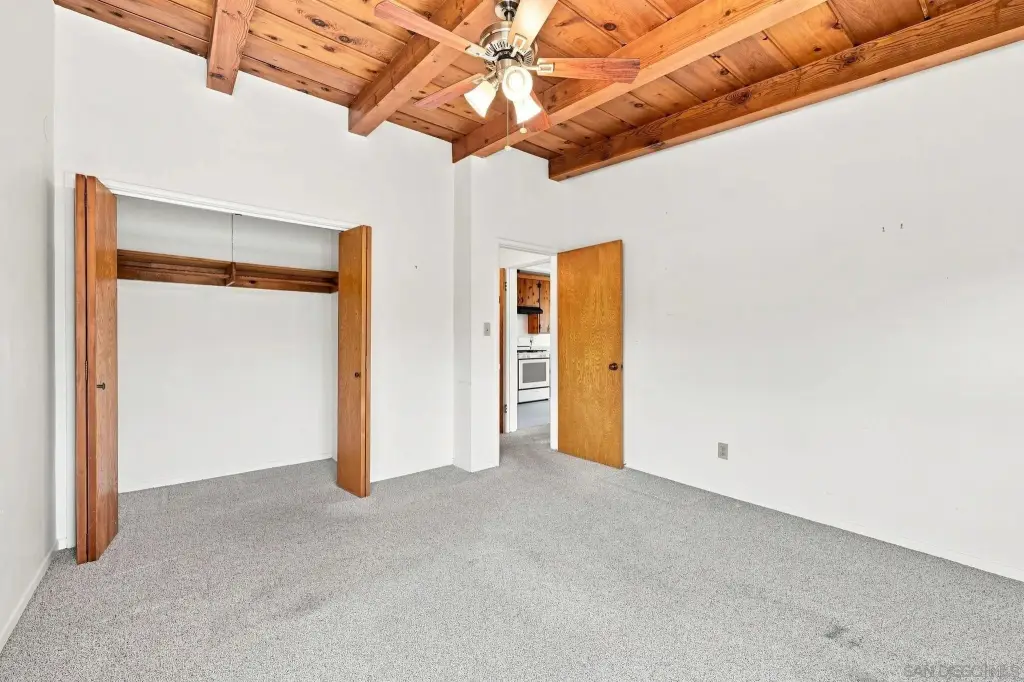
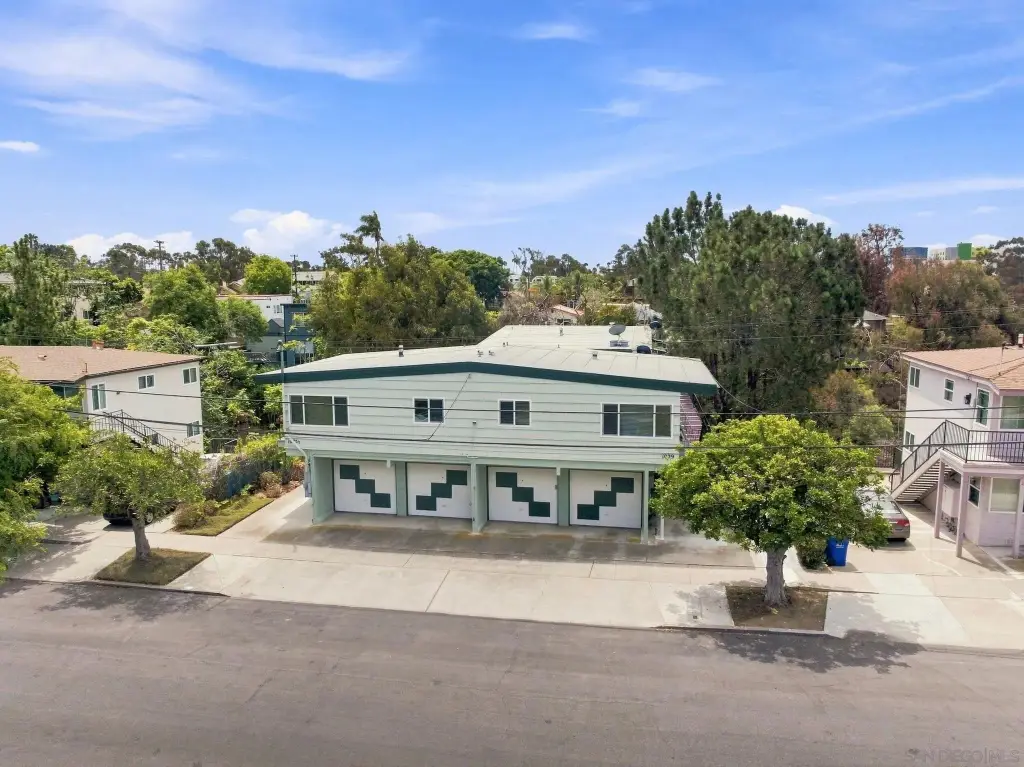
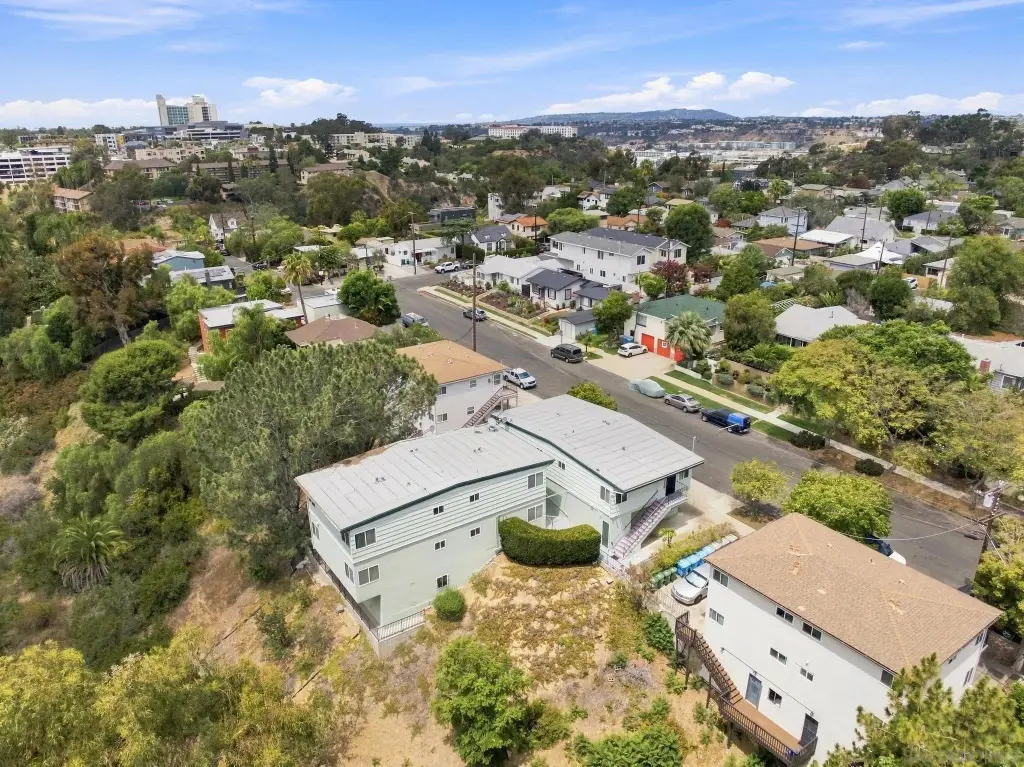
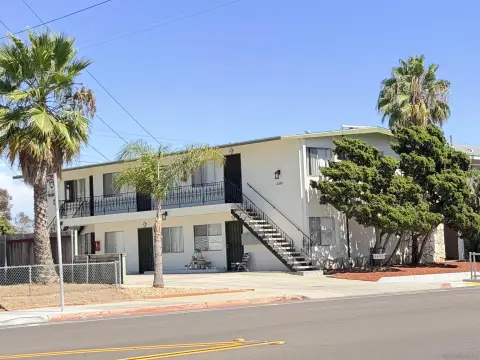
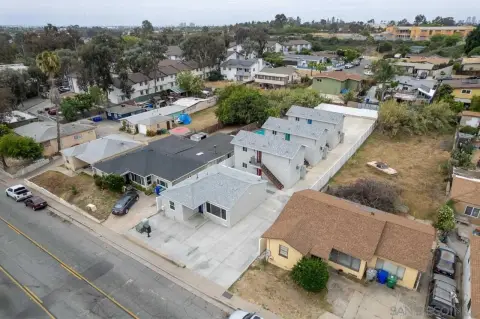
This 4,338-square-foot apartment building contains six one-bedroom, one-bath residences, all delivered vacant. Interior features include wood flooring and mid-century details such as vaulted open-beam ceilings. Each unit has separately metered utilities, and the property includes garage parking.
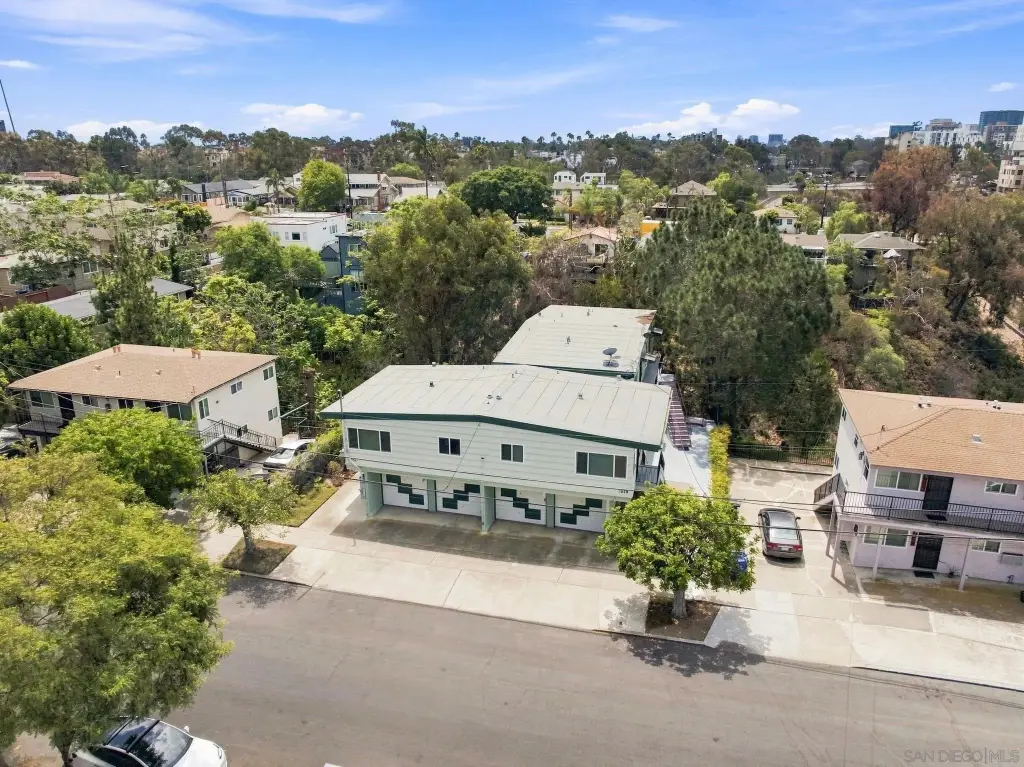
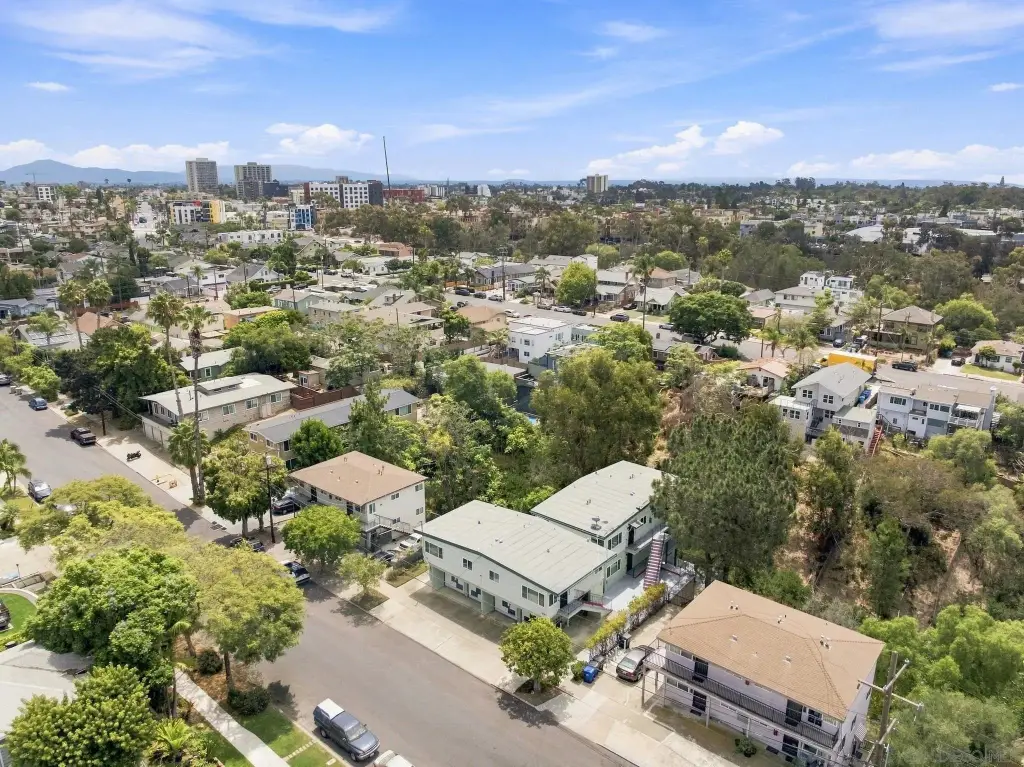
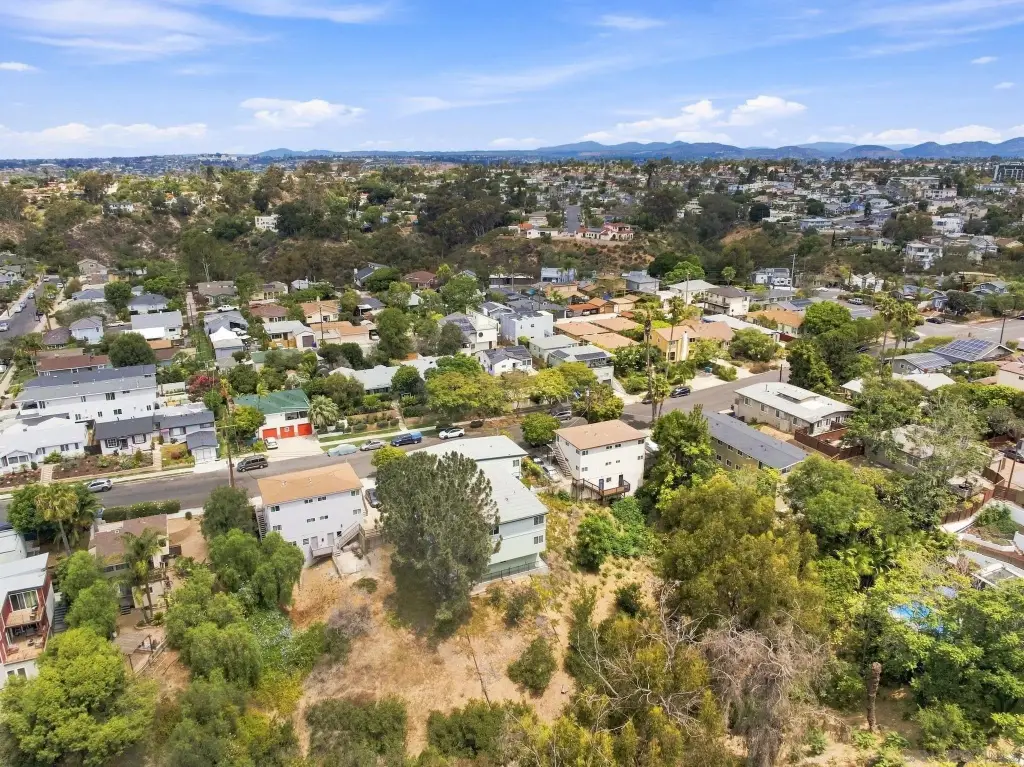
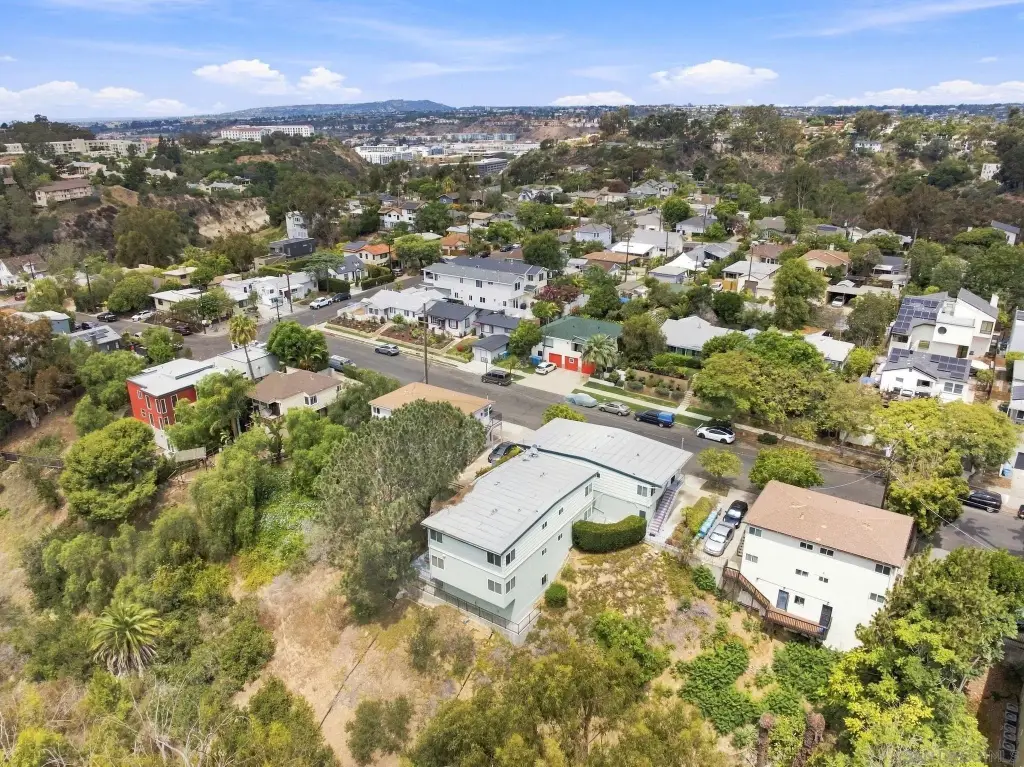
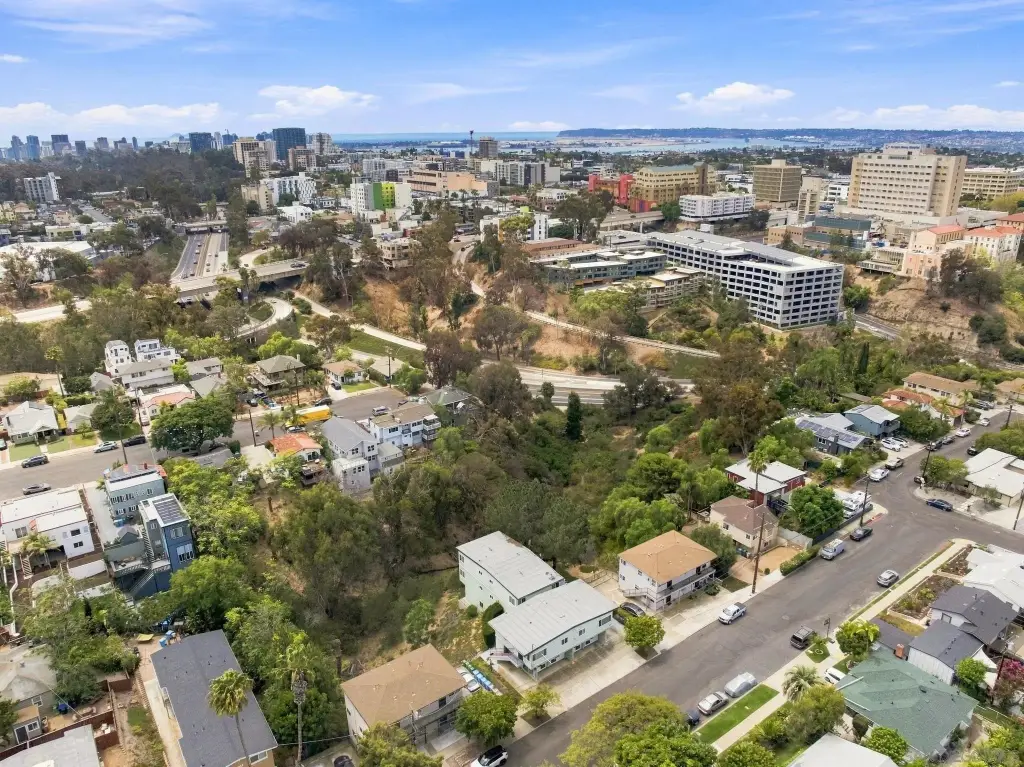
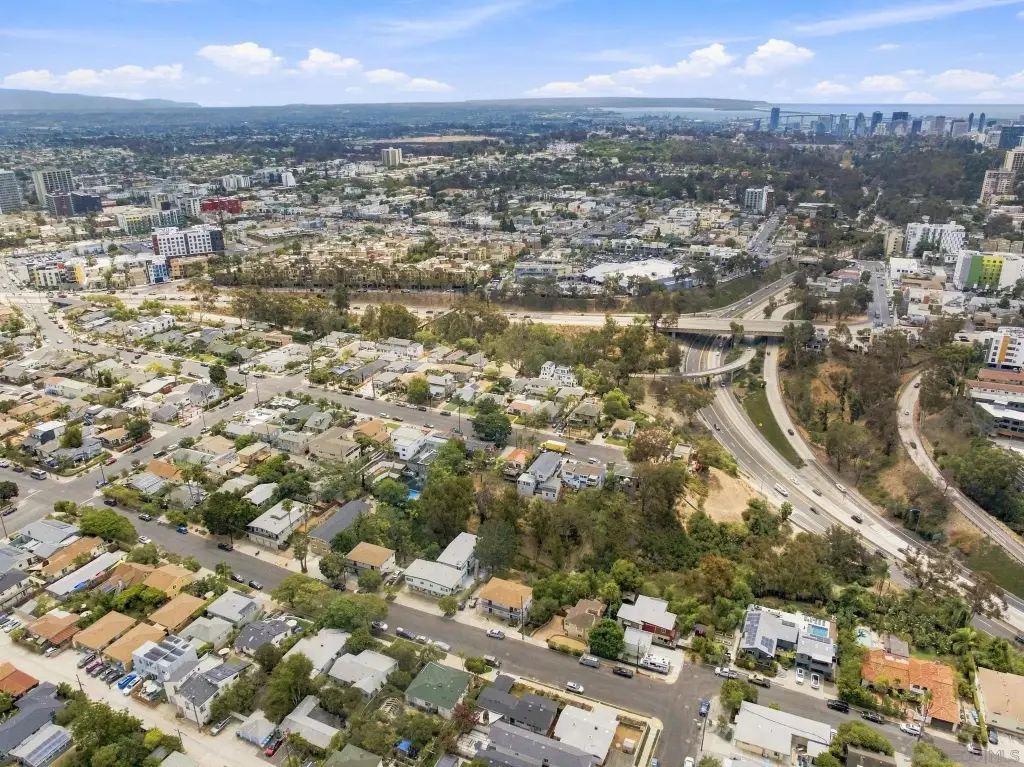
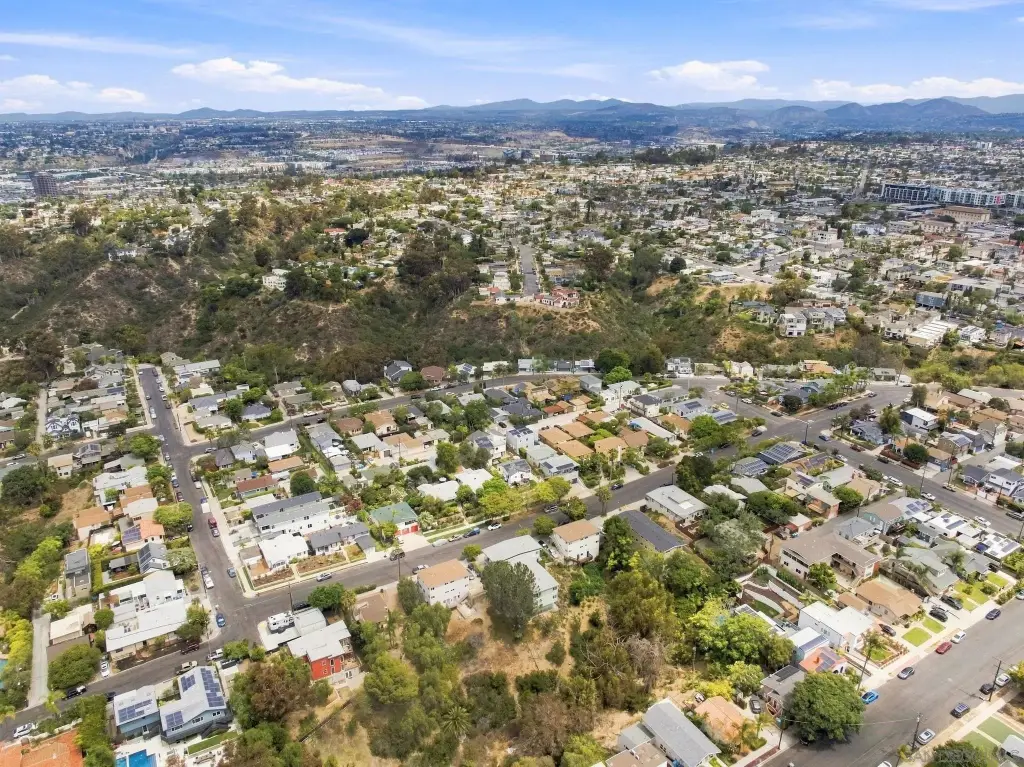
The building is positioned in central San Diego within the Mission Hills and University Heights corridor, with Hillcrest, Mission Hills, and North Park identified as nearby rental submarkets. The property was occupied by a nonprofit religious organization from 1993 and was not operated as a conventional rental, so no rental history exists. The roof was replaced approximately in 2018, and four water heaters were replaced approximately in 2023. Vacant delivery allows a new owner to determine the timing and sequencing of any renovations and leasing activity.
The building is positioned in central San Diego within the Mission Hills and University Heights corridor, with Hillcrest, Mission Hills, and North Park identified as nearby rental submarkets. The property was occupied by a nonprofit religious organization from 1993 and was not operated as a conventional rental, so no rental history exists. The roof was replaced approximately in 2018, and four water heaters were replaced approximately in 2023. Vacant delivery allows a new owner to determine the timing and sequencing of any renovations and leasing activity.
Key Highlights
- Six one‑bedroom, one‑bath units delivered vacant
- 4,338 square feet with six residential units
- Vaulted open‑beam ceilings and wood flooring
Financial Insights
Estimated NOI and Cap Rate
NOI / Yr
$71,699
Cap Rate
3.26%
Suggested Prices Based on Cap Rates
Cap Rate 5%
$1,433,980
$1.4M
Cap Rate 7%
$1,024,271
$1.0M
Cap Rate 9%
$796,656
$796.7K
Market Conditions
NOI Build-Up for 4,338 SF
Gross rent
$137.9K $31.80/SF
− Vacancy
−$7.6K −$1.75/SF
EGI
$130.4K $30.05/SF
− OpEx
−$58.7K −$13.52/SF
NOI
$71.7K $16.53/SF
Area
San Diego, CA
Vacancy
5.50%
Lease Rate
$31.80 /SF/Yr
Expense Ratio
45.00%
Simulate Cap Rate and NOI
Suggested Prices Based on Cap Rates
Cap Rate 5%
$1,433,980
Cap Rate 7%
$1,024,271
Cap Rate 9%
$796,656
Alternative Uses
Best Use
Apartment 5plus
$1.02M
$896.2K – $1.19M
NOI $71,699 @ 7.0% cap · market cap 3.26%
Second Best
—
—
no second resolved use
Theoretical Best
Specialty Retail
$1.71M
$1.50M – $2.00M
NOI $119,937 @ 7.0% cap · market cap 5.45%
Zoning and permitted uses should be independently verified with authorities.
How Realmo checks its estimates
Property Analytics
Unlock full access to Insights
Subscribe to Realmo Intelligence
Open Analytics
Current Use
Lease Details
6
Residential units
Location Intelligence
Trade Area within ½ mile
6,876
Businesses Nearby
Explore this area
Business Placement
Demographics for 92103, CA
33,311
Population
21,363
Households
1.6
Avg Household Size
42
Median Age
63%
College-Educated
97%
High-School Grad
3.7 sq mi
ZIP Area
9,003
Density / Sq Mi
$96,887
Median Household Income
$69,732
Median Earnings
$2,020
Median Rent
$986,800
Median Home Value
Check the figures for this property
Cap Rate, Value Estimation, Potential NOI and more
View Realmo Analytics
Market
Vacancy Rate% for Multifamily in West region







Frequently Asked Questions
What type of property is this?
Apartment building - Vacant one-bedroom residences provide flexibility for renovation sequencing and future lease-up planning.
Where is this apartment building located?
The property is located at 1029-33 Hayes Ave San Diego, CA.
What is the asking price?
The asking price for this property is $2,200,000.
What are key features of this property?
This property features: Six one‑bedroom, one‑bath units delivered vacant; 4,338 square feet with six residential units; Vaulted open‑beam ceilings and wood flooring


