Two-Family Home in Dyker
For Sale
Contact for pricing
822 72nd St, Brooklyn, NY 11228
Two-family home in prime location, ideal for investment.
Property Size1,720 SF
Lot Size0.05 Acres
Price / SF$784.88
Days on Market212
Property Features for 822 72nd St
General Information
Standard status
Active
Size
1,720 SF
Lot size
0.05 Acres
Property subtype
Multifamily
Zoning
R4-1
Building Details
Year Built
1899
Stories
2
Listing Agency:
ProBase Real Estate
Listed By:
Shaojie Liang · License #NY
(718) 210-2727
Source:
Crexi
Added: Mar 14
Changed: Aug 8
Last Checked: Aug 8 at 2:39PM
Displayed information is deemed reliable but is not guaranteed and should be independently verified. All listing content including descriptions, pricing, images are the copyrighted material of ProBase Real Estate
Investment Insights
Based on property information with market context.
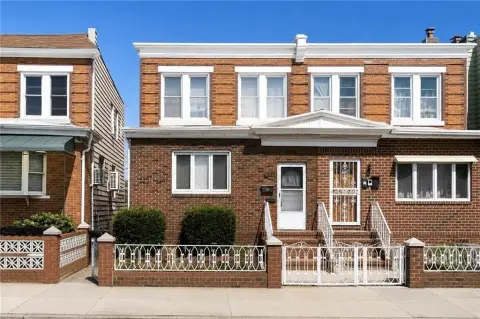
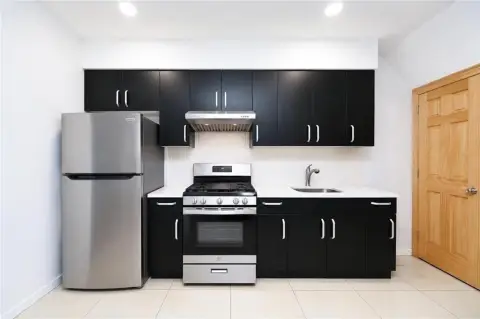
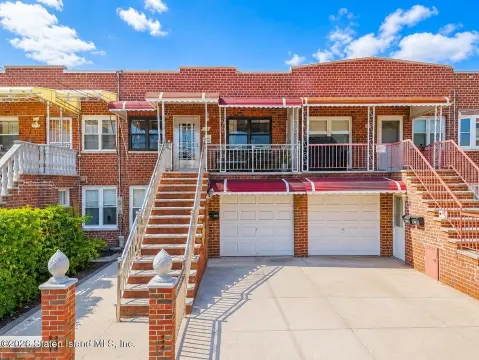
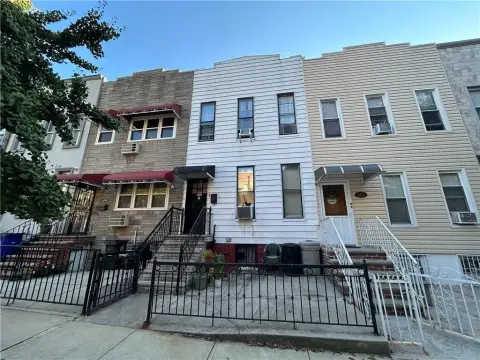
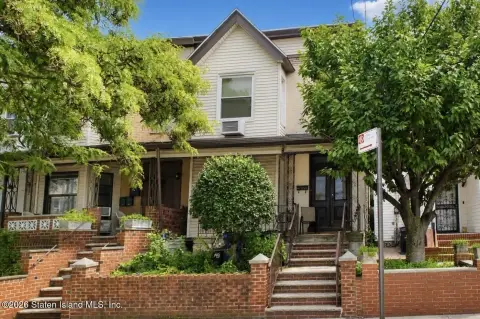
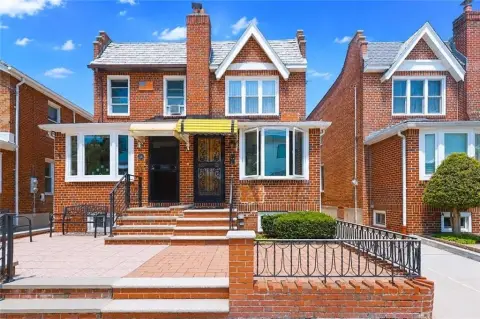
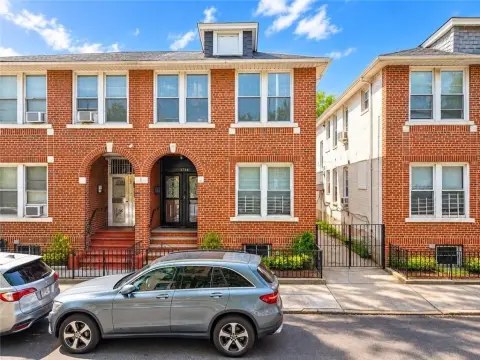
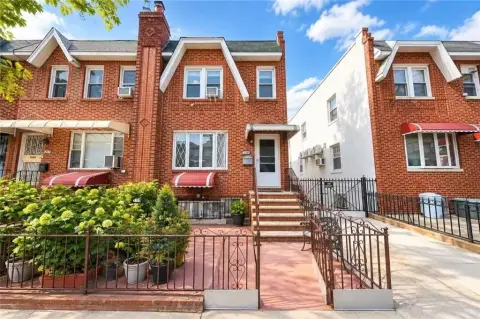
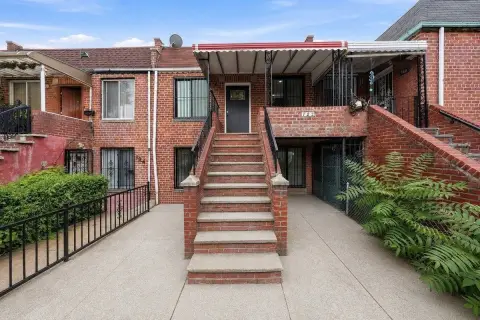
This semi-detached two-family home is situated in the desirable Dyker Heights neighborhood. The building, measuring 18 by 51 feet, sits on a 20 by 100 foot lot. The first floor features a two-bedroom apartment, while the second floor contains a three-bedroom apartment. A full basement with a front entrance, open layout, and boiler area is included. The property features separate heat and hot water systems, along with two gas meters and two electrical meters. The annual property tax is $6,784. The property is in good condition and is conveniently located near 8th Avenue, providing easy access to the N train. JHS 259 William McKinley is among the nearby schools. The property is suitable for owner occupancy, investment, or rental income in a sought-after Brooklyn neighborhood. The property size is 1720 square feet.
Key Highlights
- Prime Dyker Heights location near 8th Avenue and the N train.
- Two‑family home with a two‑bedroom and a three‑bedroom apartment.
- Separate heat, hot water, gas, and electric meters for each unit.
Financial Insights
Estimated NOI and Cap Rate
NOI / Yr
$60,237
Cap Rate
4.46%
Suggested Prices Based on Cap Rates
Cap Rate 5%
$1,204,740
$1.2M
Cap Rate 7%
$860,529
$860.5K
Cap Rate 9%
$669,300
$669.3K
Market Conditions
NOI Build-Up for 1,720 SF
Gross rent
$87.7K $51.00/SF
− Vacancy
−$1.7K −$0.97/SF
EGI
$86.1K $50.03/SF
− OpEx
−$25.8K −$15.01/SF
NOI
$60.2K $35.02/SF
Area
Brooklyn, NY
Vacancy
1.90%
Lease Rate
$51.00 /SF/Yr
Expense Ratio
30.00%
Simulate Cap Rate and NOI
Suggested Prices Based on Cap Rates
Cap Rate 5%
$1,204,740
Cap Rate 7%
$860,529
Cap Rate 9%
$669,300
Alternative Uses
Best Use
Multifamily LT 5
$860.5K
$753.0K – $1.00M
NOI $60,237 @ 7.0% cap · market cap 4.46%
Second Best
Apartment 5plus
$750.1K
$656.4K – $875.2K
NOI $52,510 @ 7.0% cap · market cap 3.89%
Theoretical Best
Specialty Retail
$1.42M
$1.25M – $1.66M
NOI $99,691 @ 7.0% cap · market cap 7.38%
Zoning and permitted uses should be independently verified with authorities.
Property Analytics
Unlock full access to Insights
Subscribe to Realmo Intelligence
Open Analytics
Current Use
Location Intelligence
Trade Area within ½ mile
5,282
Businesses Nearby
Explore this area
Business Placement
Demographics for 11228, NY
45,906
Population
16,336
Households
2.8
Avg Household Size
41
Median Age
37%
College-Educated
80%
High-School Grad
1.5 sq mi
ZIP Area
30,604
Density / Sq Mi
$80,737
Median Household Income
$47,062
Median Earnings
$1,828
Median Rent
$1,131,700
Median Home Value
Check the figures for this property
Cap Rate, Value Estimation, Potential NOI and more
View Realmo Analytics
Market
Vacancy Rate% for Multifamily in Northeast region

Questions? Ask Rey
Realmo’s AI knows this listing — price, zoning, demand, history. Ask anything.
Frequently Asked Questions
What type of property is this?
Duplex - Two-family home in prime location, ideal for investment.
Where is this duplex located?
The property is located at 822 72nd St Brooklyn, NY.
What is the asking price?
The asking price for this property is $1,350,000.
What are key features of this property?
This property features: Prime Dyker Heights location near 8th Avenue and the N train.; Two‑family home with a two‑bedroom and a three‑bedroom apartment.; Separate heat, hot water, gas, and electric meters for each unit.


