Equipped Restaurant Property with
For Sale
$2,500,000
801 Hwy 17 S, North Myrtle Beach, SC 29582
COMMERCIAL/INDUSTRIAL, North Myrtle Beach, SC
Property Size7,254 SF
Lot Size1.75 Acres
Price / SF$344.64
Days on Market150
Property Features for 801 Hwy 17 S
General Information
Property type
Commercial Sale
Property subtype
Other
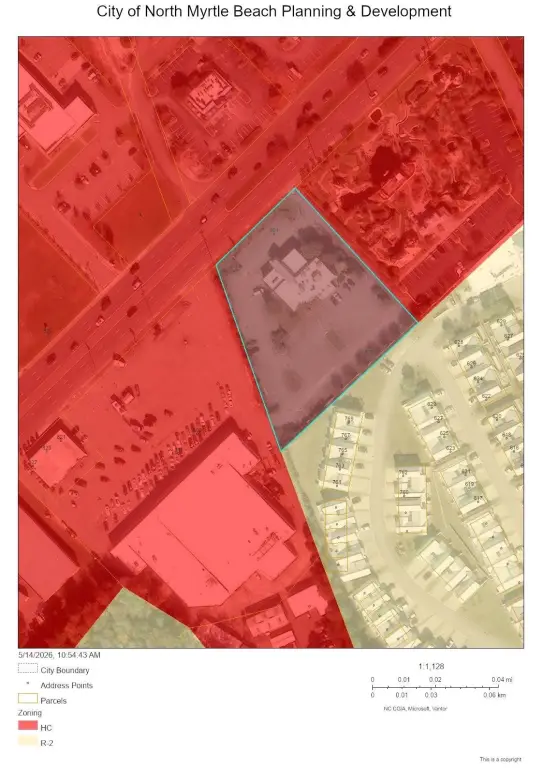
Zoning
HC
Security features
Security System
Exterior features
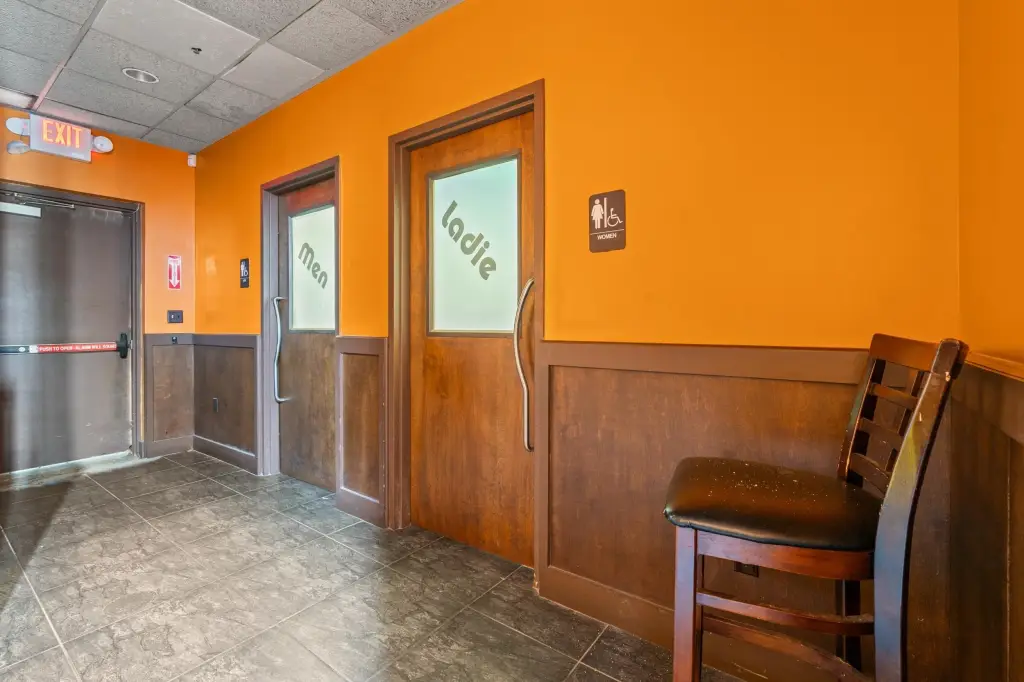
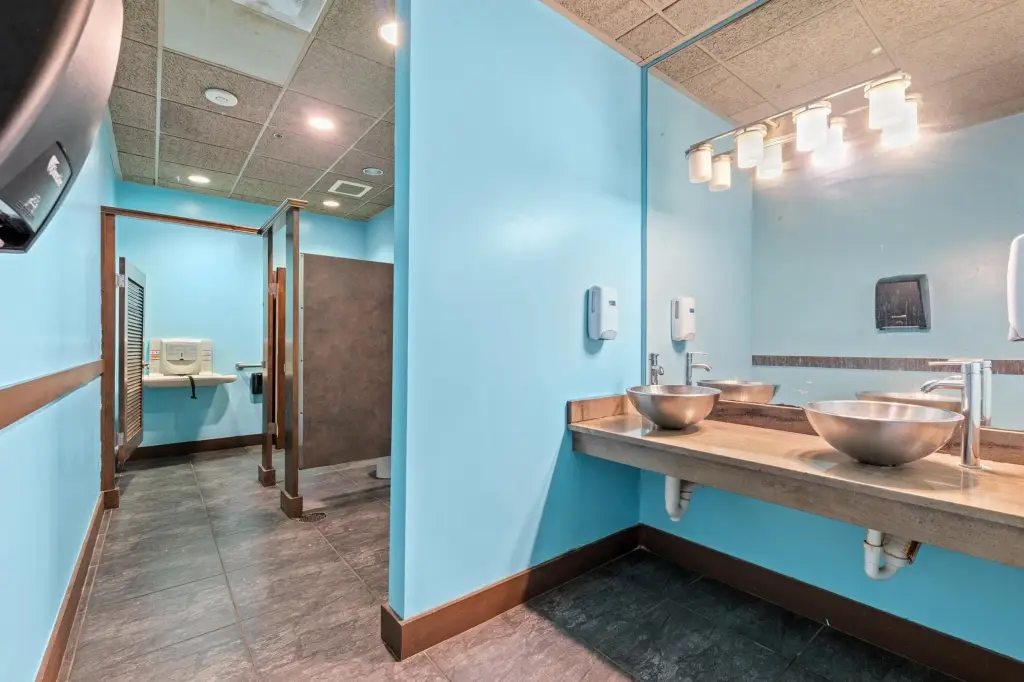
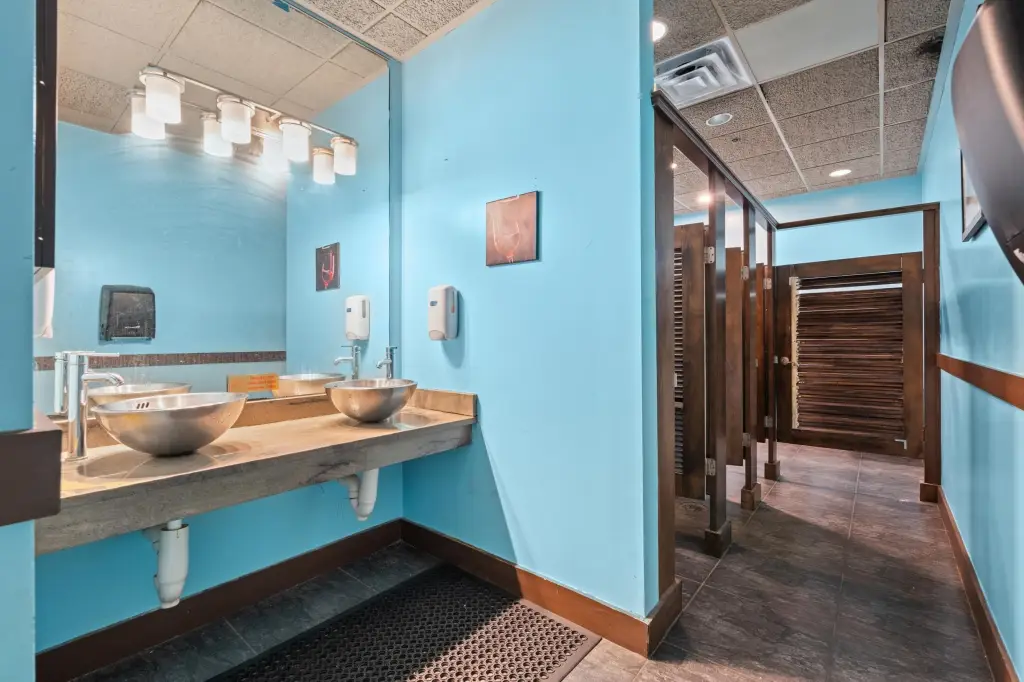
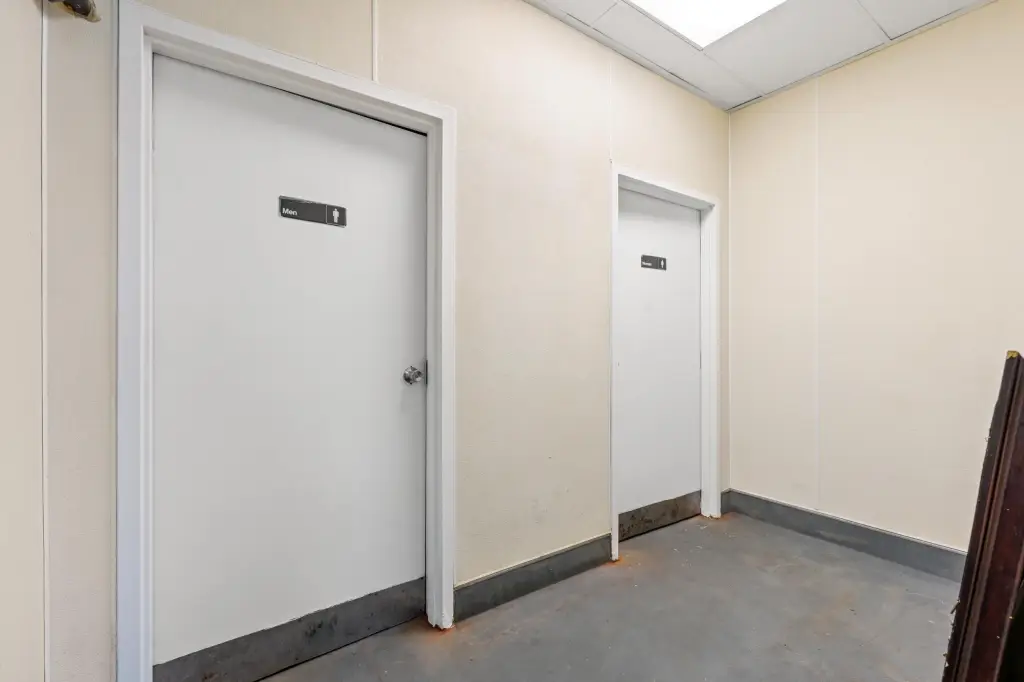
Display Windows, Fire Alarm, Fixtures/Furniture, Inside Storage, Kitchen Facility, Machinery Included, Office(s), Reception Area, Restrooms - Private, Restrooms - Public, Security System, Sign, Sprinkler System
Subdivision
11B North Myrtle Beach Area--Ocean Drive
Standard status
Active
Size
7,254 SF
Lot size
1.75 Acres
Building Details
Floors in Building
1
Number of units
1
Additional Structures
Storage
Listing Agency:
Realty ONE Group Dockside
(843) 492-4030
Listed By:
Eleonora Nora Rumbaugh · License #115323
(843) 267-6134
Added: May 15
Changed: Oct 8
Last Checked: Oct 11 at 1:06PM
MLS# 2612613
Copyright © 2026 Coastal Carolina Association of REALTORS®. All rights reserved. All information provided by the listing agent/broker is deemed reliable but is not guaranteed and should be independently verified.
Investment Insights
Based on property information with market context.
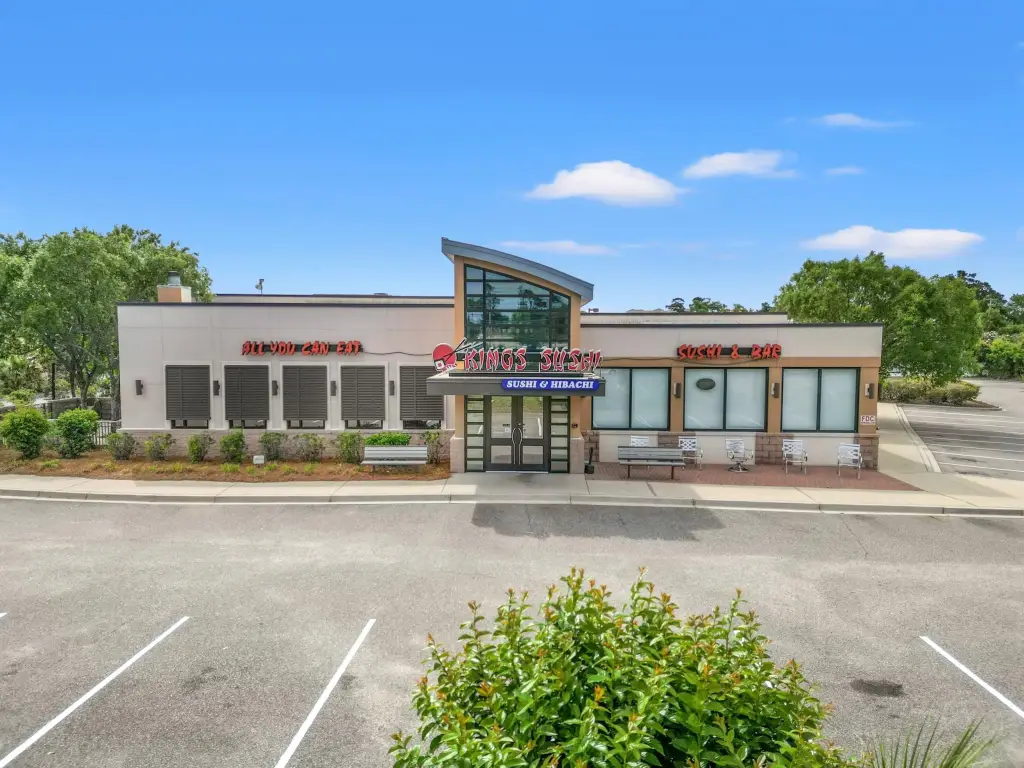
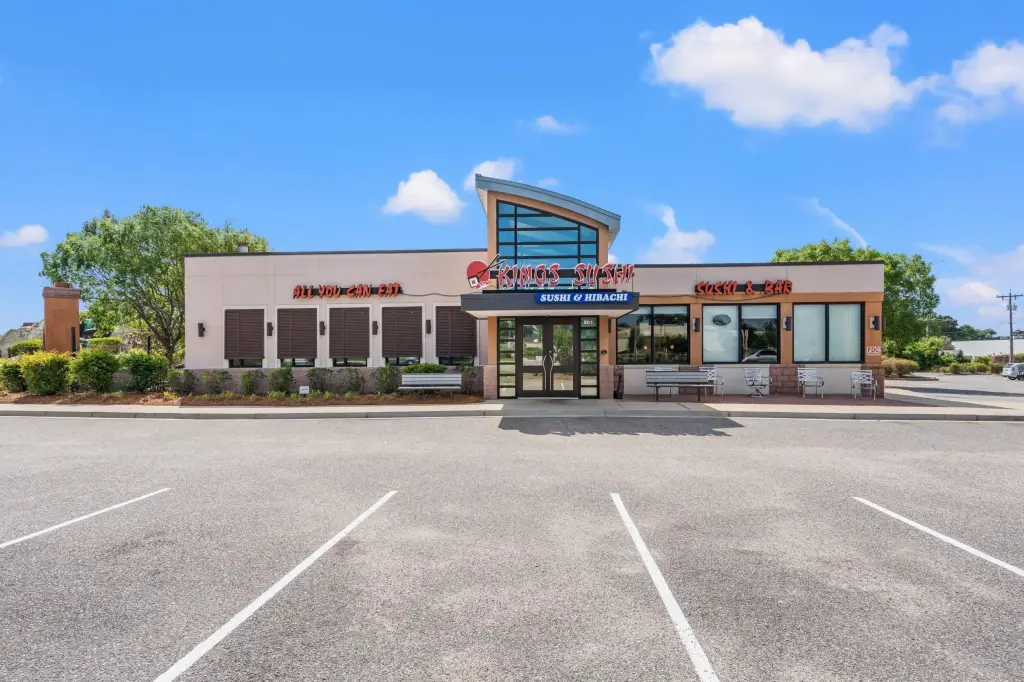
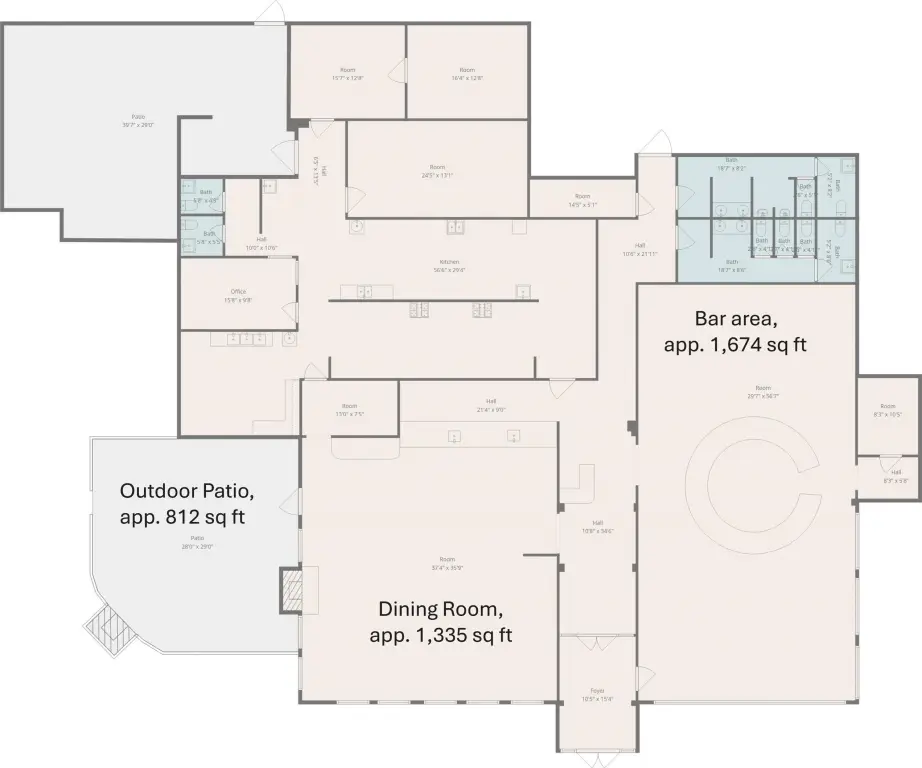
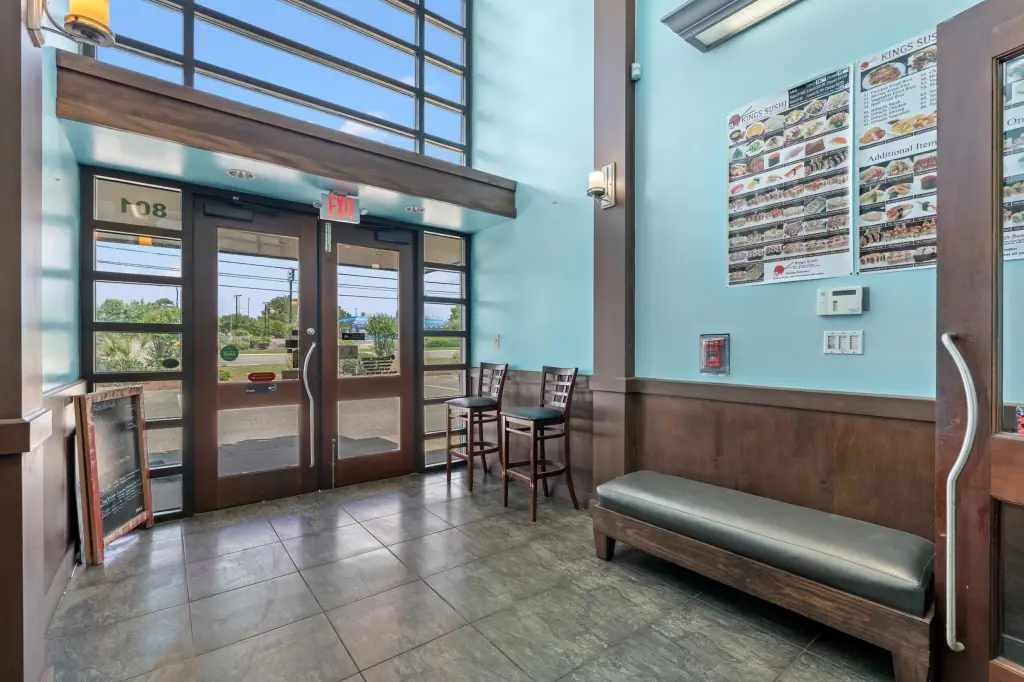
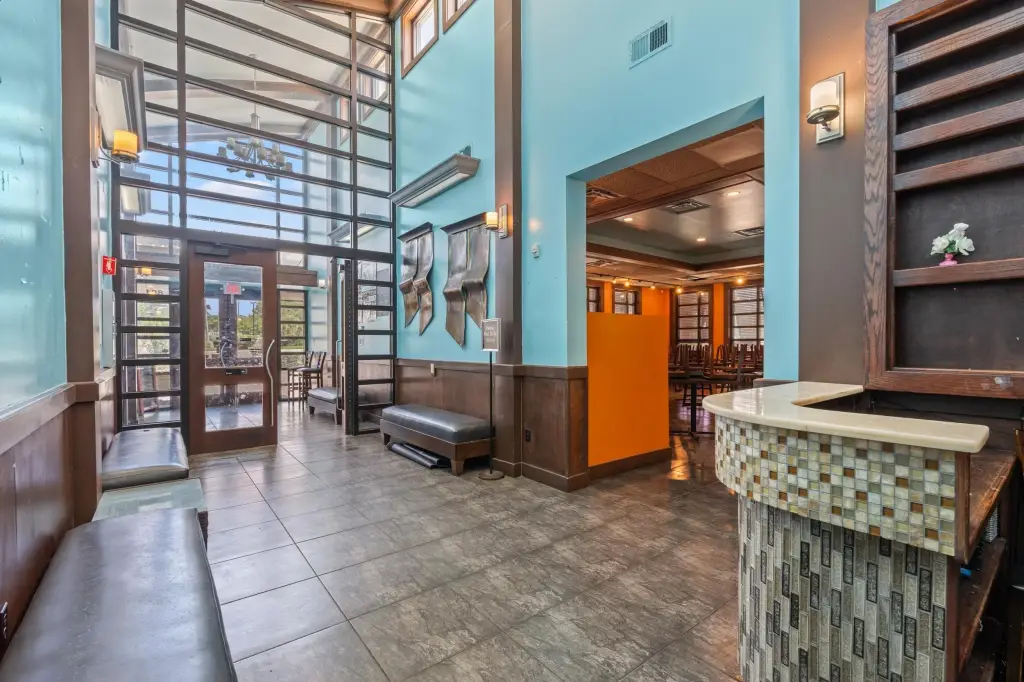
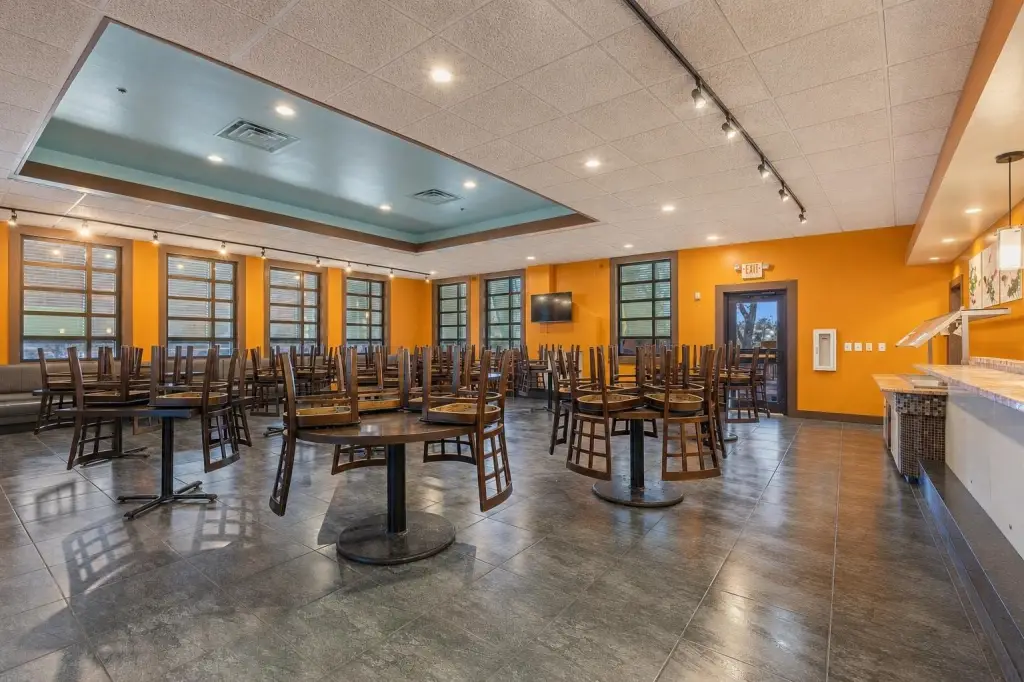
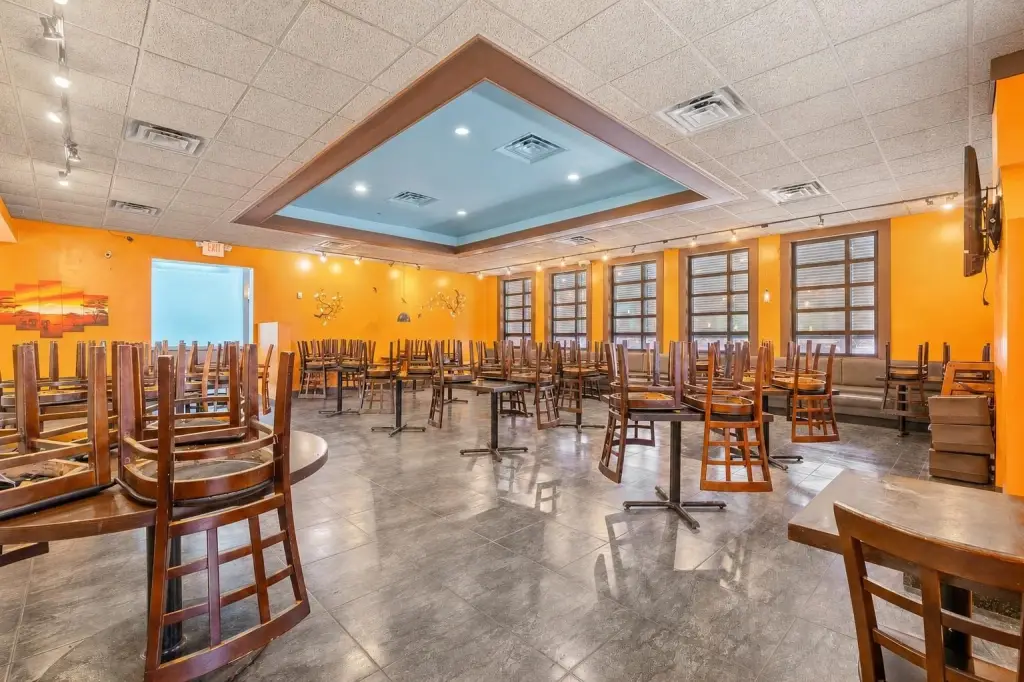
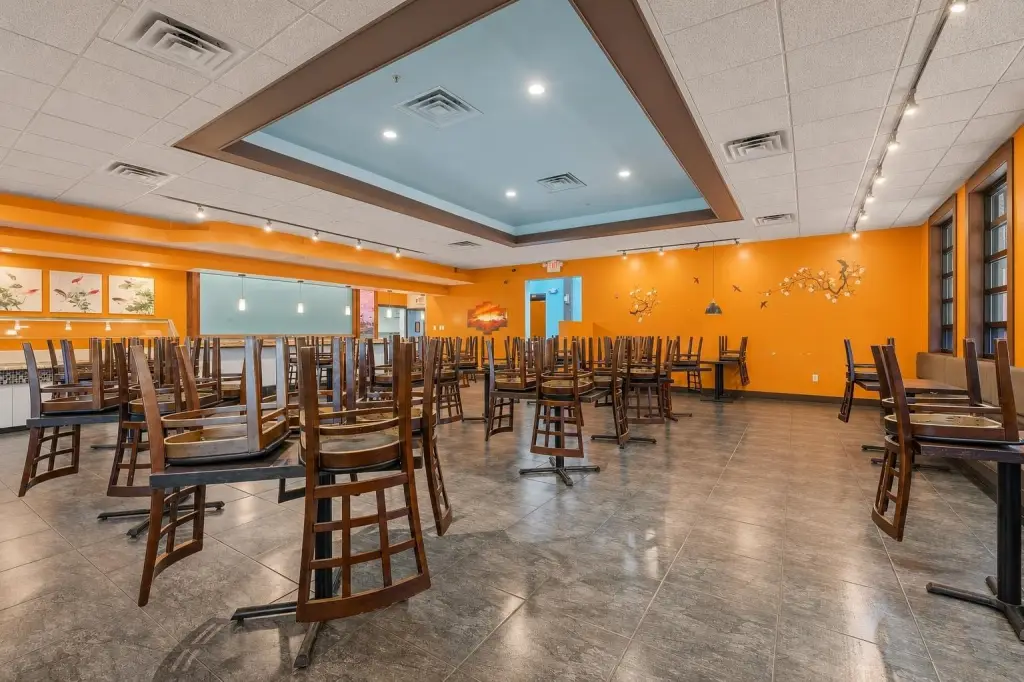
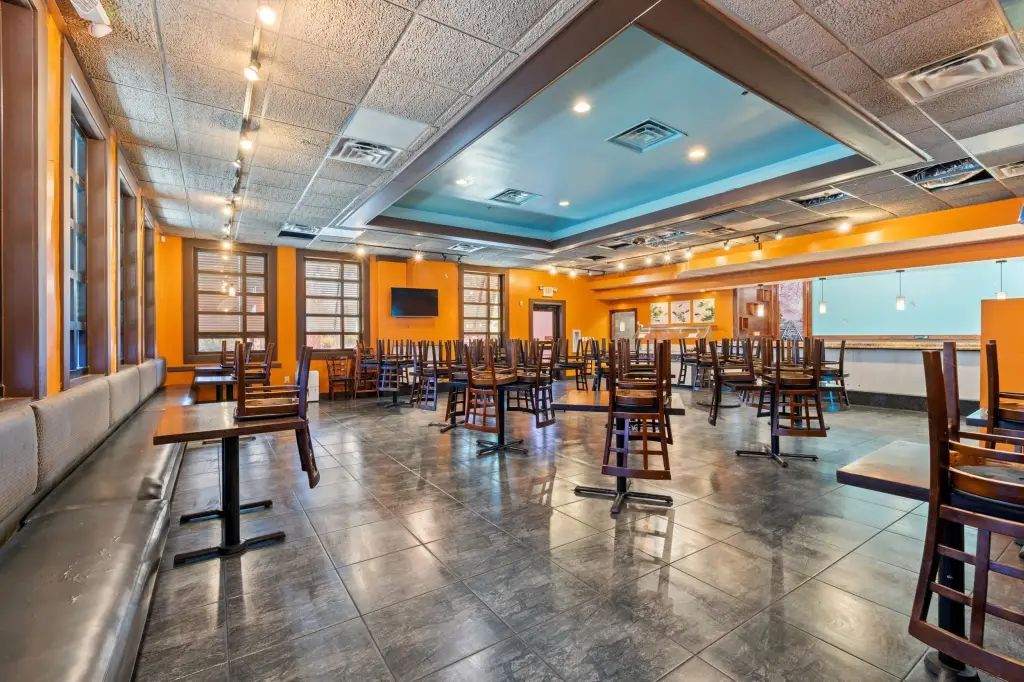
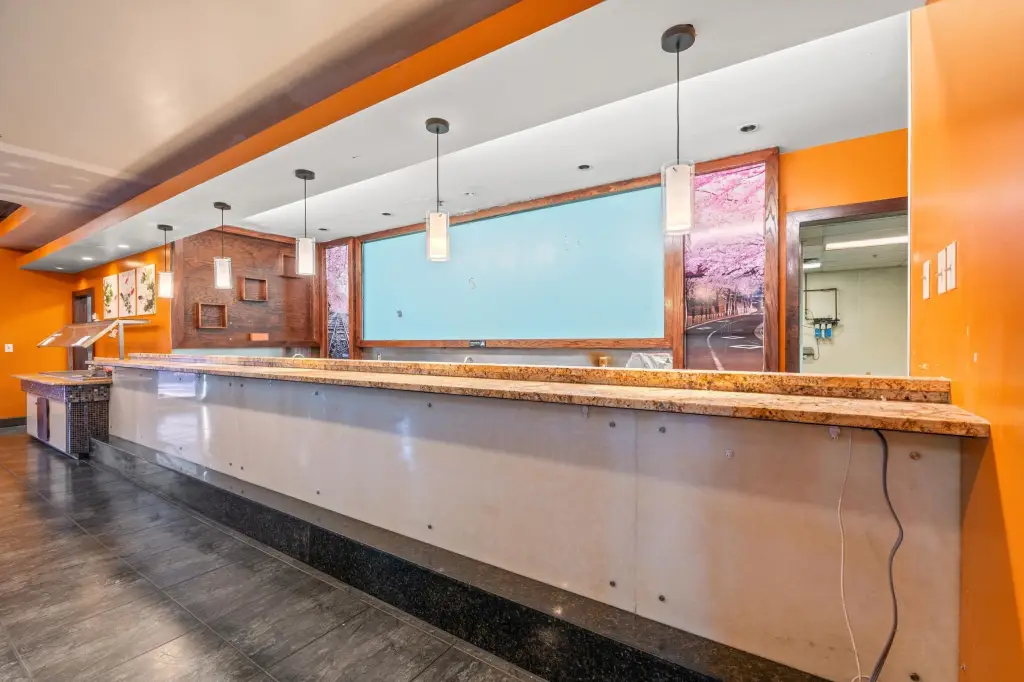
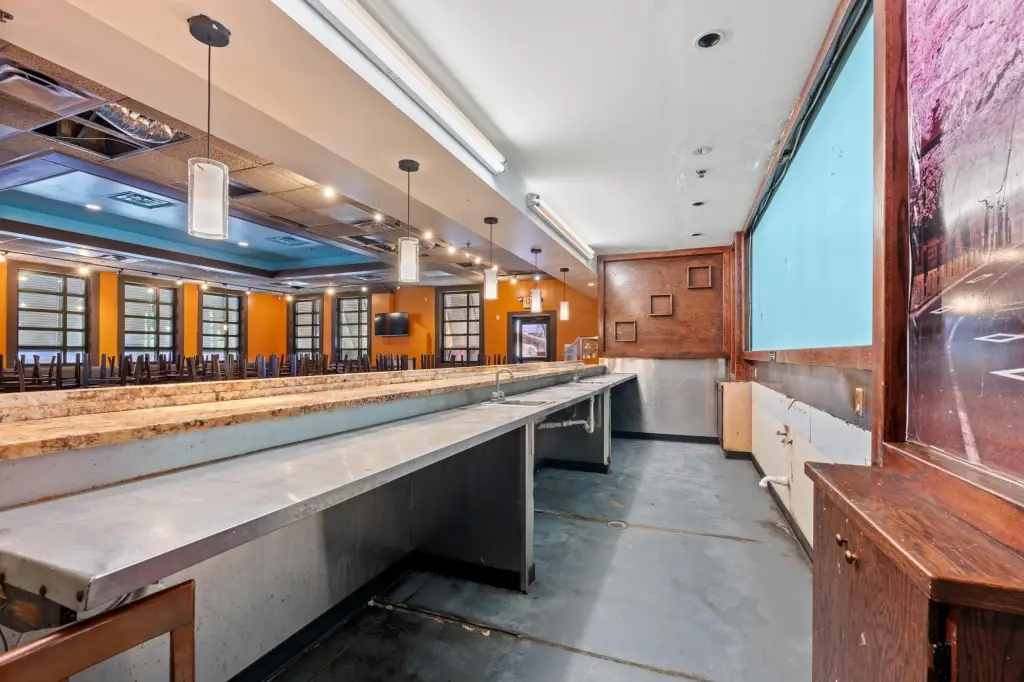
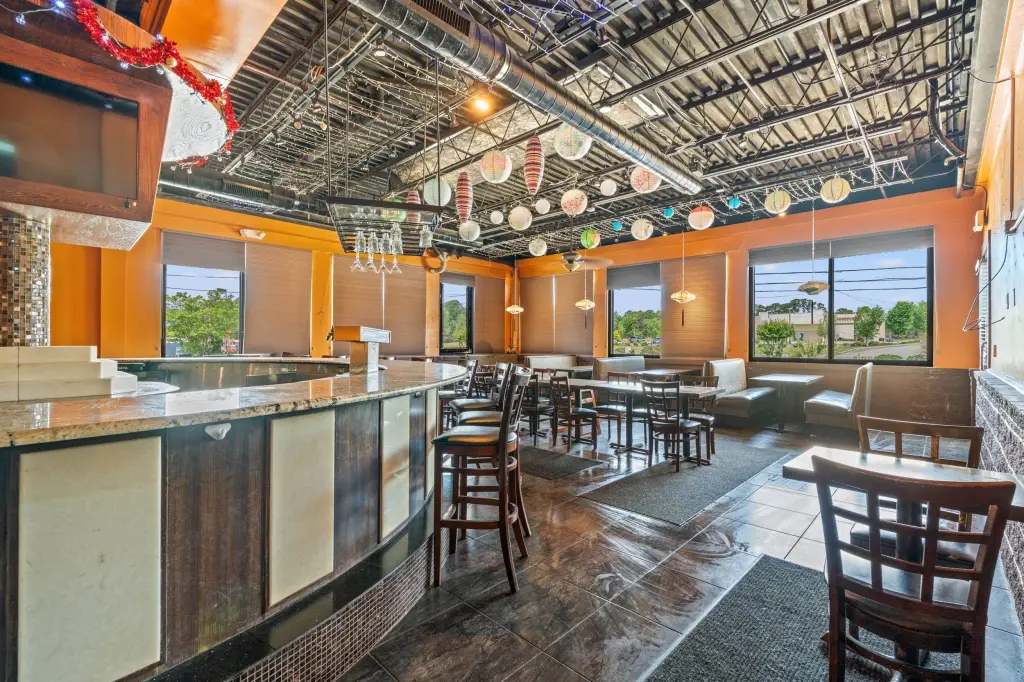
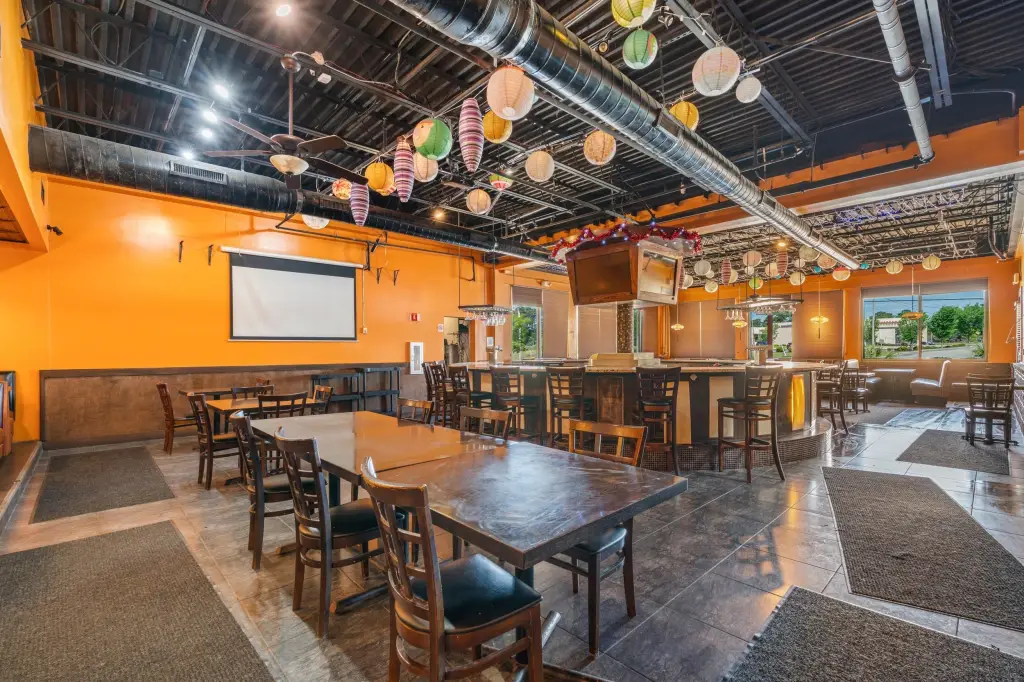
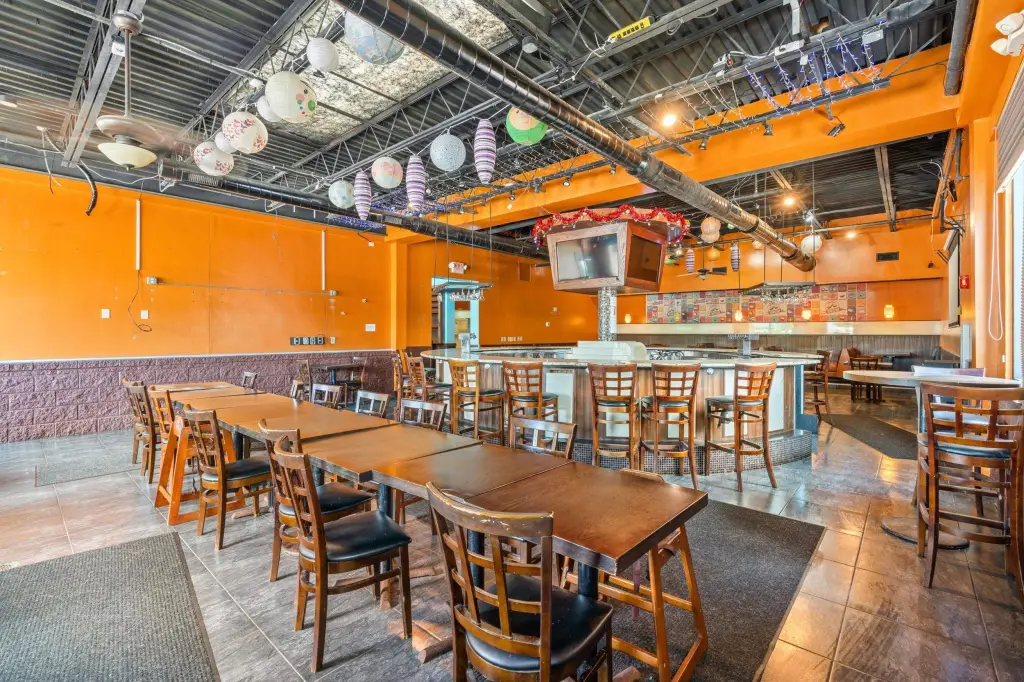
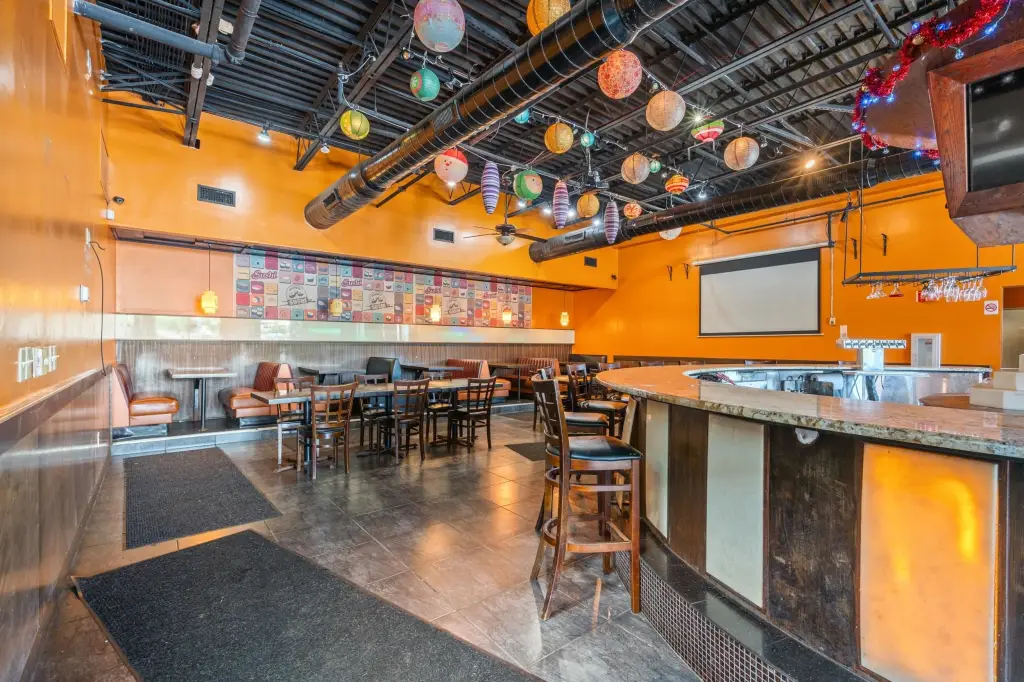
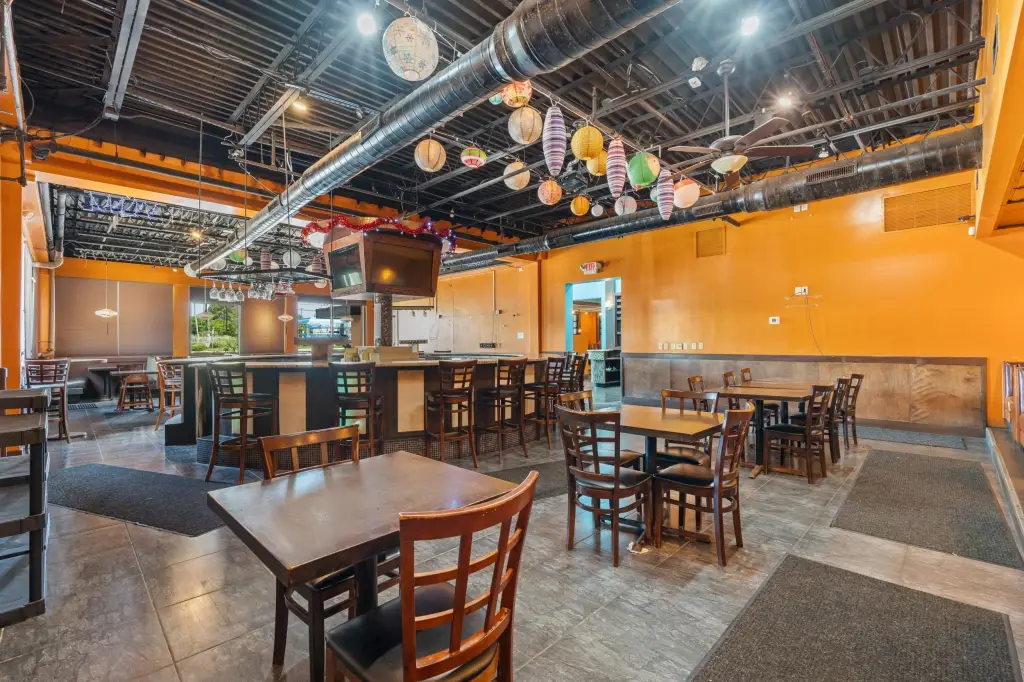
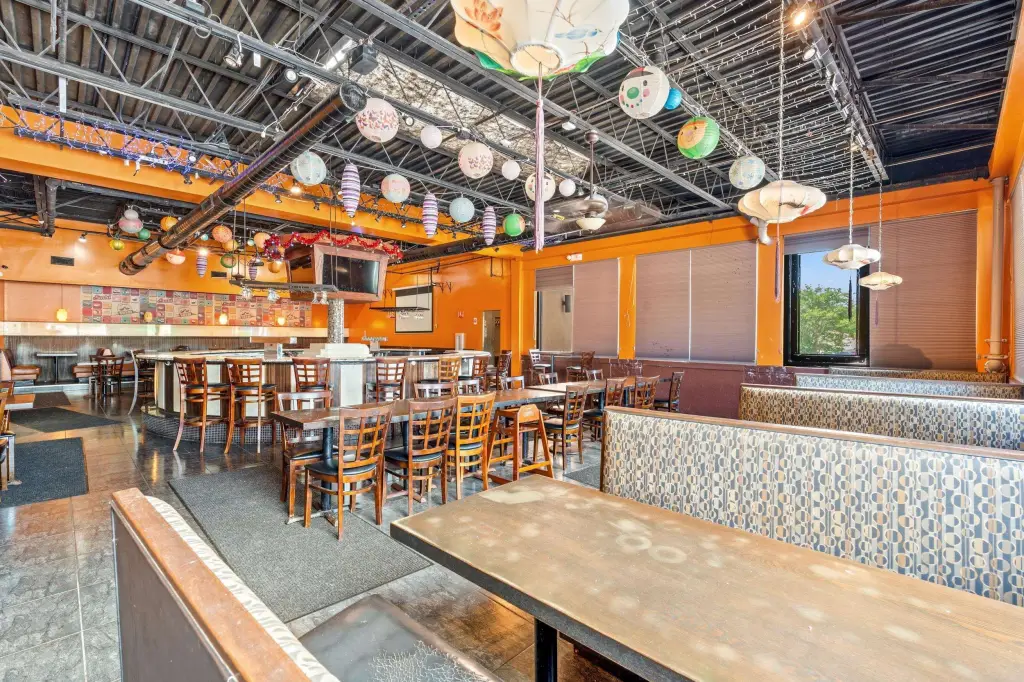
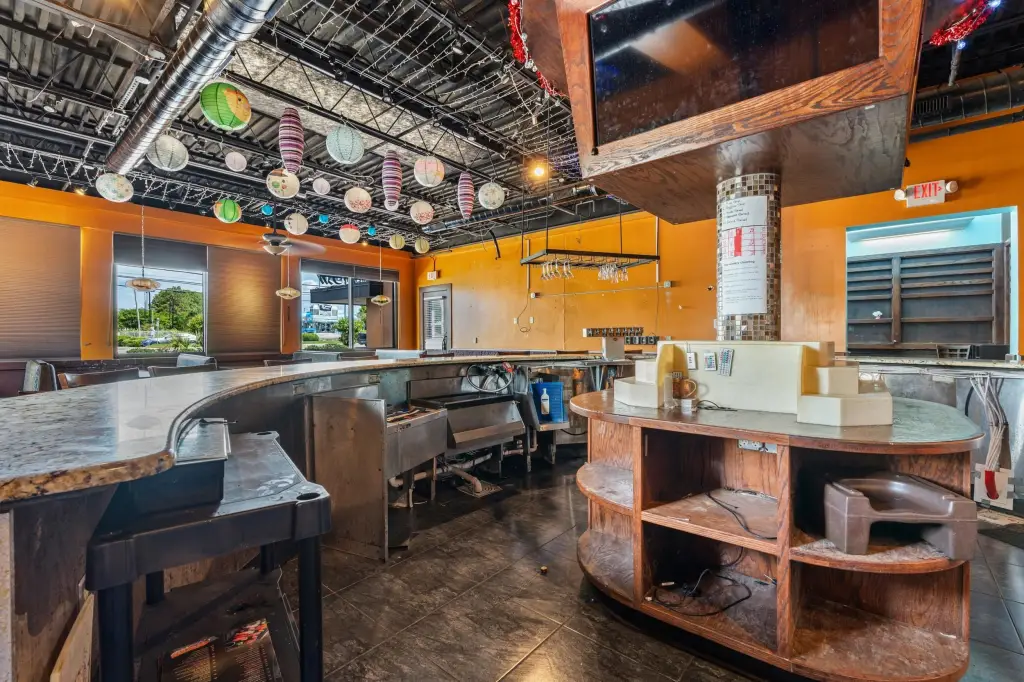
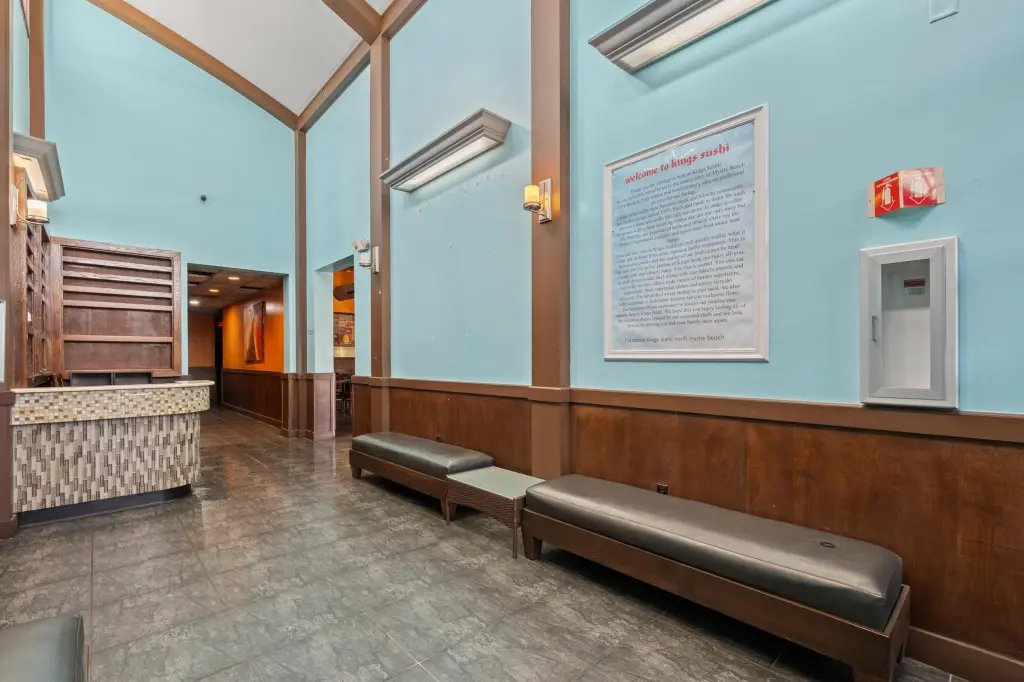
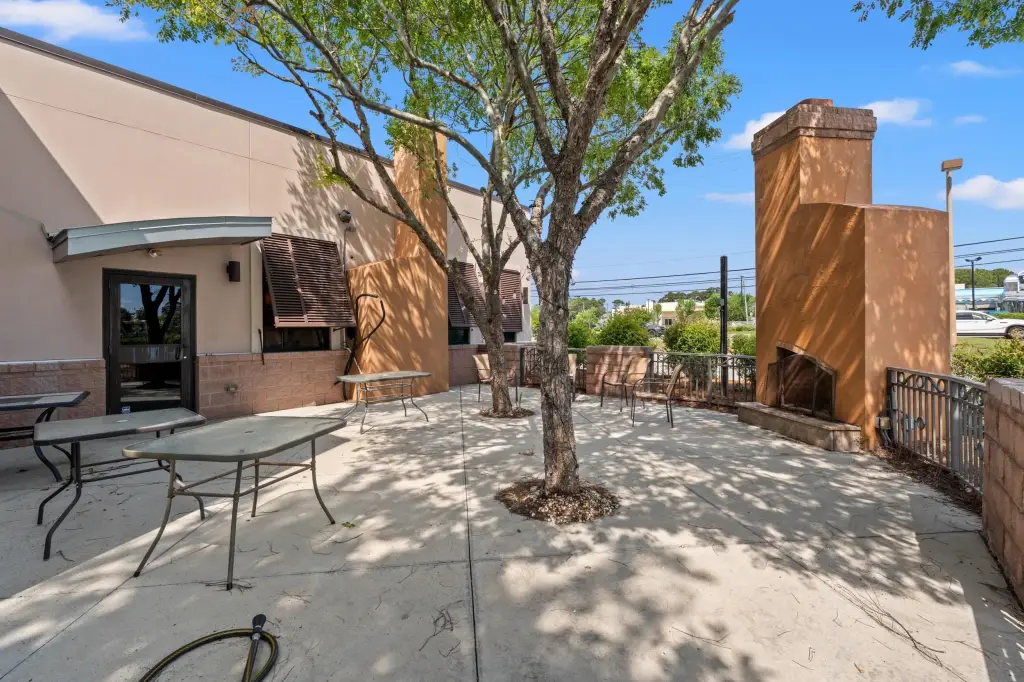
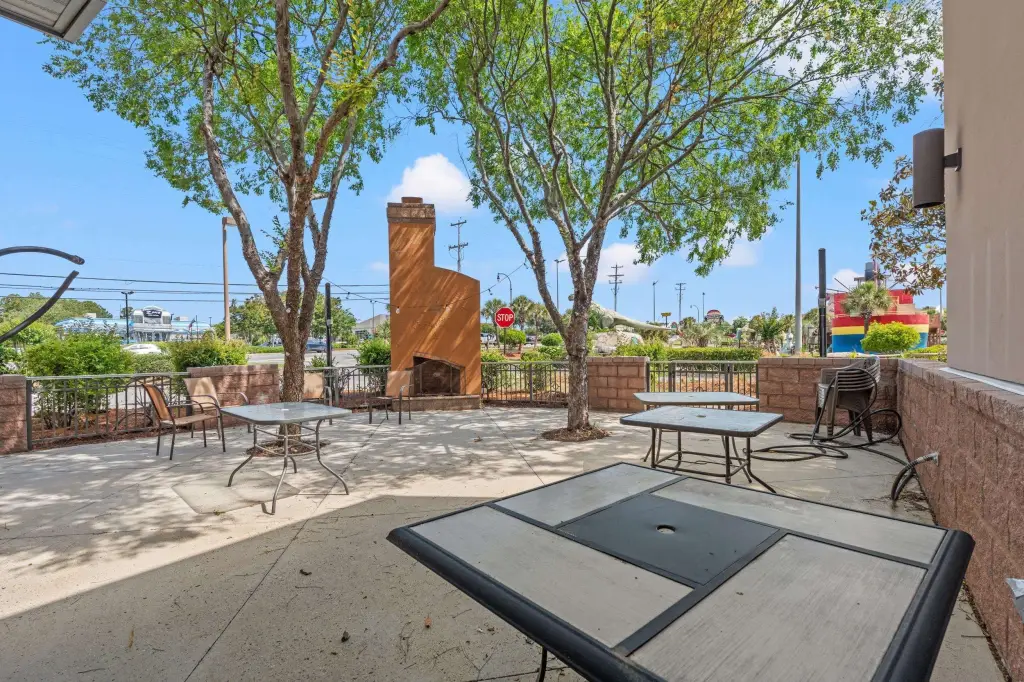
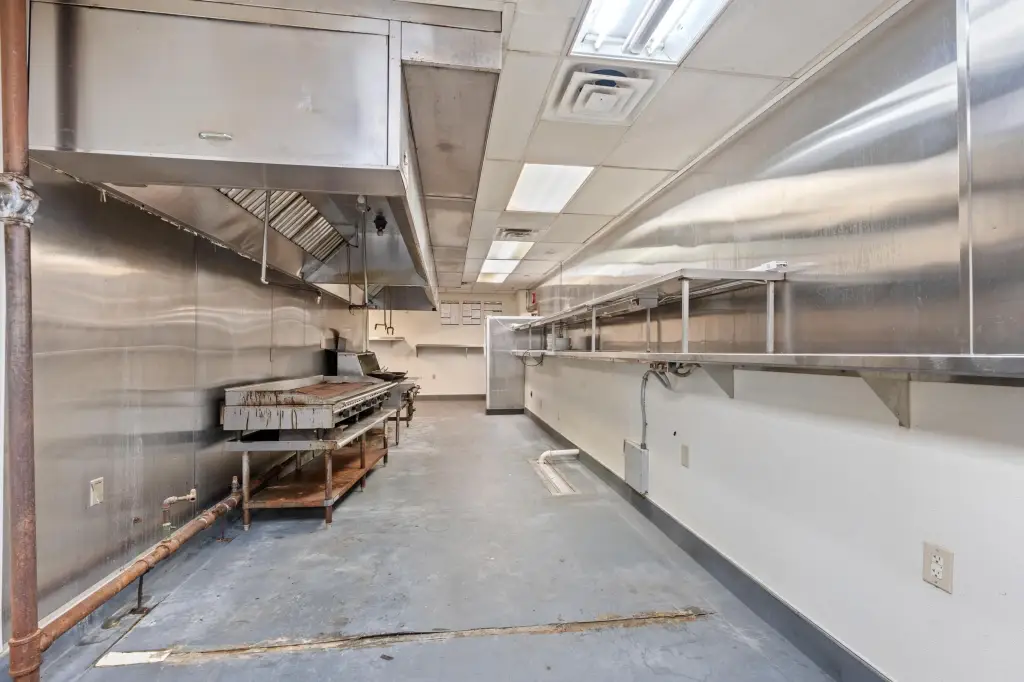
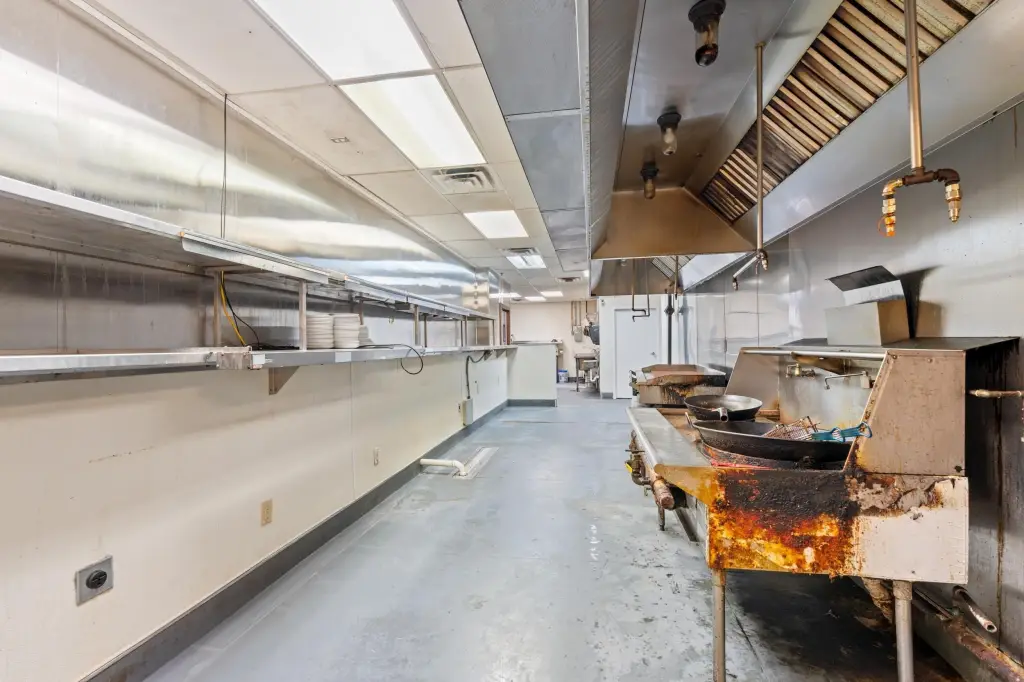
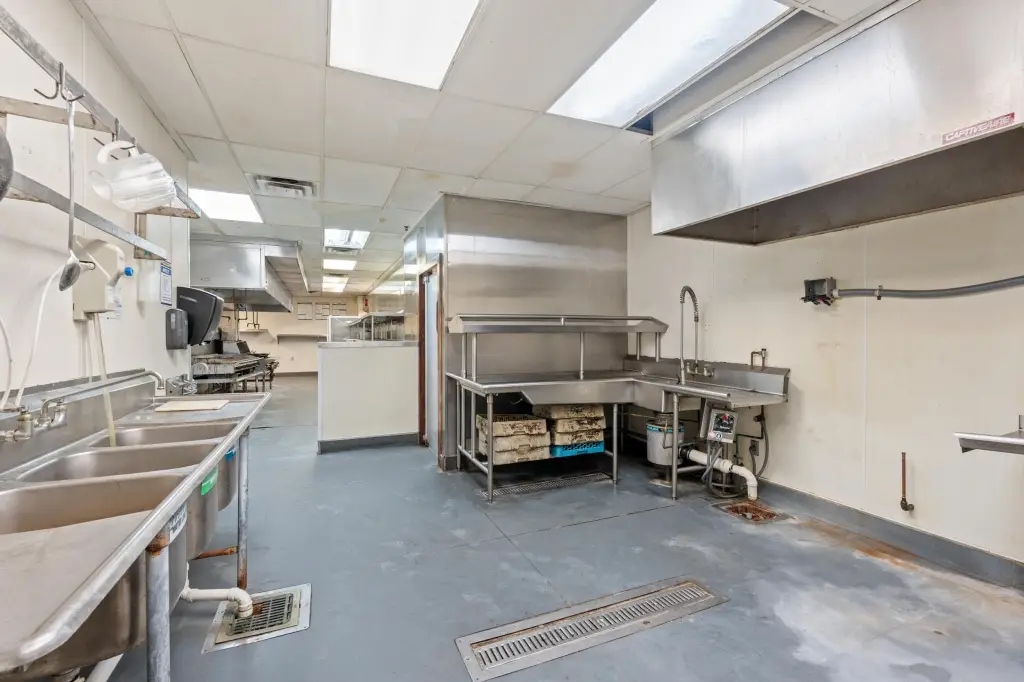
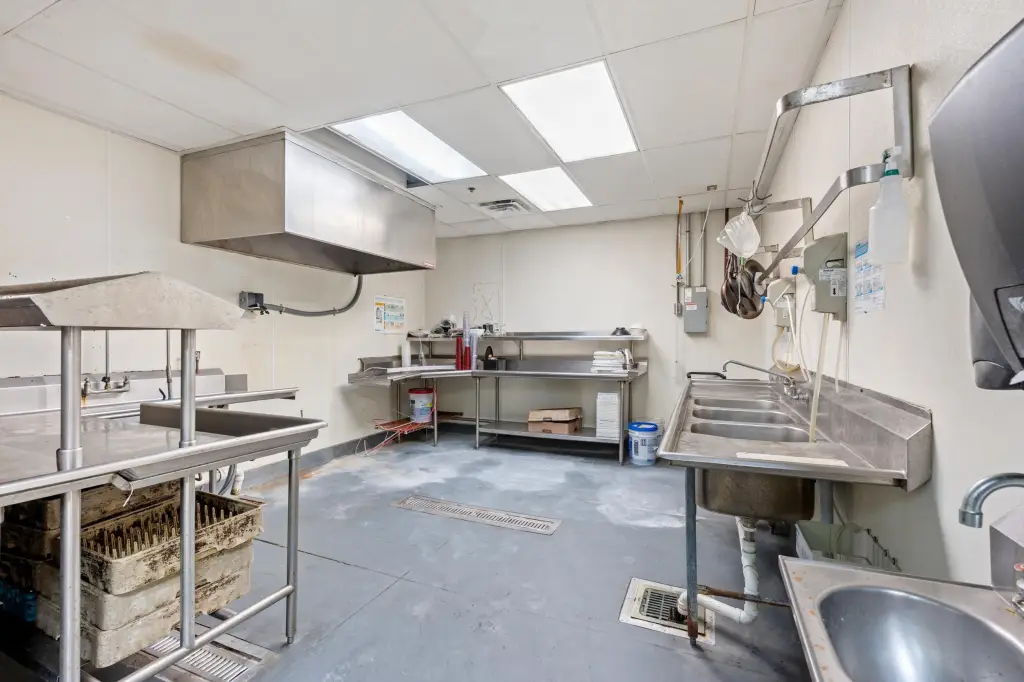
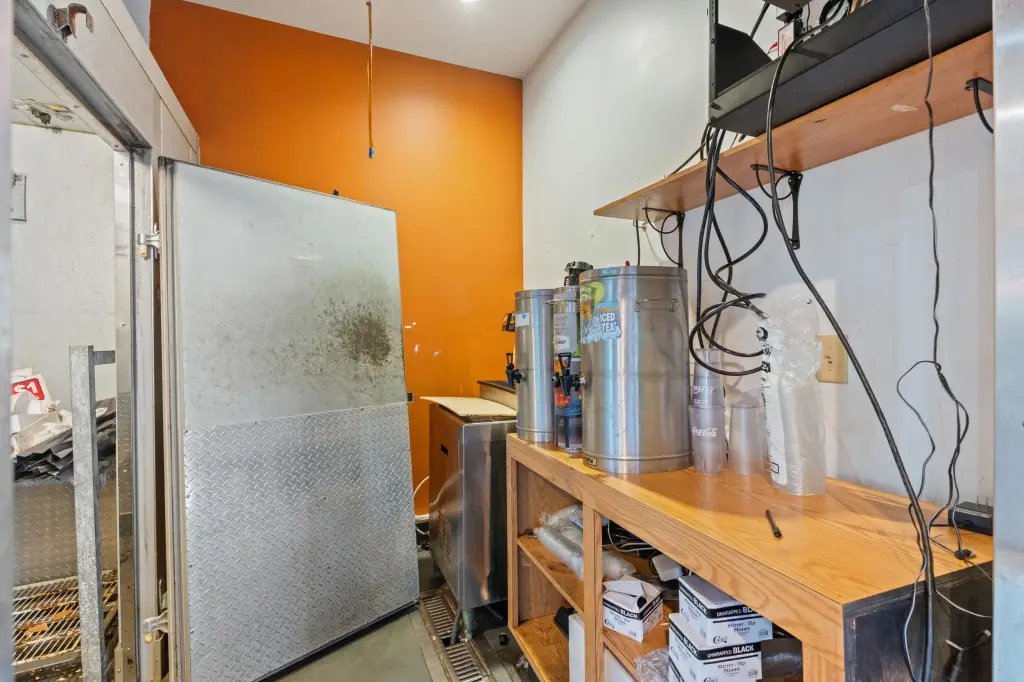
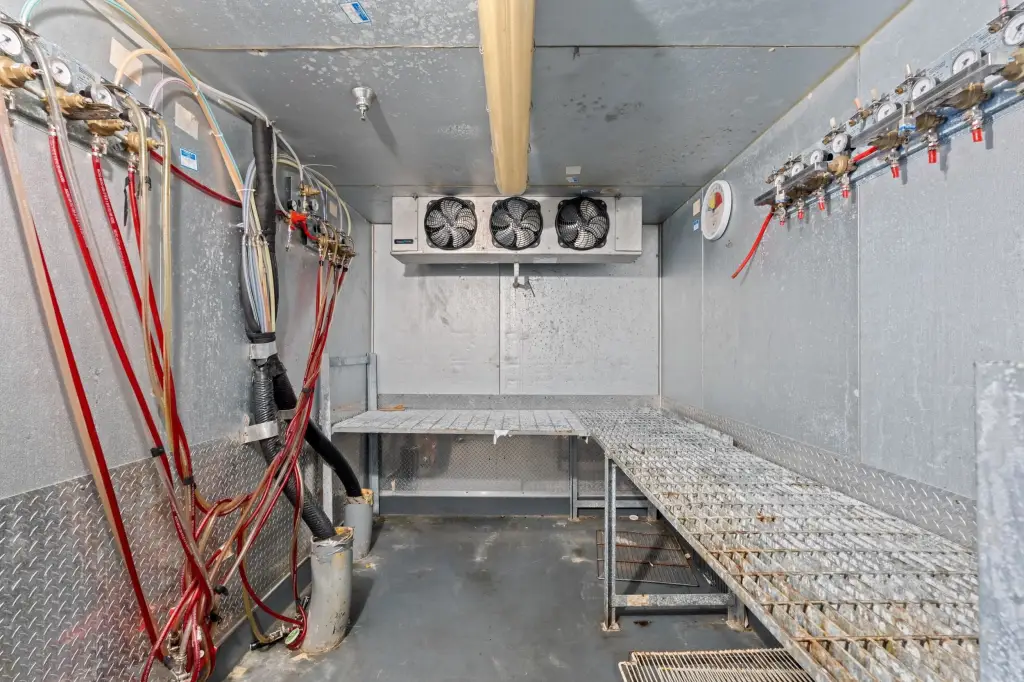
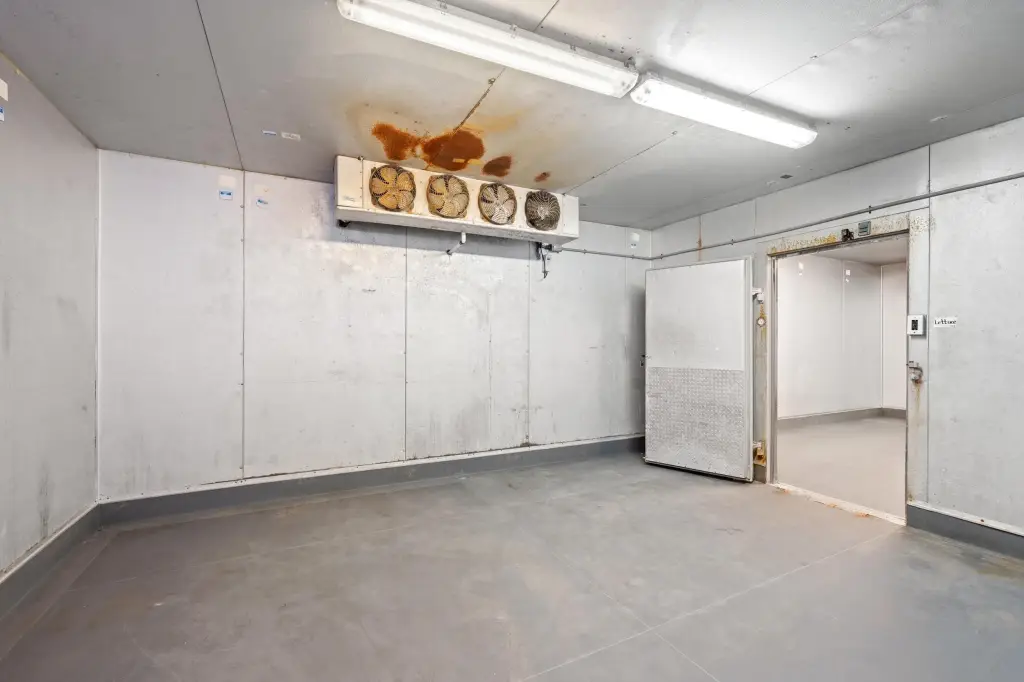
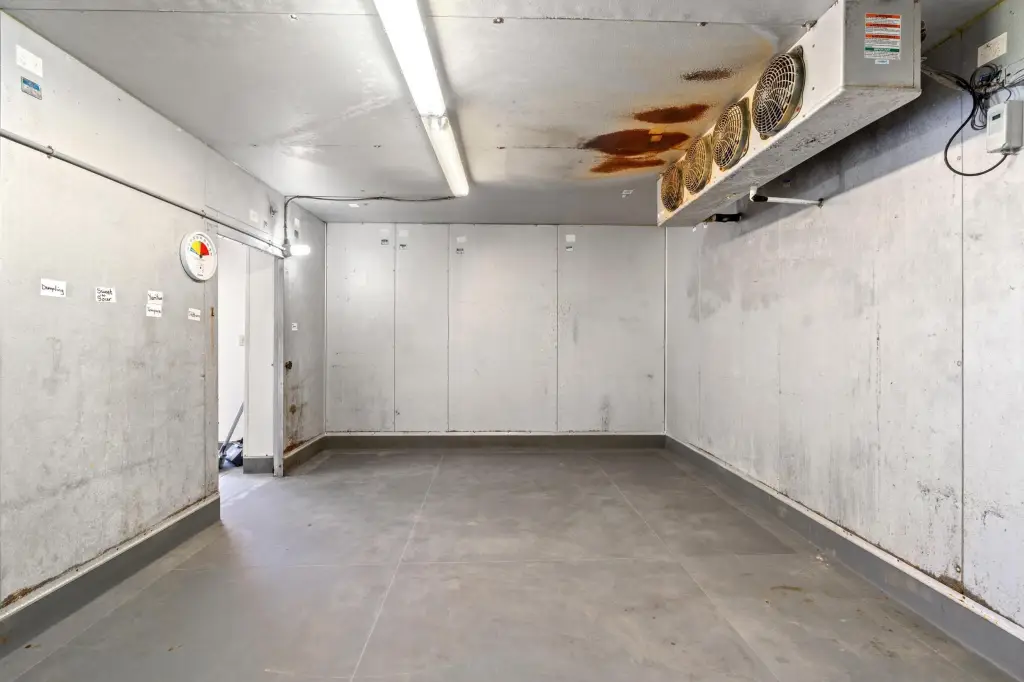
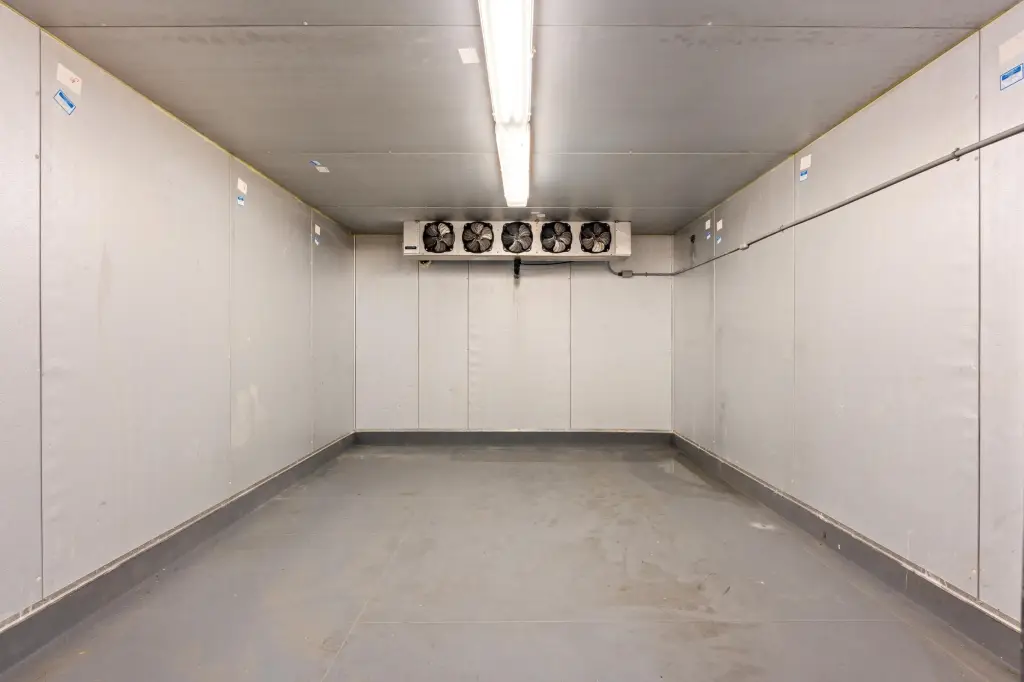
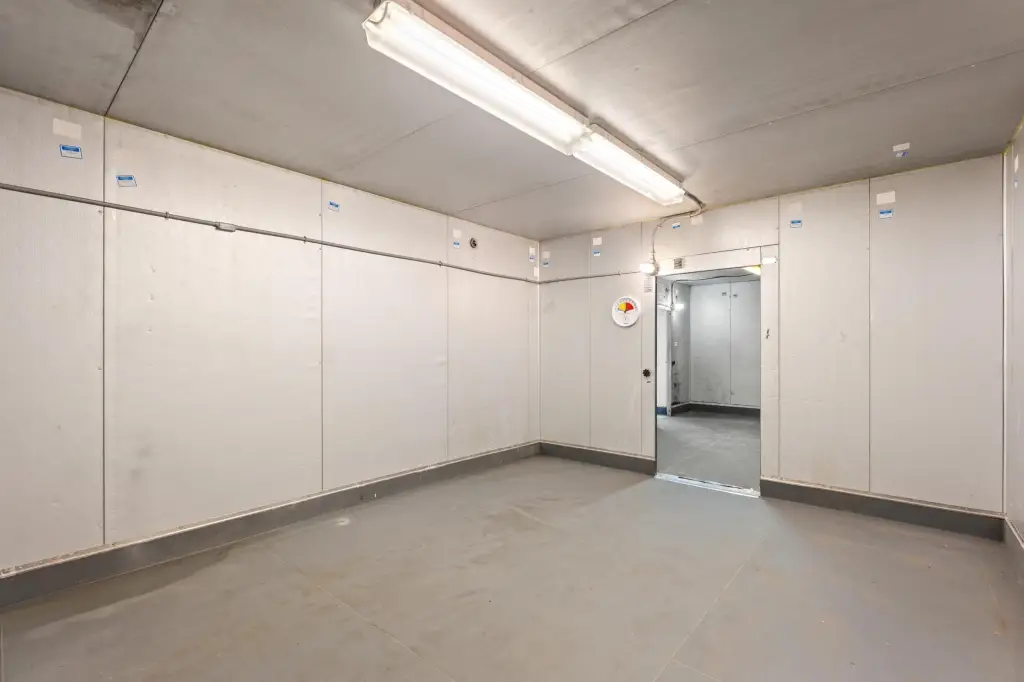
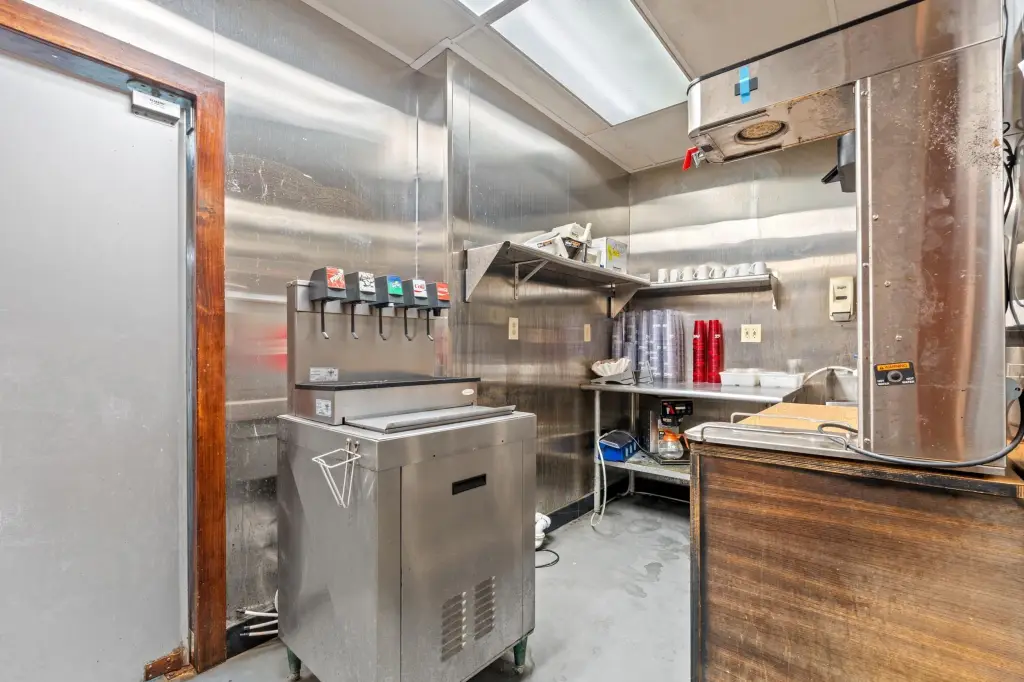
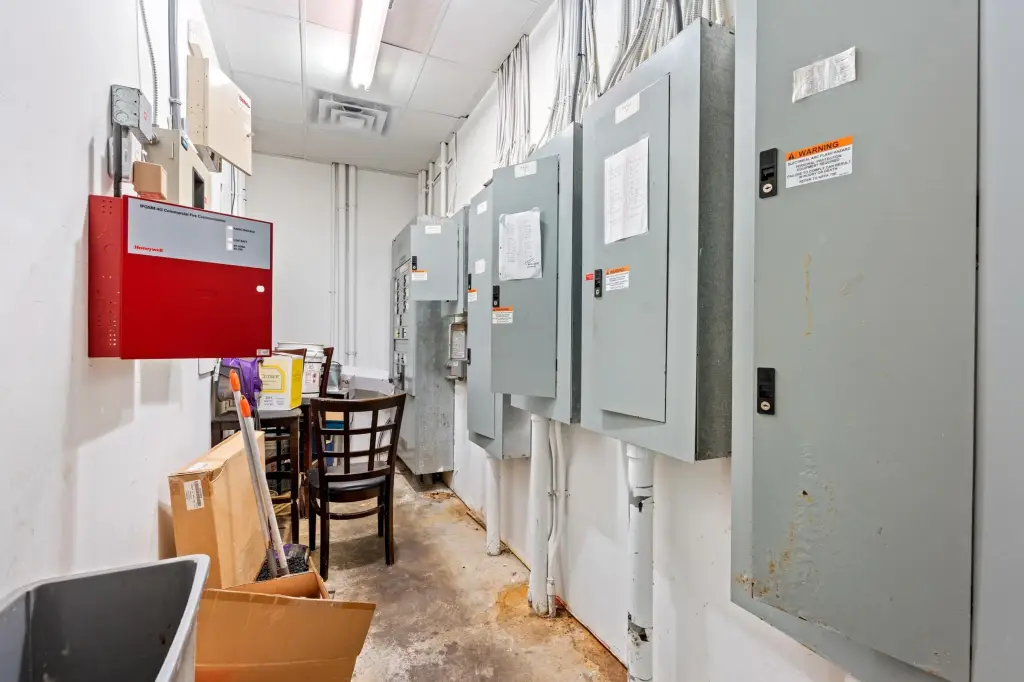
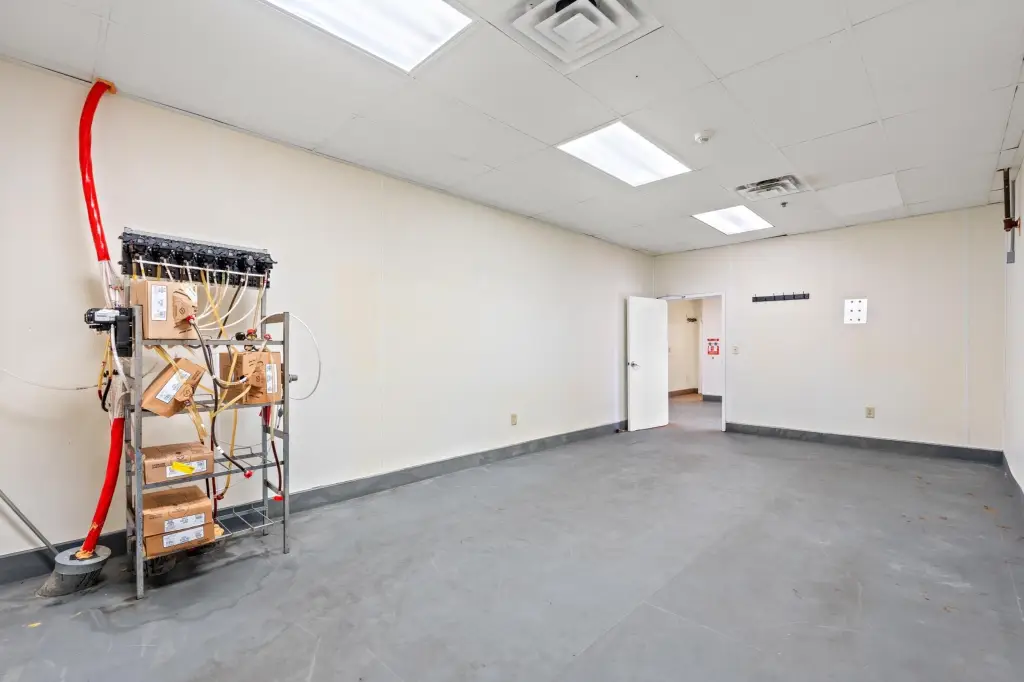
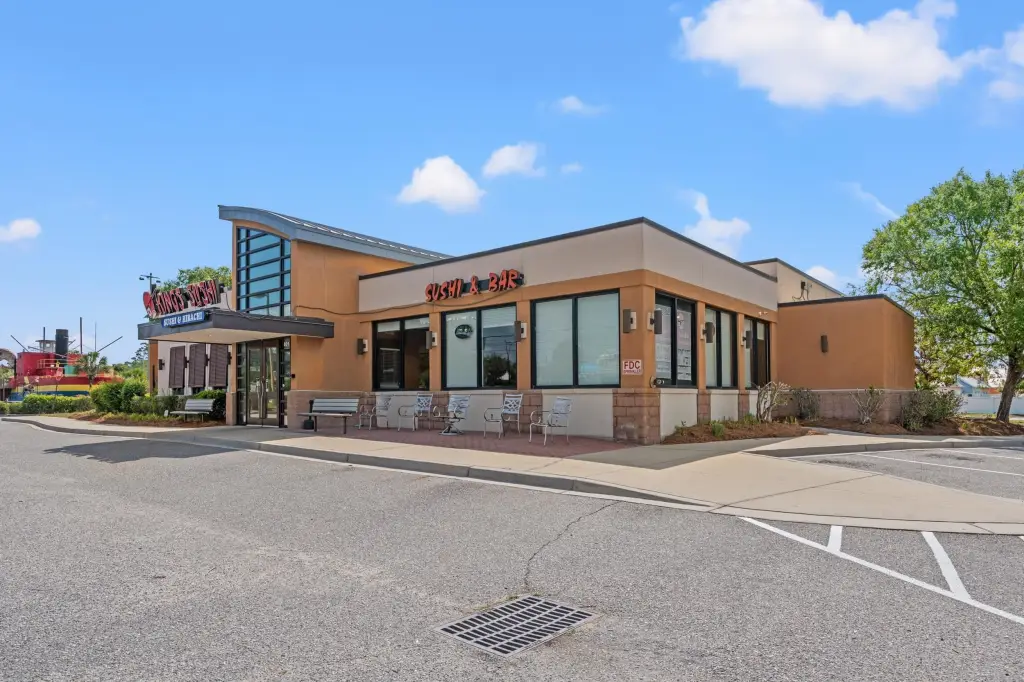
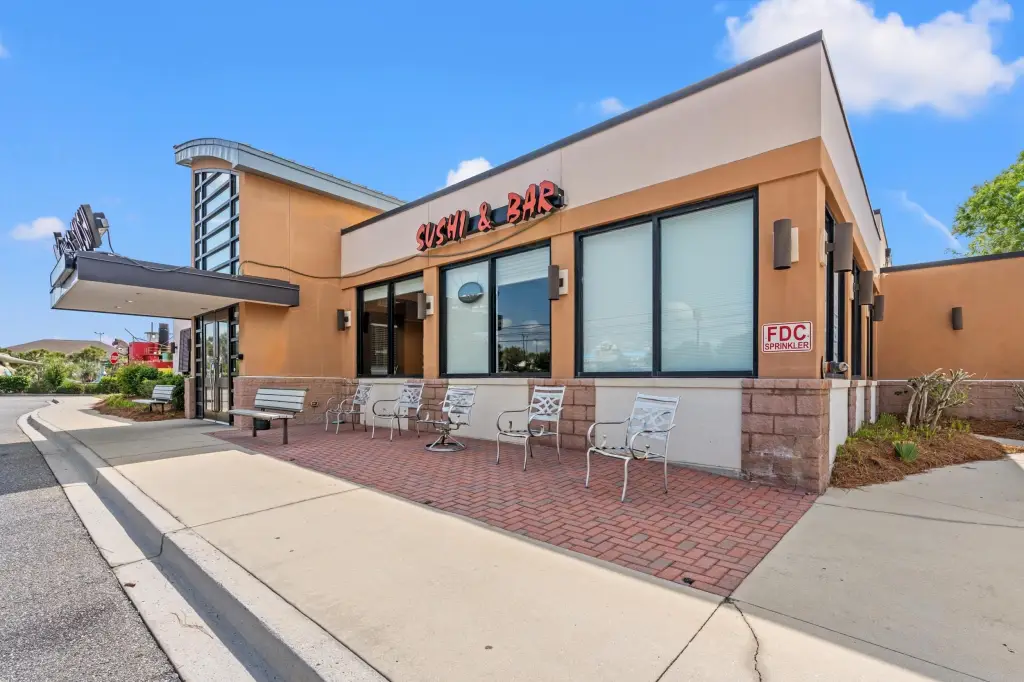
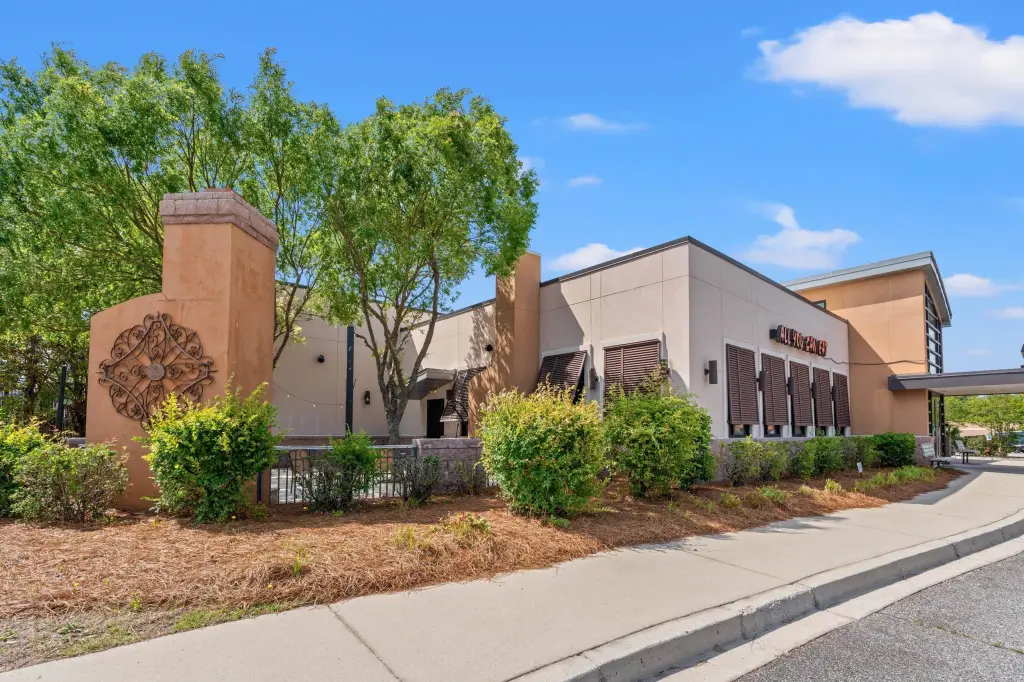
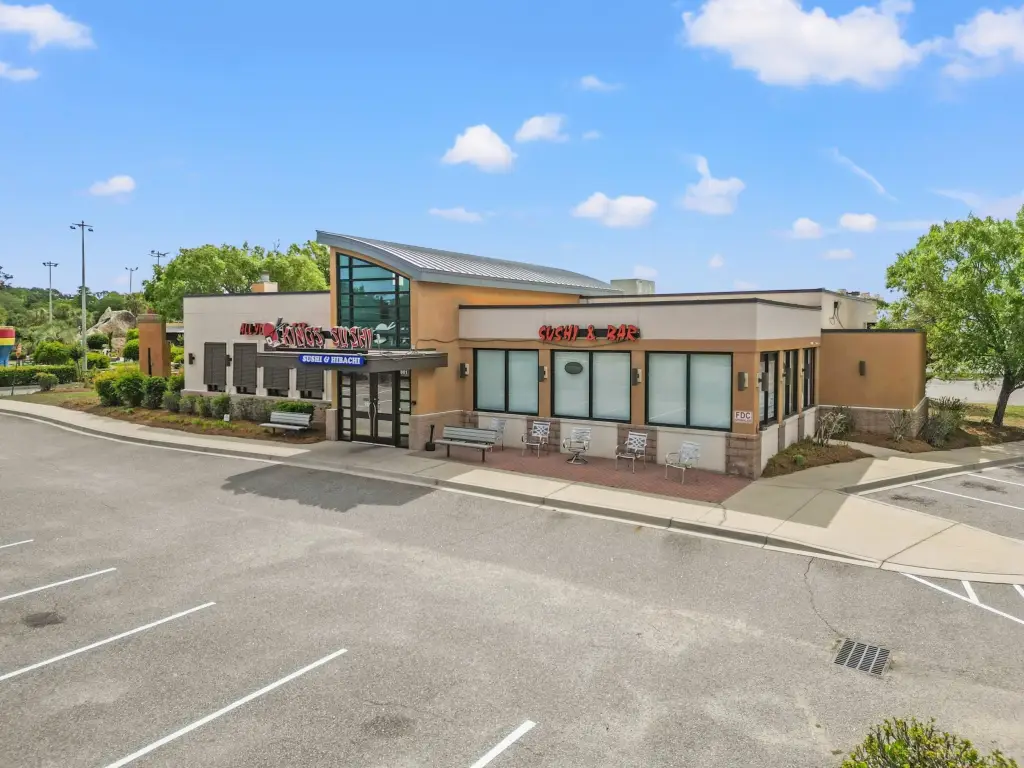
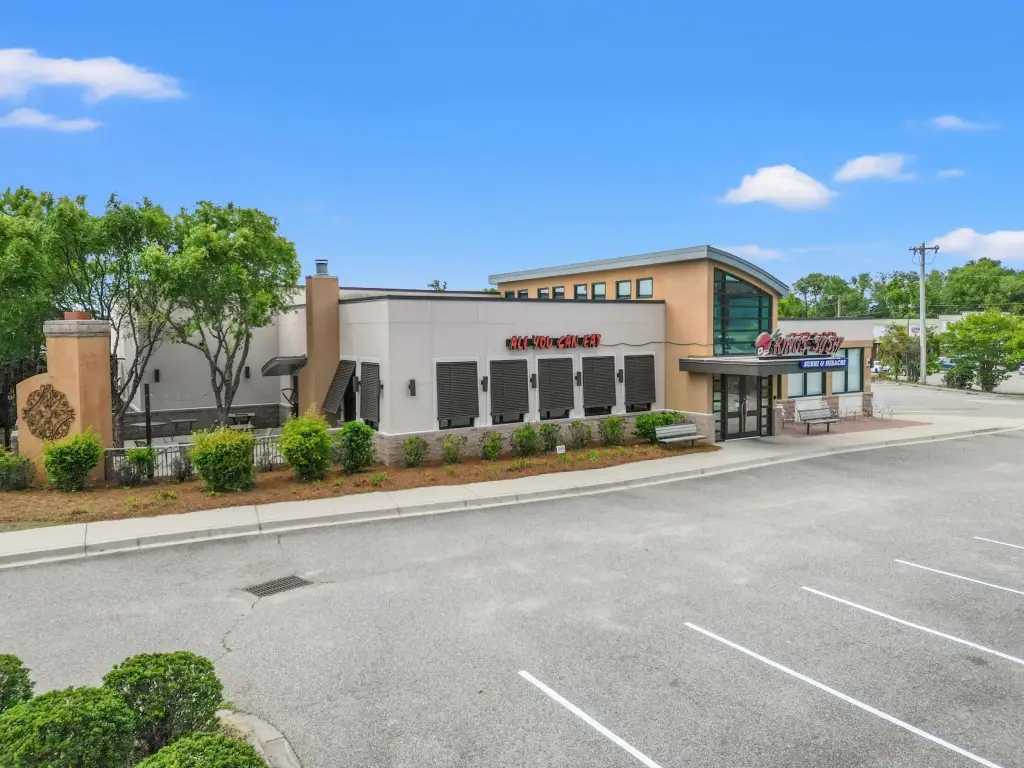
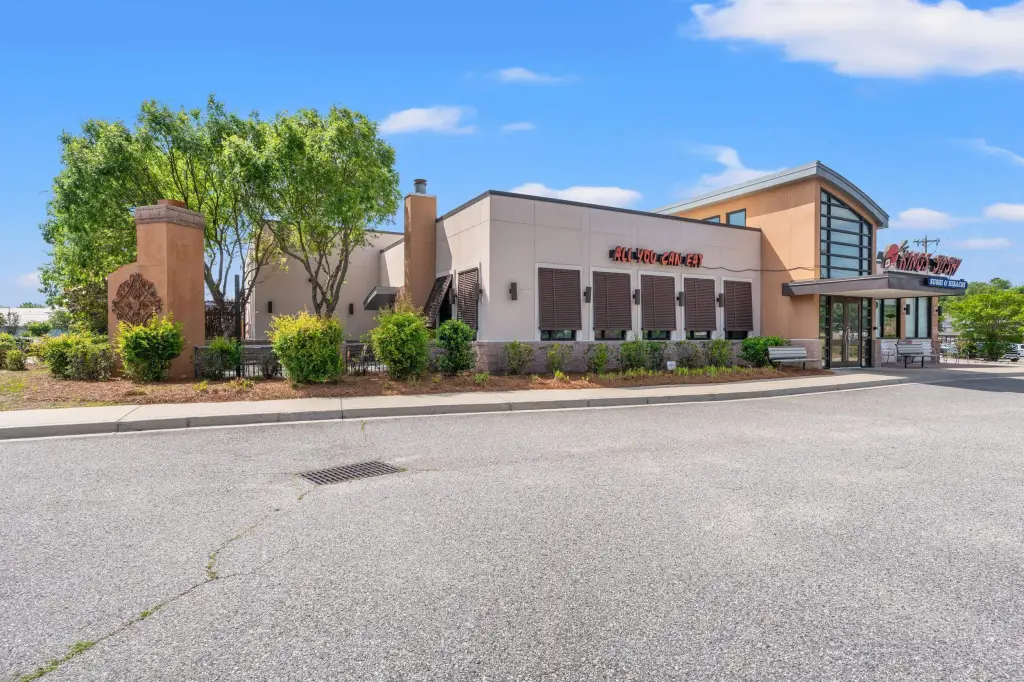
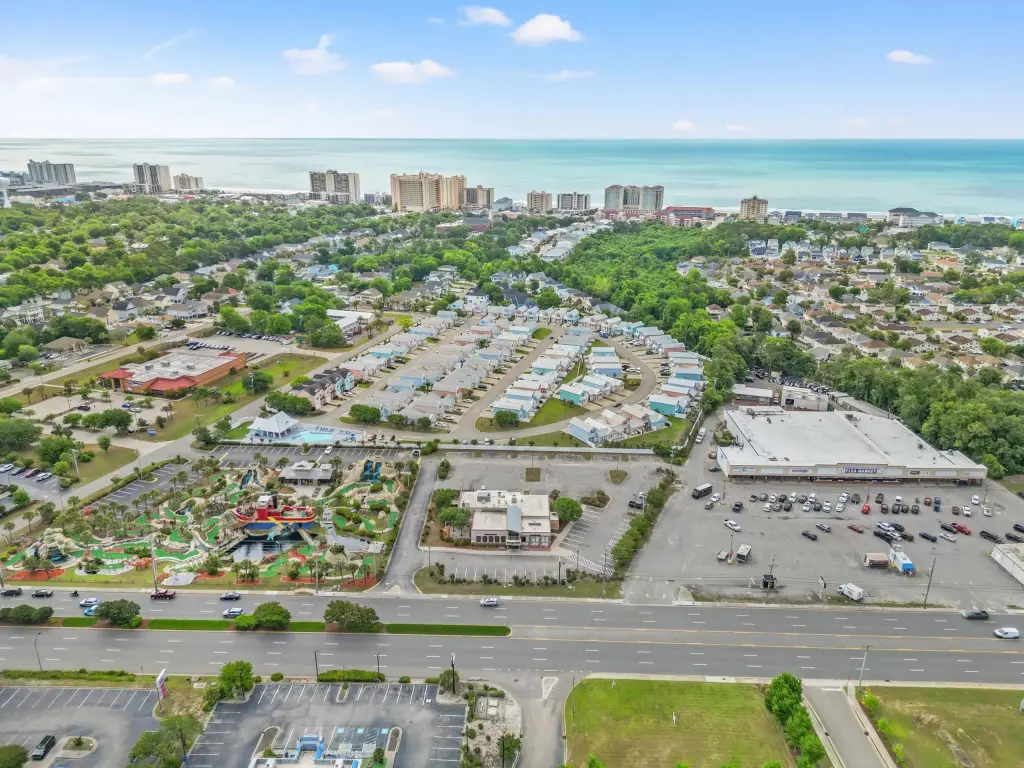
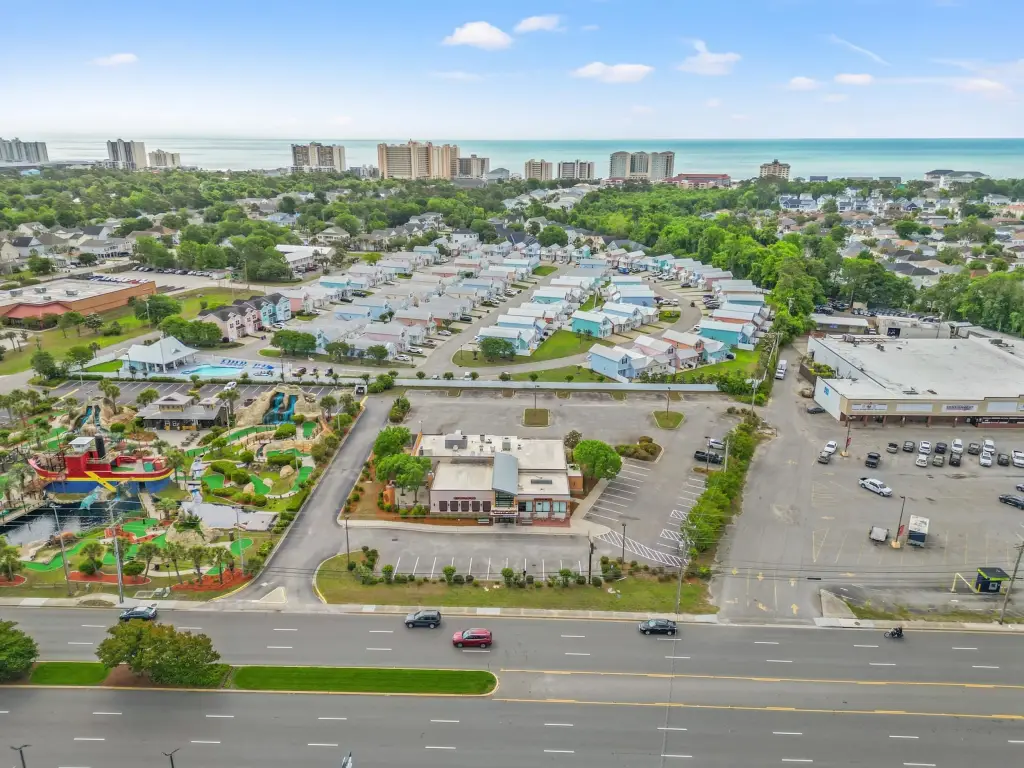
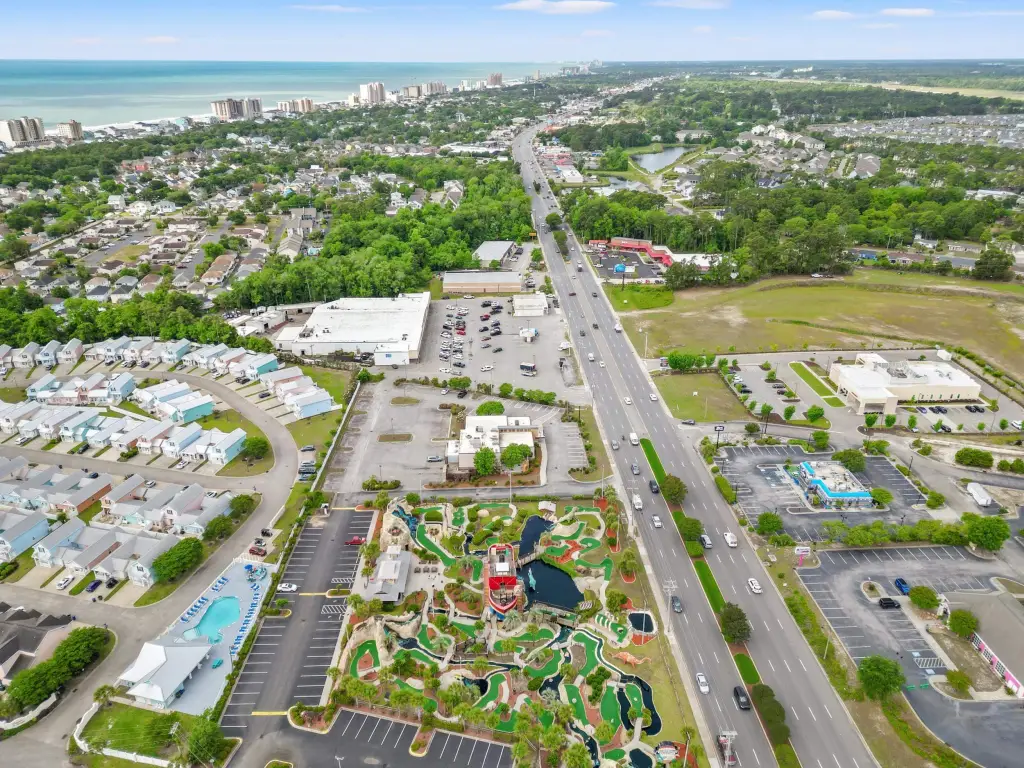
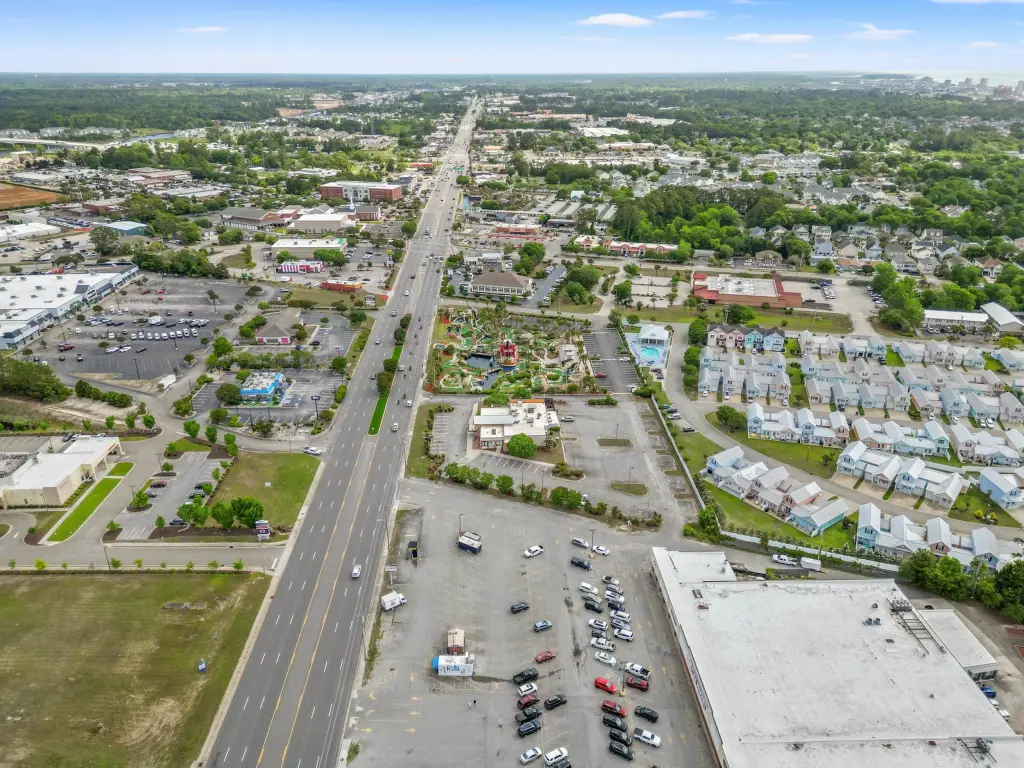
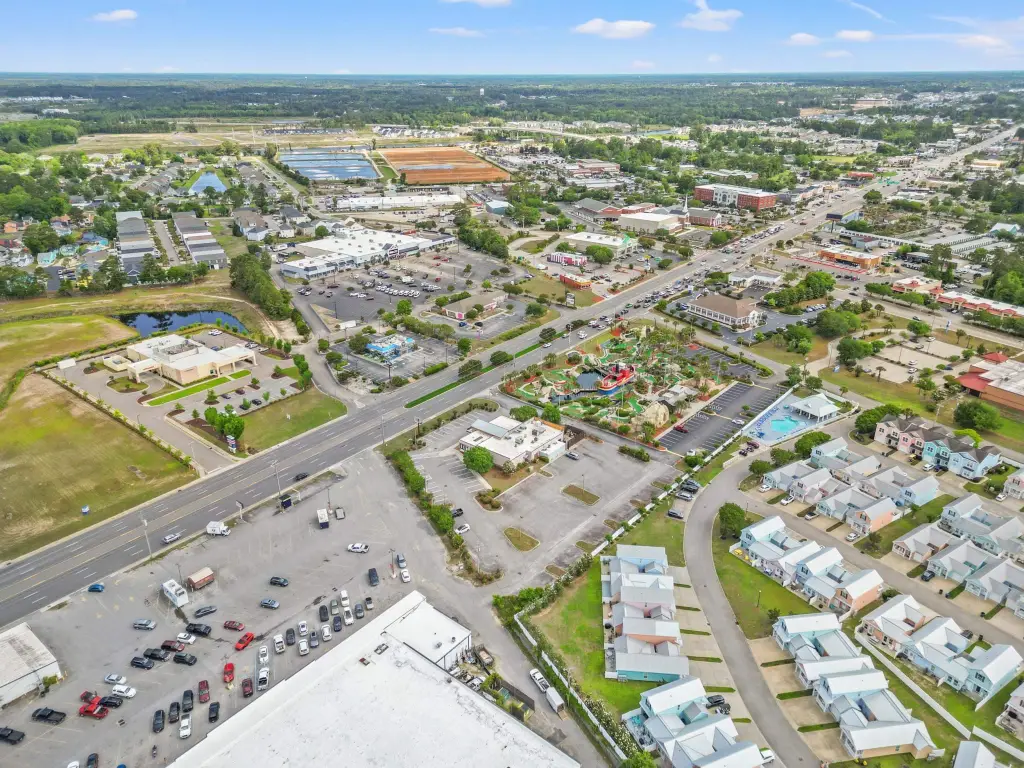
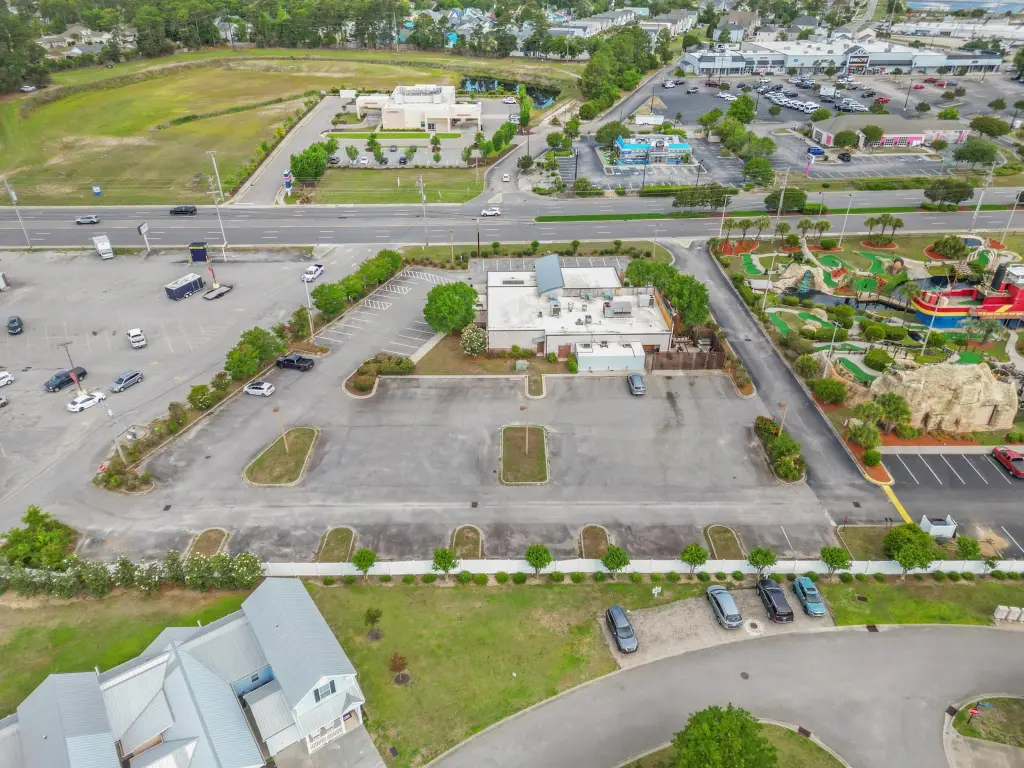
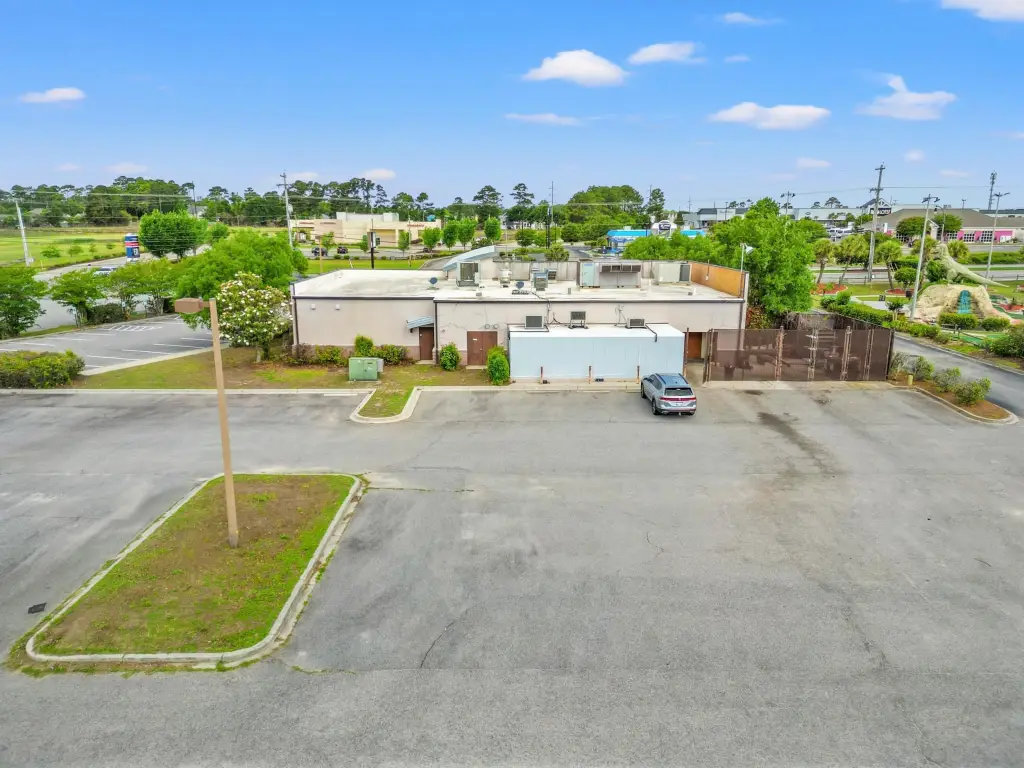
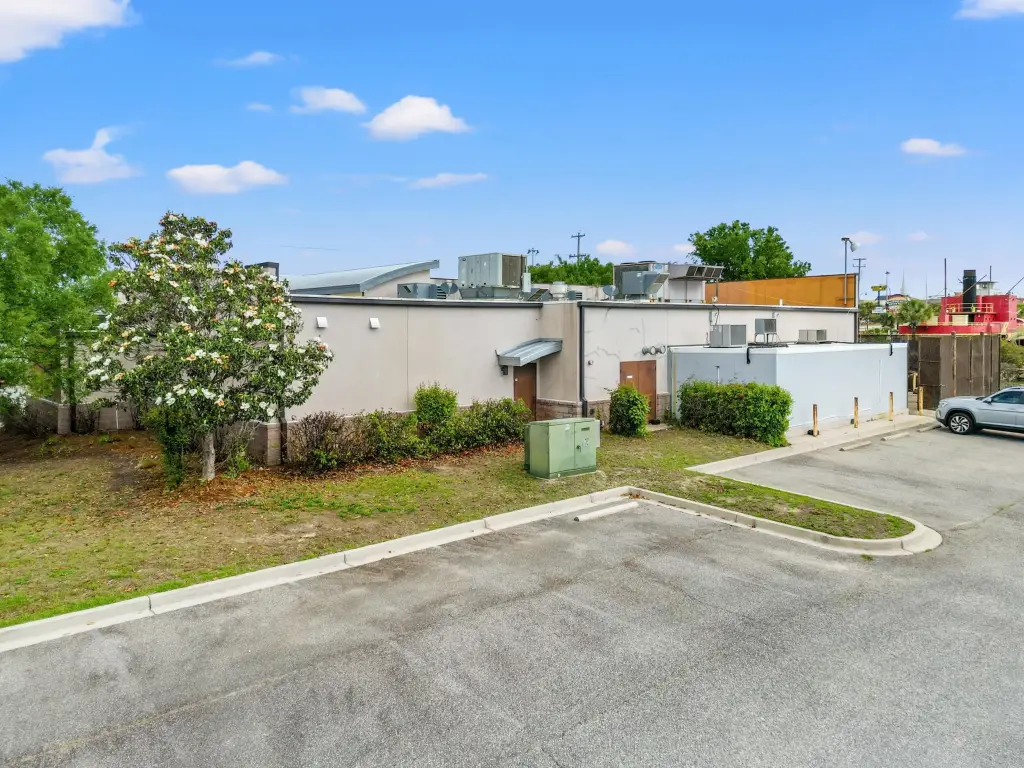
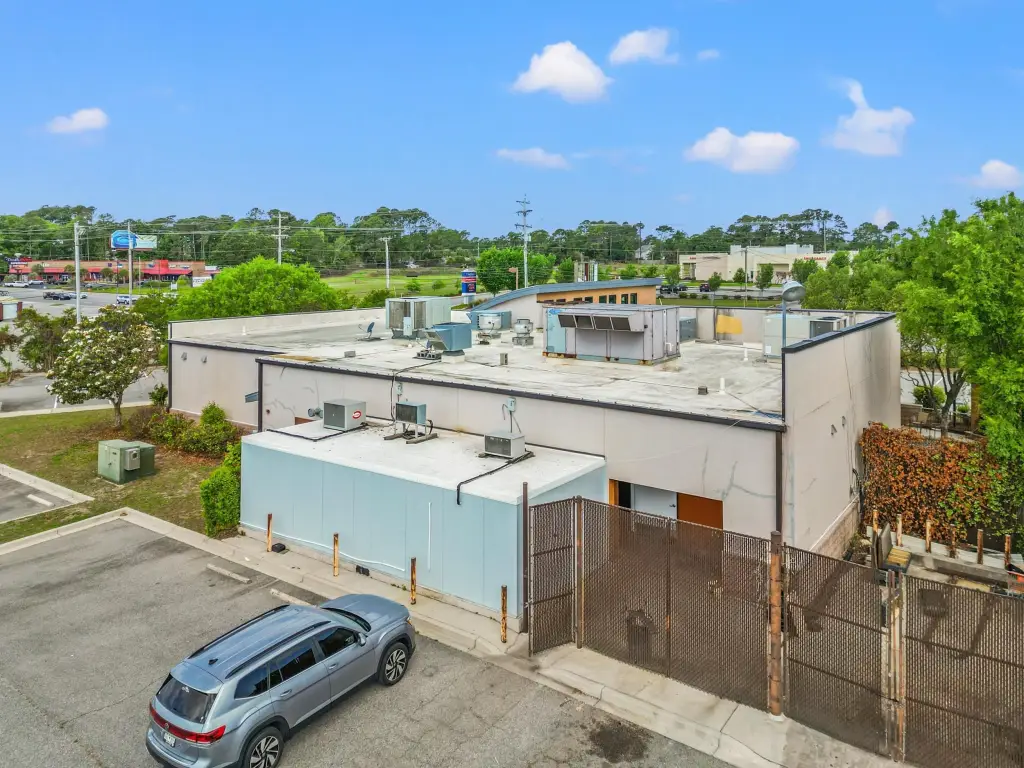
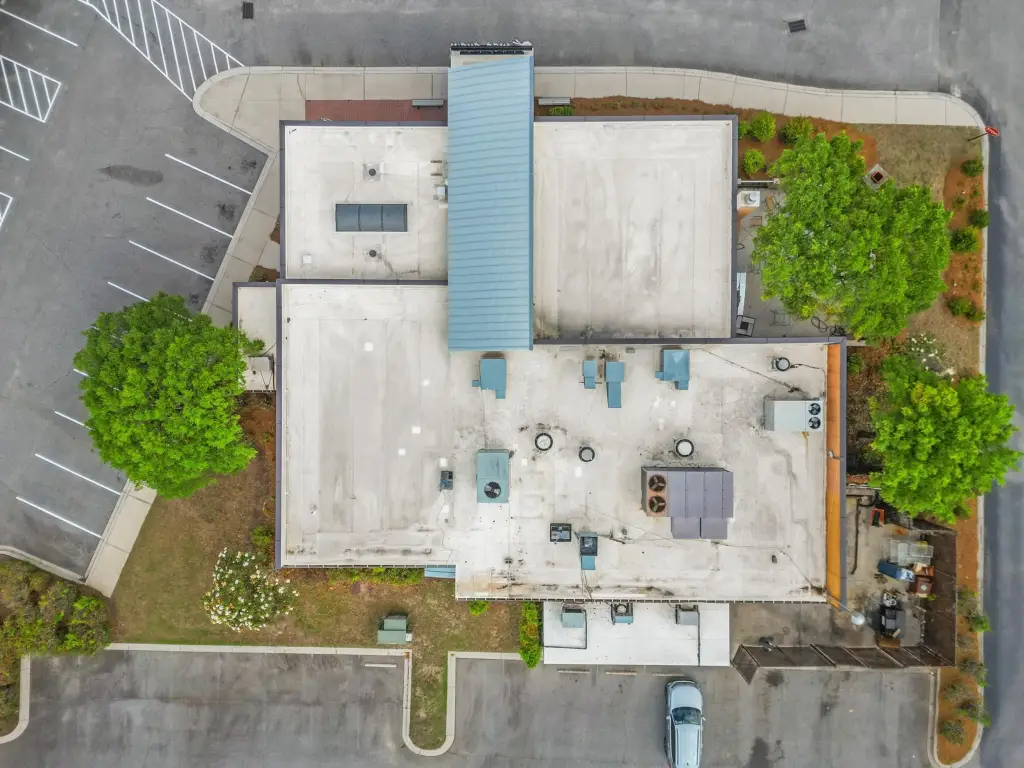
This restaurant property includes a commercial kitchen, expansive dining room, oversized bar area, private and public restrooms, office space, storage, fixtures, furniture, machinery, security, fire protection, and a sprinkler system. An outdoor patio with a fireplace extends the functional footprint for dining, entertainment, and events. The property is situated on approximately 1.75 acres and provides seating for approximately 231 guests with 124 parking spots.
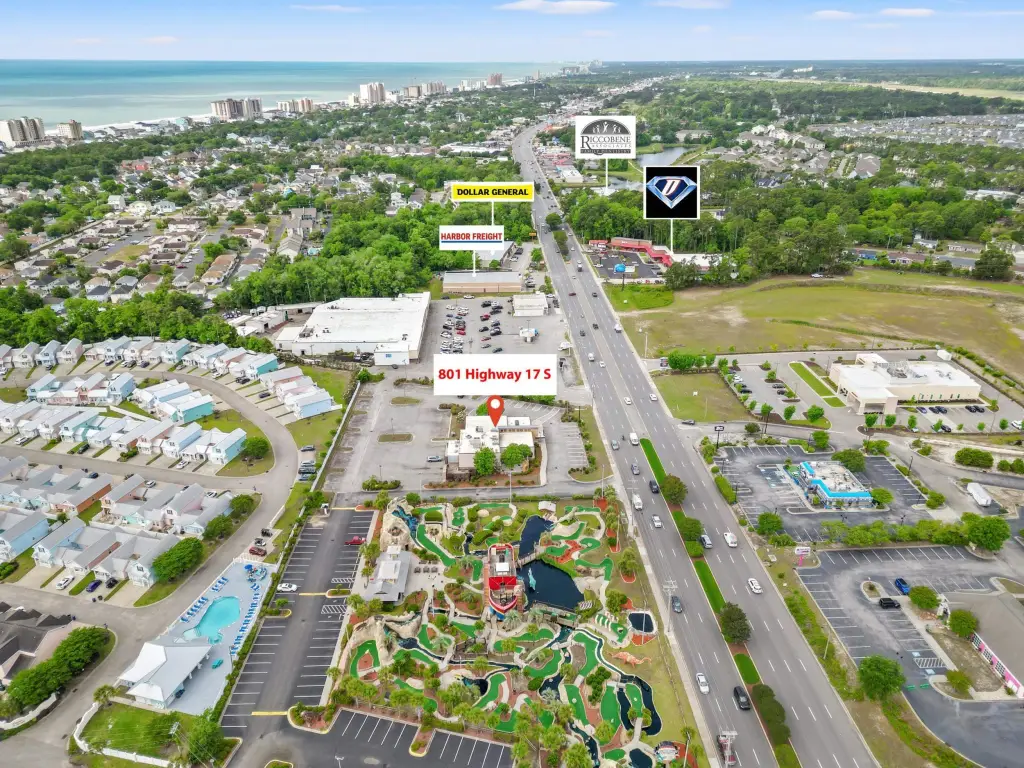
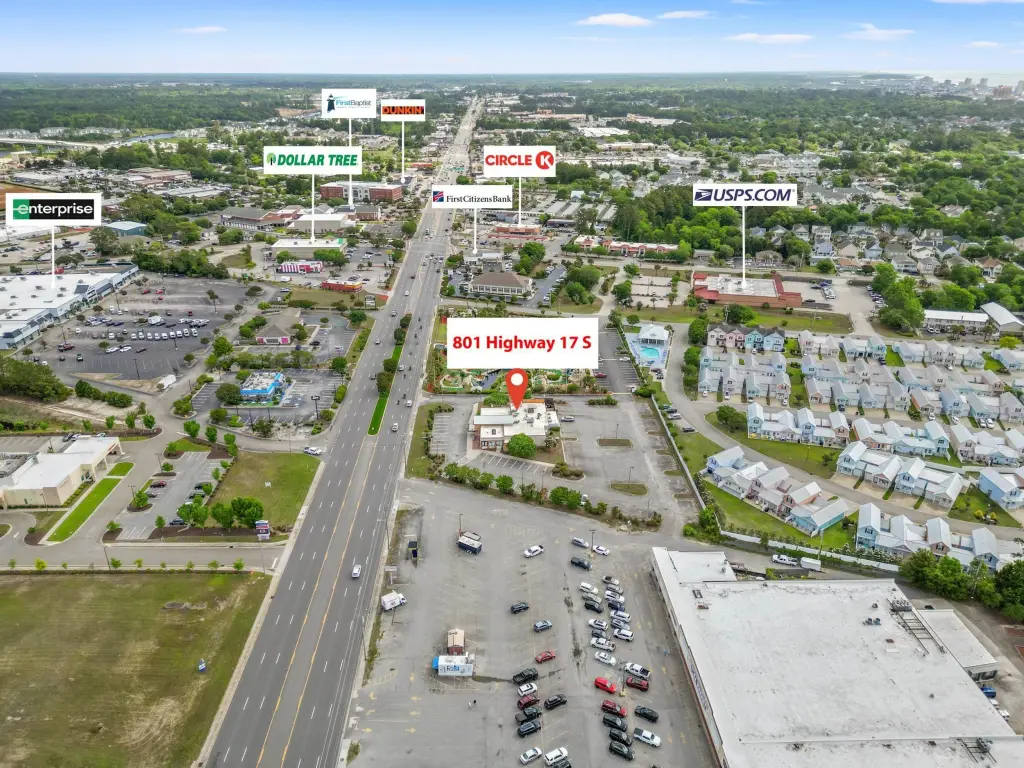
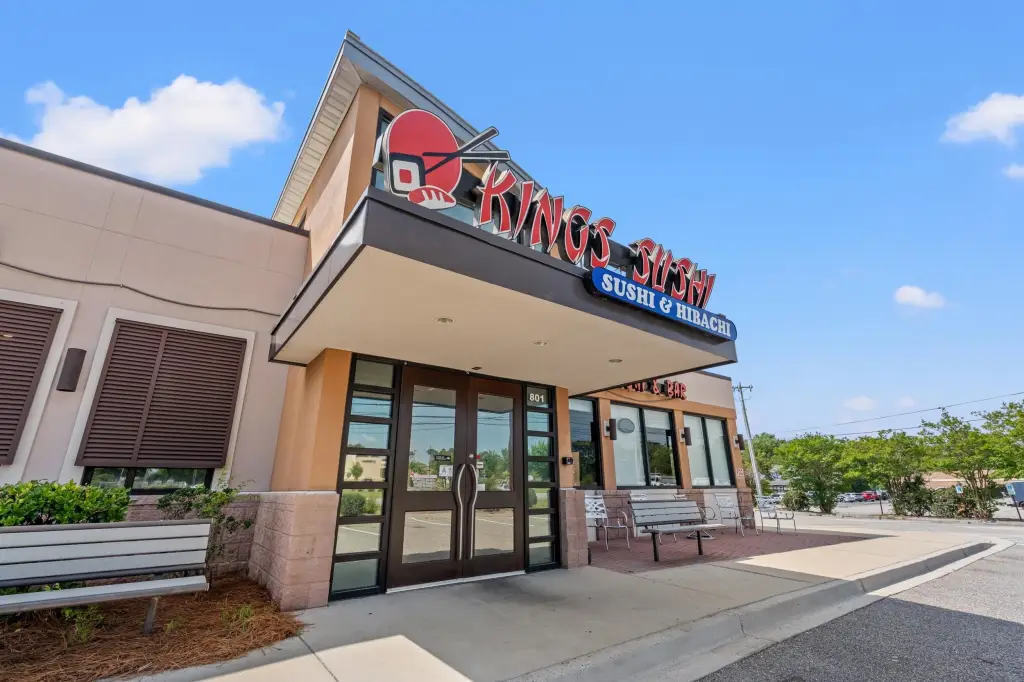
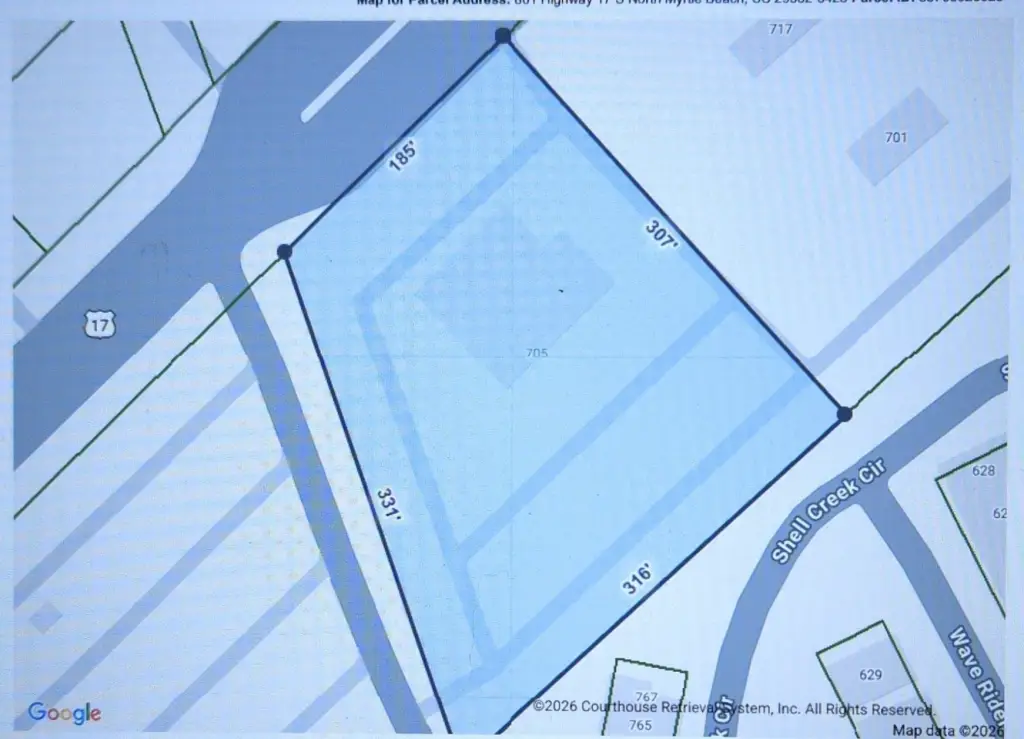
Located at 801 Hwy 17 S in North Myrtle Beach, the site offers 185 feet of frontage on Highway 17 and reported exposure to approximately 45,300 vehicles per day. It is less than half a mile from Main Street and under three-quarters of a mile from Ocean Boulevard and the beach. The property is zoned HC and includes display windows and signage.
Located at 801 Hwy 17 S in North Myrtle Beach, the site offers 185 feet of frontage on Highway 17 and reported exposure to approximately 45,300 vehicles per day. It is less than half a mile from Main Street and under three-quarters of a mile from Ocean Boulevard and the beach. The property is zoned HC and includes display windows and signage.
Key Highlights
- Approximately 1.75‑acre restaurant property with 124 parking spots
- Seating for approximately 231 guests
- 185 feet of frontage on Highway 17
Financial Insights
Estimated NOI and Cap Rate
NOI / Yr
$119,669
Cap Rate
4.79%
Suggested Prices Based on Cap Rates
Cap Rate 5%
$2,393,380
$2.4M
Cap Rate 7%
$1,709,557
$1.7M
Cap Rate 9%
$1,329,656
$1.3M
Market Conditions
NOI Build-Up for 7,254 SF
Gross rent
$163.7K $22.56/SF
− Vacancy
−$4.1K −$0.56/SF
EGI
$159.6K $22.00/SF
− OpEx
−$39.9K −$5.50/SF
NOI
$119.7K $16.50/SF
Area
Horry County, SC
Vacancy
2.50%
Lease Rate
$22.56 /SF/Yr
Expense Ratio
25.00%
Simulate Cap Rate and NOI
Suggested Prices Based on Cap Rates
Cap Rate 5%
$2,393,380
Cap Rate 7%
$1,709,557
Cap Rate 9%
$1,329,656
Alternative Uses
Best Use
Specialty Retail
$1.71M
$1.50M – $1.99M
NOI $119,669 @ 7.0% cap · market cap 4.79%
Second Best
—
—
no second resolved use
Theoretical Best
Office A
$1.84M
$1.61M – $2.14M
NOI $128,692 @ 7.0% cap · market cap 5.15%
Zoning and permitted uses should be independently verified with authorities.
Property Analytics
Unlock full access to Insights
Subscribe to Realmo Intelligence
Open Analytics
Current Use
Lease Details
45,300 VPD
Traffic count
Yes
Highway access
Location Intelligence
Trade Area within ½ mile
609
Businesses Nearby
424k
Monthly Visits Nearby
Under-served
Demand for This Use
Explore this area
Business Placement
Foot Traffic Nearby
Dining 41%
Superstores 28%
Shops & Services 11%
Home Improvements & Furnishings 9%
Walmart
Superstores
117,860 visits/mo
0.5 miles
Chick-fil-A
Dining
39,272 visits/mo
0.2 miles
The Home Depot
Home Improvements & Furnishings
34,519 visits/mo
0.3 miles
Food Lion Grocery Store
Groceries
26,084 visits/mo
0.2 miles
Cook Out
Dining
23,520 visits/mo
0.5 miles
Demographics for 29582, SC
18,897
Population
27,559
Households
0.7
Avg Household Size
62
Median Age
38%
College-Educated
94%
High-School Grad
21.9 sq mi
ZIP Area
863
Density / Sq Mi
$71,030
Median Household Income
$36,906
Median Earnings
$1,194
Median Rent
$370,700
Median Home Value
Check the figures for this property
Cap Rate, Value Estimation, Potential NOI and more
View Realmo Analytics
Market
Vacancy Rate% for Retail in South region

Questions? Ask Rey
Realmo’s AI knows this listing — price, zoning, demand, history. Ask anything.






Frequently Asked Questions
What type of property is this?
Conventional restaurant - Equipped restaurant property with a large kitchen, bar area, outdoor patio, and extensive on-site parking.
Where is this conventional restaurant located?
The property is located at 801 Hwy 17 S North Myrtle Beach, SC.
What is the asking price?
The asking price for this property is $2,500,000.
What are key features of this property?
This property features: Approximately 1.75‑acre restaurant property with 124 parking spots; Seating for approximately 231 guests; 185 feet of frontage on Highway 17