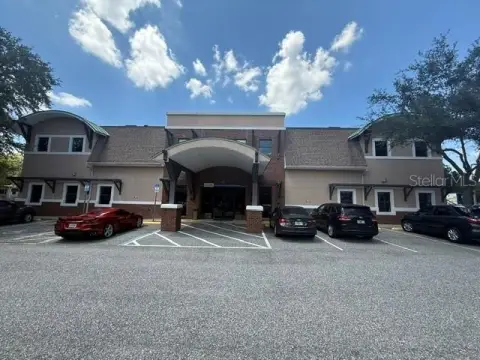
Single-Tenant Medical Office
For Sale
$5,600,000
80 W Michigan St, Orlando, FL 32806
Purpose-built medical office located near Orlando Health’s flagship campus and currently 100% leased to a single AA-rated tenant.
Property Size9,300 SF
Days on Market110
Property Features for 80 W Michigan St
General Information
Standard status
Active
Size
9,300 SF
Property subtype
Office - Medical Office
Occupancy
100%
Building Details
Building Size
9,300 SF
Year Built
2010
Tenancy
Single
Listing Agency:
Bishop Beale Duncan
Listed By:
Michael F. Beale · License #191385
(407) 426-7702
Source:
Commercialcafe
Added: Jun 23
Changed: Sep 27
Last Checked: Oct 9 at 4:35PM
Displayed information is deemed reliable but is not guaranteed and should be independently verified. All listing content including descriptions, pricing, images are the copyrighted material of Bishop Beale Duncan
Investment Insights
Based on property information with market context.
This purpose-built single-tenant medical office building was developed for medical use and is currently 100% leased to a single AA-rated medical tenant.
The property is situated next to the Heart of Orlando Health’s flagship campus and lies within the City of Orlando’s Special Plan designation for the SODO plan area. The overlay is intended to encourage redevelopment and establish the Division Avenue and Kaley Street intersection as a western gateway into the south downtown subarea.
For medical operators and healthcare-oriented investors, the property offers a purpose-built configuration tied to an existing, long-term tenant profile. With the building already leased to one medical tenant, it may be well suited for buyers seeking a stabilized medical asset within the SODO plan area near a major healthcare anchor.
The property is situated next to the Heart of Orlando Health’s flagship campus and lies within the City of Orlando’s Special Plan designation for the SODO plan area. The overlay is intended to encourage redevelopment and establish the Division Avenue and Kaley Street intersection as a western gateway into the south downtown subarea.
For medical operators and healthcare-oriented investors, the property offers a purpose-built configuration tied to an existing, long-term tenant profile. With the building already leased to one medical tenant, it may be well suited for buyers seeking a stabilized medical asset within the SODO plan area near a major healthcare anchor.
Key Highlights
- Purpose‑built single‑tenant medical office (MOB) built in 2010
- 100% leased with a single AA‑rated medical tenant
- Located near Orlando Health’s flagship campus
Financial Insights
Estimated NOI and Cap Rate
NOI / Yr
$173,678
Cap Rate
3.10%
Suggested Prices Based on Cap Rates
Cap Rate 5%
$3,473,560
$3.5M
Cap Rate 7%
$2,481,114
$2.5M
Cap Rate 9%
$1,929,756
$1.9M
Market Conditions
NOI Build-Up for 9,300 SF
Gross rent
$279.0K $30.00/SF
− Vacancy
−$47.4K −$5.10/SF
EGI
$231.6K $24.90/SF
− OpEx
−$57.9K −$6.23/SF
NOI
$173.7K $18.67/SF
Area
Orlando, FL
Vacancy
17.00%
Lease Rate
$30.00 /SF/Yr
Expense Ratio
25.00%
Simulate Cap Rate and NOI
Suggested Prices Based on Cap Rates
Cap Rate 5%
$3,473,560
Cap Rate 7%
$2,481,114
Cap Rate 9%
$1,929,756
Alternative Uses
Best Use
Office B
$2.48M
$2.17M – $2.89M
NOI $173,678 @ 7.0% cap · market cap 3.10%
Second Best
Healthcare Medical
$1.89M
$1.66M – $2.21M
NOI $132,581 @ 7.0% cap · market cap 2.37%
Theoretical Best
Office A
$3.00M
$2.62M – $3.50M
NOI $209,710 @ 7.0% cap · market cap 3.74%
Zoning and permitted uses should be independently verified with authorities.
Property Analytics
Unlock full access to Insights
Subscribe to Realmo Intelligence
Open Analytics
Current Use
Lease Details
100%
Occupancy
Single-tenant
Tenancy
Location Intelligence
Trade Area within ½ mile
2,026
Businesses Nearby
Under-served
Demand for This Use
Explore this area
Business Placement
Demographics for 32806, FL
26,582
Population
12,529
Households
2.1
Avg Household Size
40
Median Age
55%
College-Educated
95%
High-School Grad
6.8 sq mi
ZIP Area
3,909
Density / Sq Mi
$86,653
Median Household Income
$54,012
Median Earnings
$1,500
Median Rent
$415,800
Median Home Value
Check the figures for this property
Cap Rate, Value Estimation, Potential NOI and more
View Realmo Analytics
Market
Vacancy Rate% for Office in Orlando, FL

Questions? Ask Rey
Realmo’s AI knows this listing — price, zoning, demand, history. Ask anything.


Similar Off Market Nearby
- SODO Veterinary Hospital — 1751 S Orange Ave, Orlando, FL 32806
Frequently Asked Questions
What type of property is this?
Medical Office Space - Purpose-built medical office located near Orlando Health’s flagship campus and currently 100% leased to a single AA-rated tenant.
Where is this medical office space located?
The property is located at 80 W Michigan St Orlando, FL.
What is the asking price?
The asking price for this property is $5,600,000.
What are key features of this property?
This property features: Purpose‑built single‑tenant medical office (MOB) built in 2010; 100% leased with a single AA‑rated medical tenant; Located near Orlando Health’s flagship campus