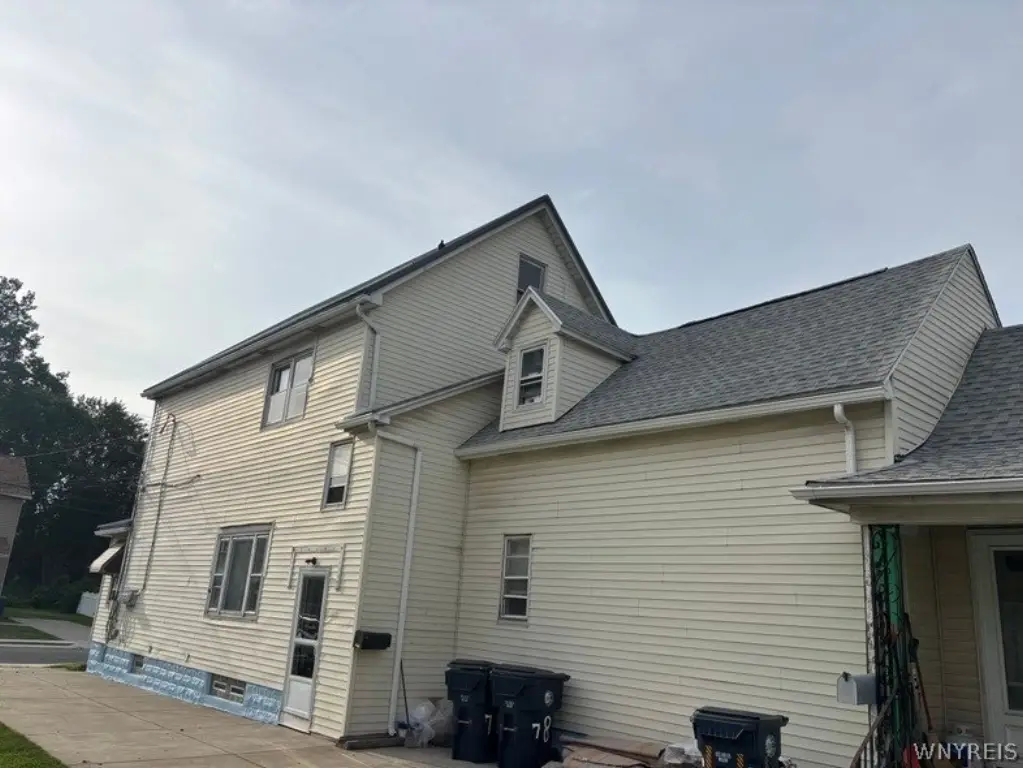
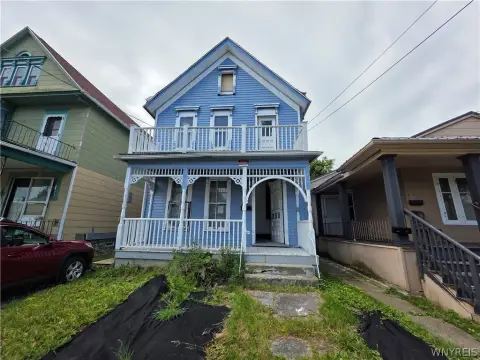
Updated Triplex with Double



For Sale
$229,900
Pending
78 Center Street, Buffalo, NY 14218
Residential, Buffalo, NY
Property Size2,444 SF
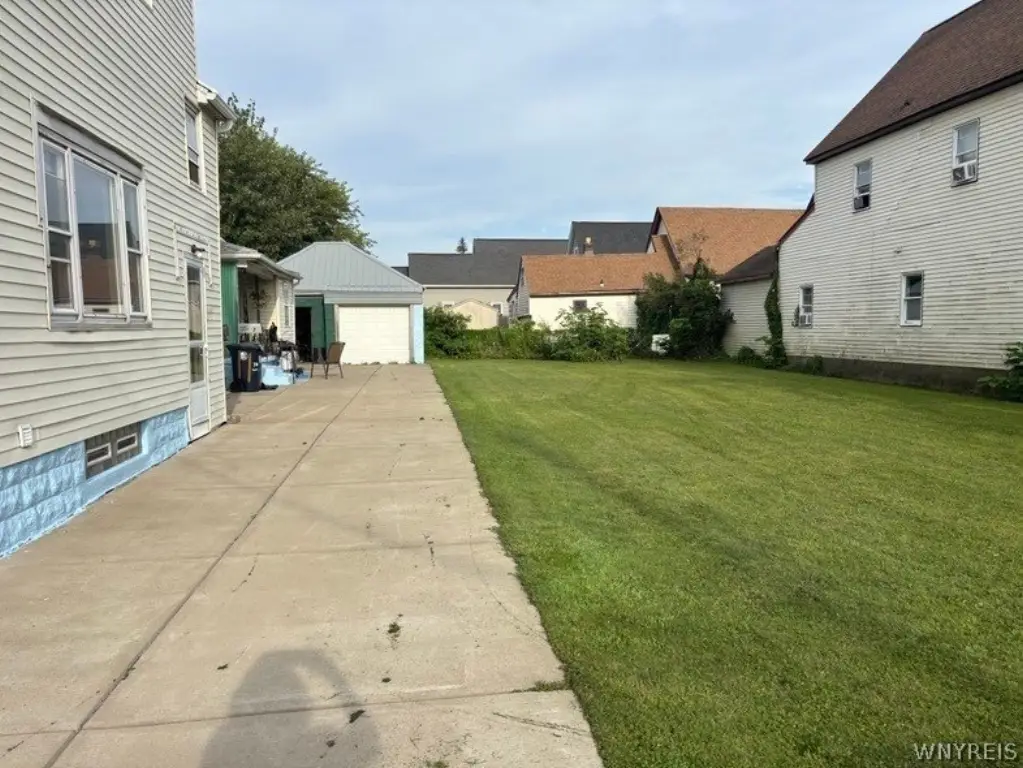
Lot Size0.20 Acres
Days on Market48
Property Features for 78 Center Street
General Information
Property type
Residential Multi Family
Property subtype
Other
Zoning description
Residential Multi Use
Bedrooms
5
Bathrooms
3
Full bathrooms
3
Rooms
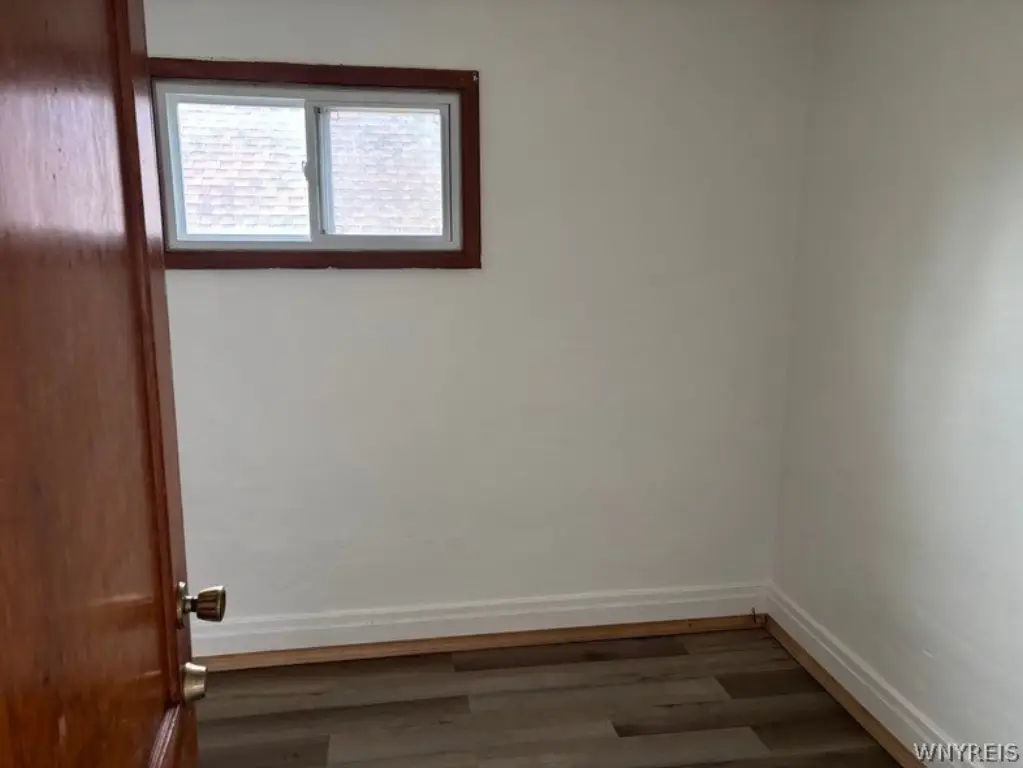
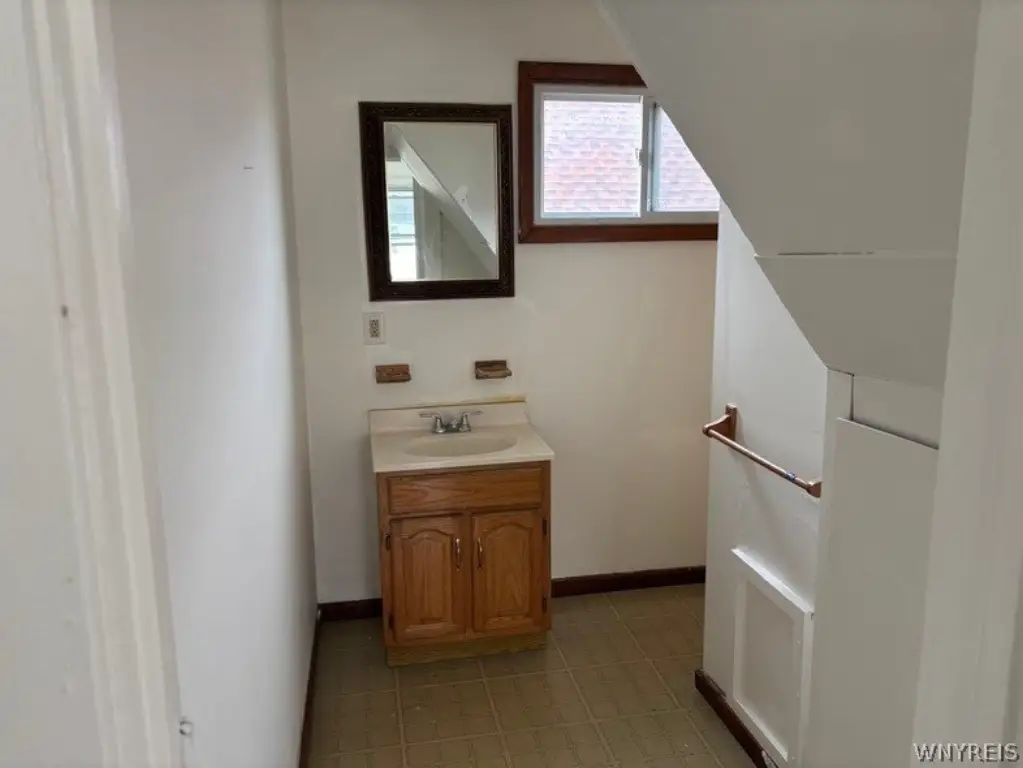
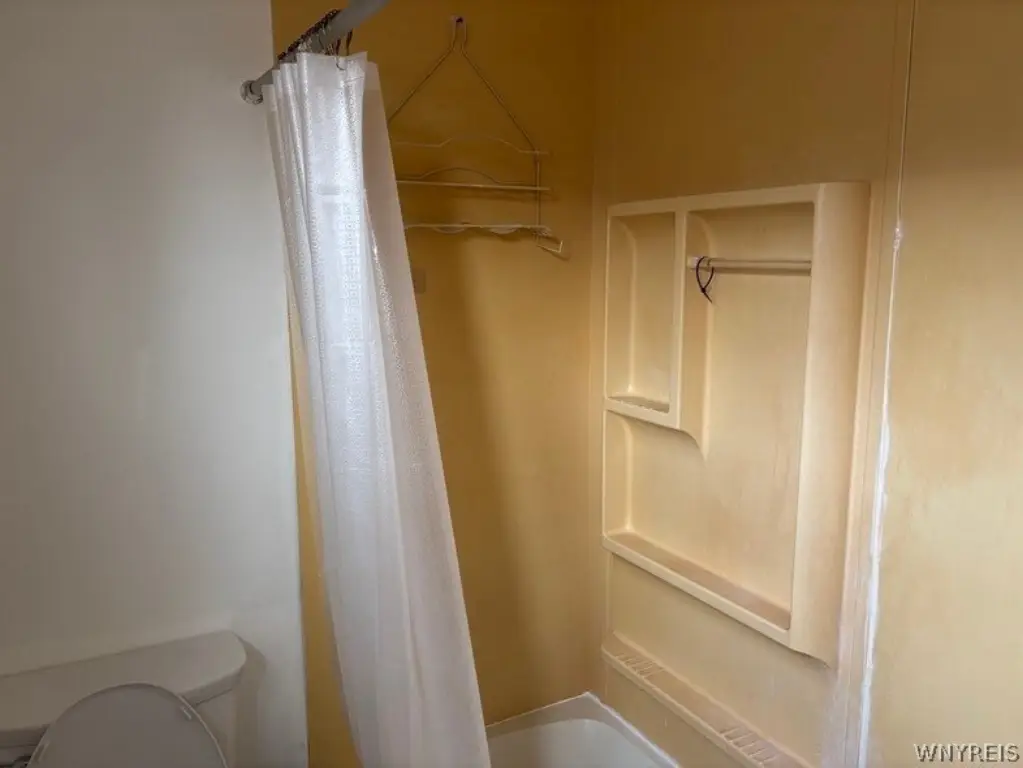
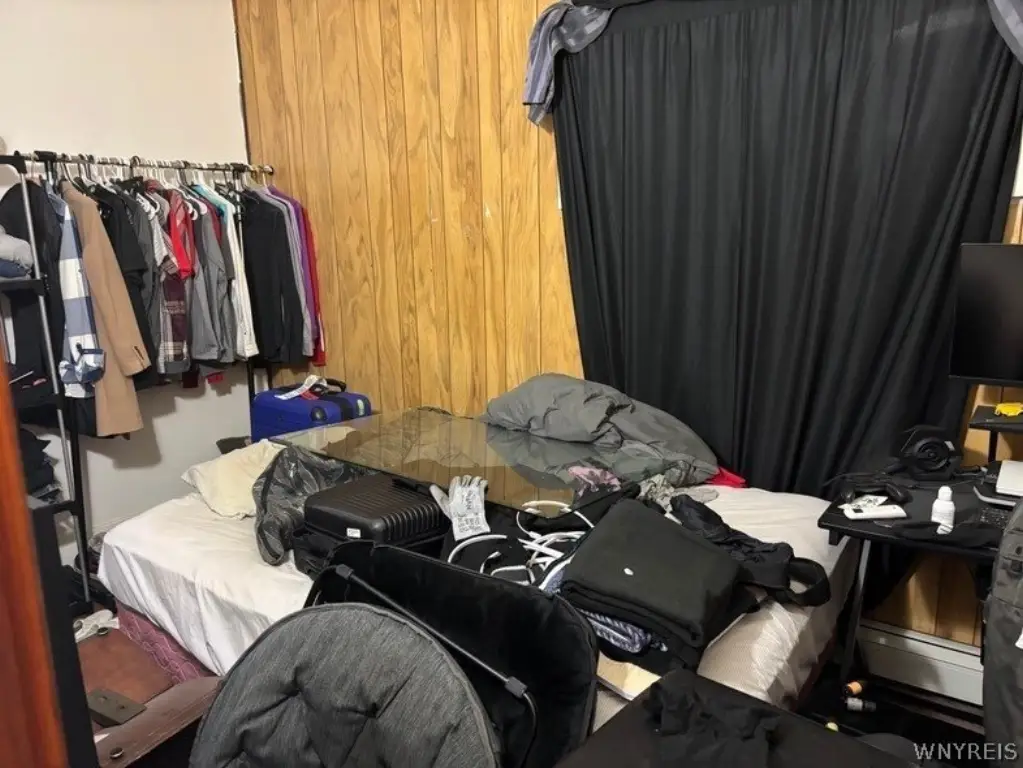
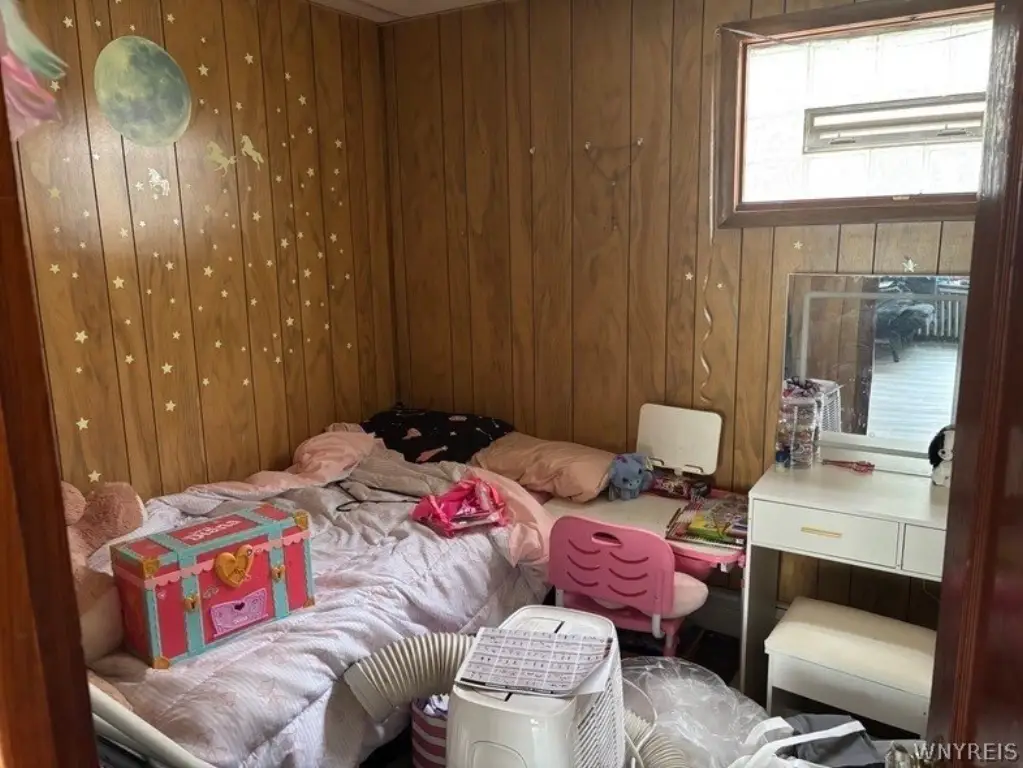
Bedroom 3, Bedroom 5, Bedroom 4, Bathroom 3, Bedroom 2, Bathroom 2, Bedroom 1, Basement, Bathroom 1
Parking features
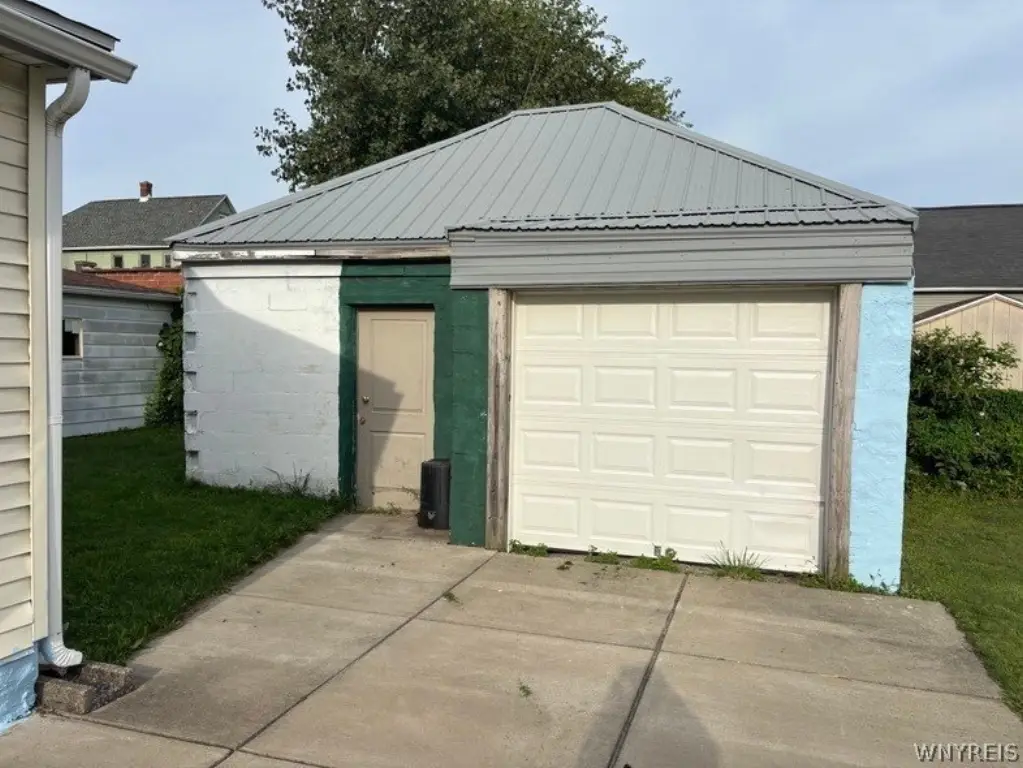
Garage
Patio and Porch features
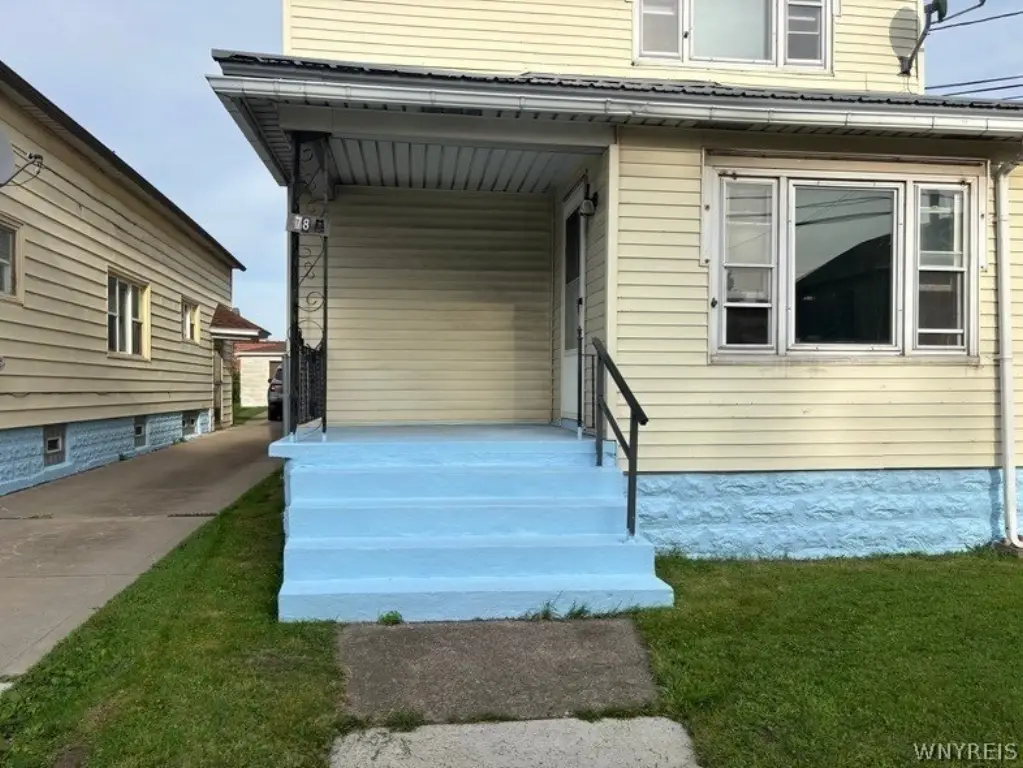
Porch
Appliances
GasWaterHeater
Subdivision
Buffalo Crk Reservation
Lot features
Near Public Transit, Rectangular, Rectangular Lot, Residential Lot
Elementary school
Martin Road Elementary
Middle school
Lackawanna Middle
High school
Lackawanna High
Elementary school district
Lackawanna
Middle school district
Lackawanna
High school district
Lackawanna
Directions
Ridge Rd to Center St
Standard status
Pending
APN
140900-142-450-0002-039-100
Size
2,444 SF
Lot size
0.20 Acres
Taxes and HOA fees
Tax Annual Amount
5733
Utilities
Heating system
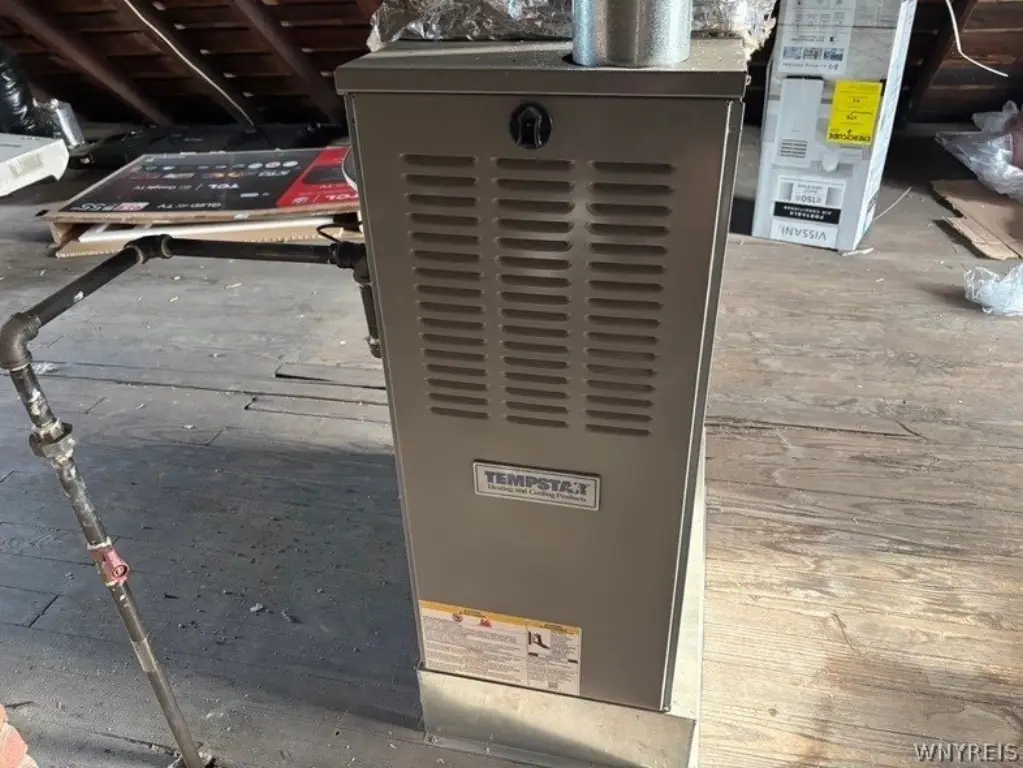
Baseboard, Forced Air, Natural Gas
Water source
Public
Amenities
porches
basement
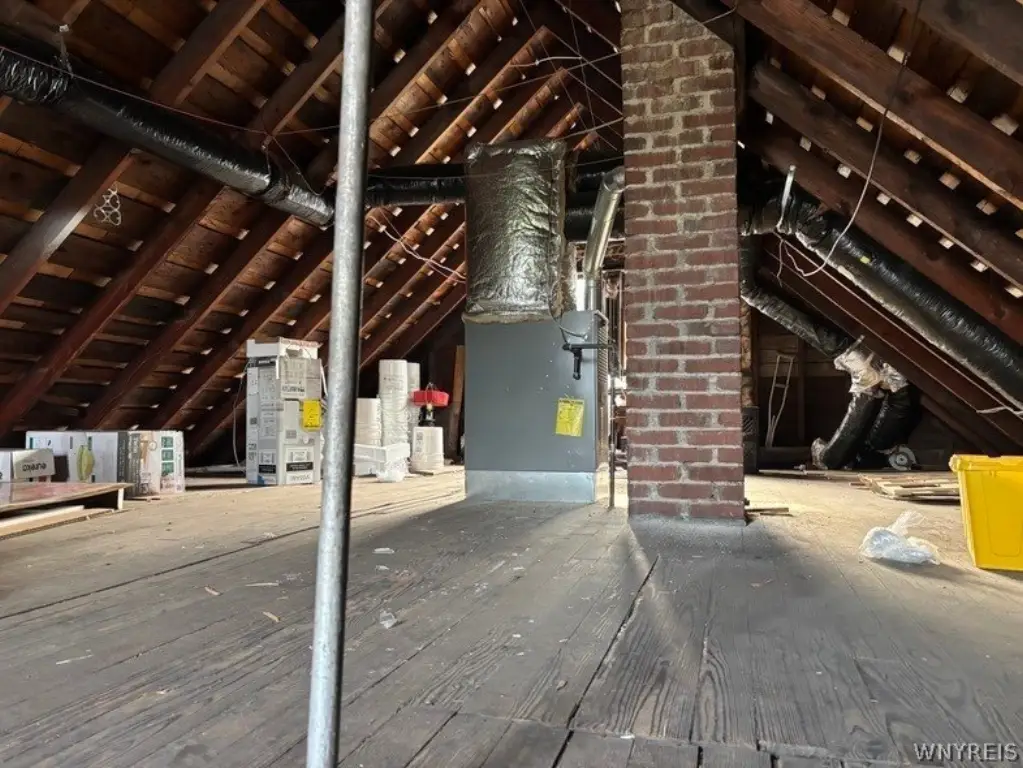
attic storage
Building Details
Year built
1920
Floors in Building
2
Number of units
3
Flooring type
Laminate, Varies, Carpet, Tile
Building materials
AluminumSiding, VinylSiding, CopperPlumbing
Roof type
Metal, Asphalt
Architectural style
Other
Listing Agency:
WNY Metro Roberts Realty
(716) 891-1710
Listed By:
Jennifer E Hubert · License #40HU0952337
(716) 866-3536
Added: Aug 31
Changed: Oct 16
Last Checked: Oct 17 at 7:06PM
MLS# B1710973
Copyright © 2026 New York State Alliance of MLSs, LLC. All rights reserved. All information provided by the listing agent/broker is deemed reliable but is not guaranteed and should be independently verified.

Ask AI about this property
Review the available facts, identify missing information and prepare questions for the agent.
Investment Insights
Based on property information with market context.
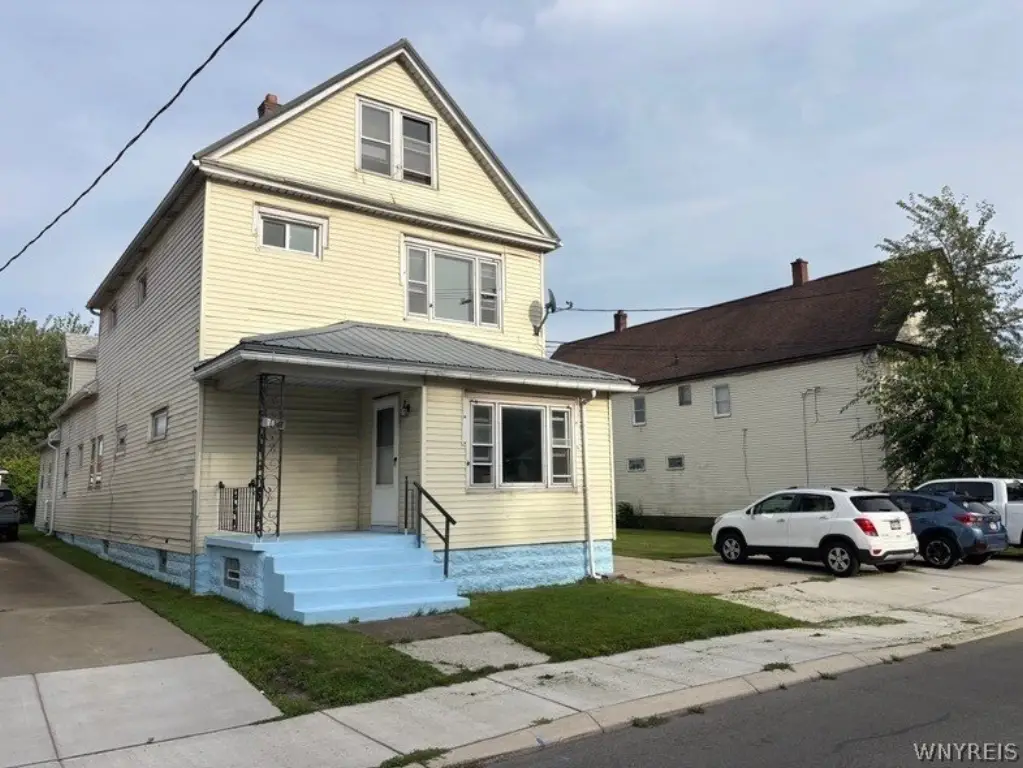
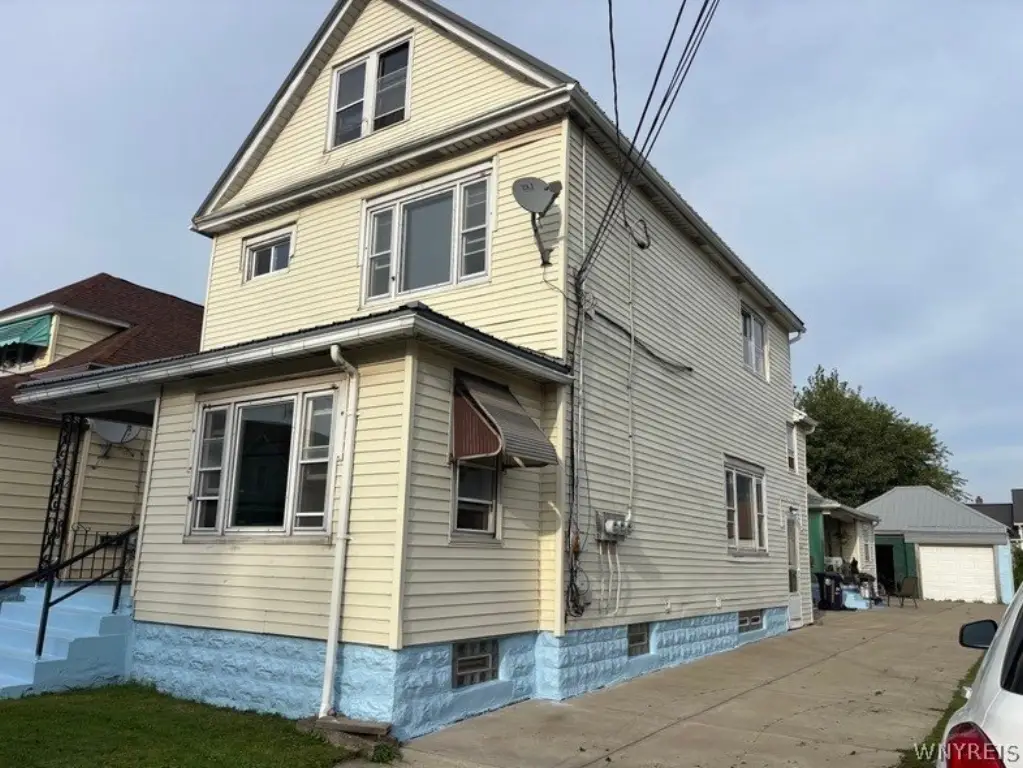
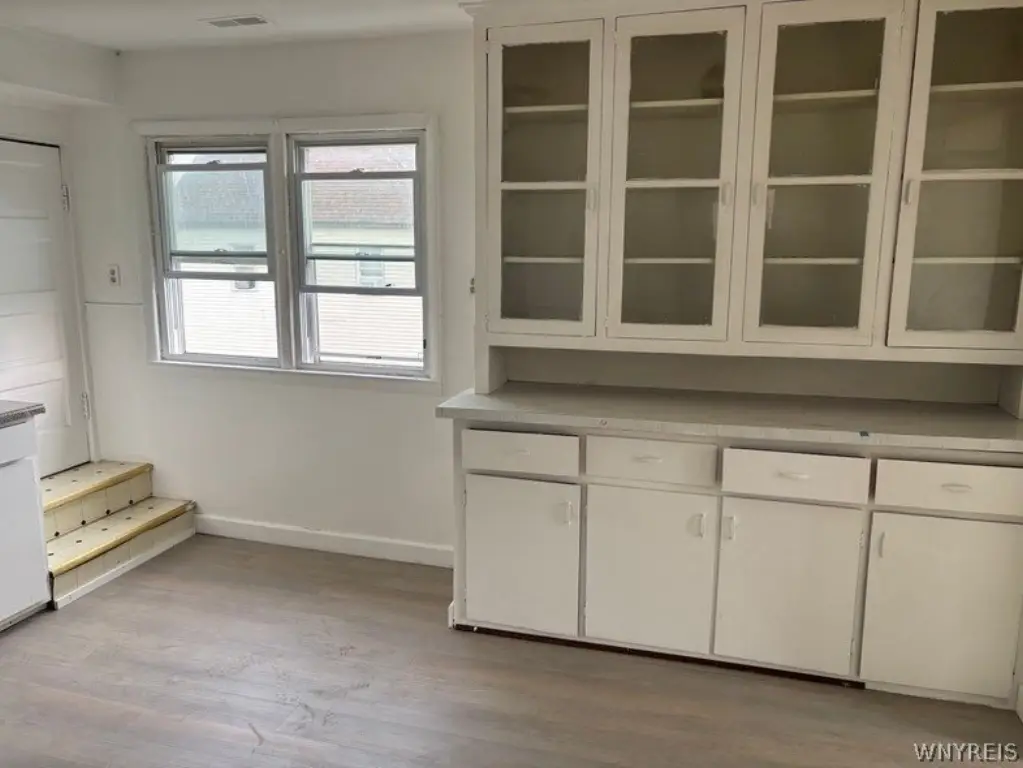
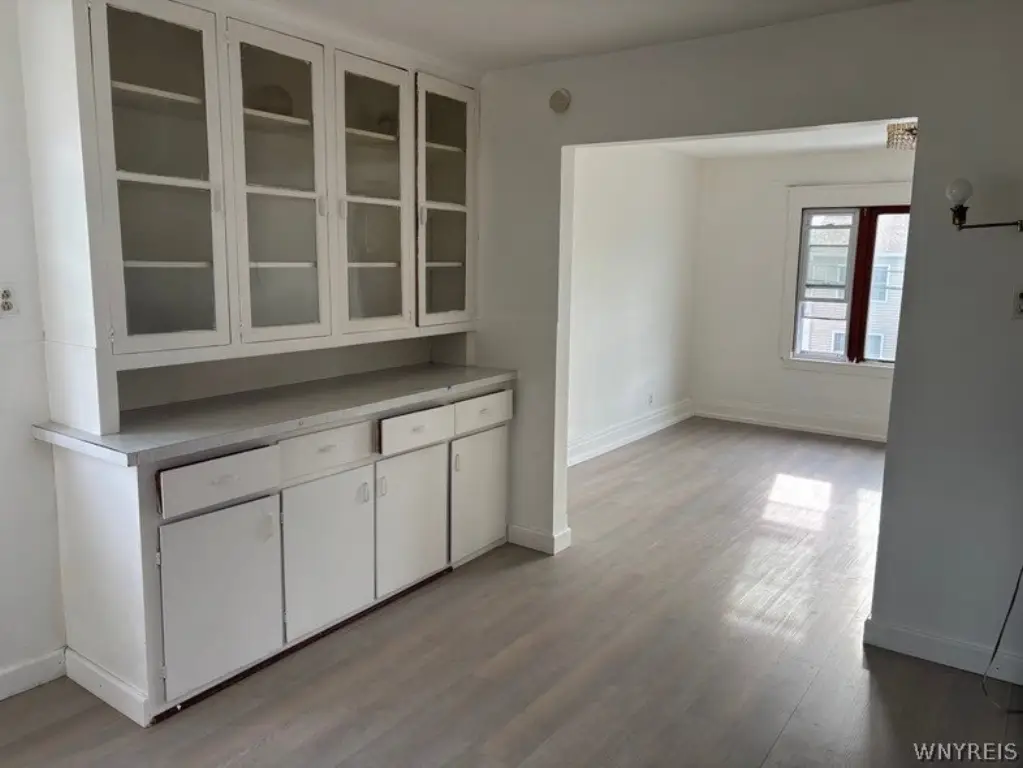
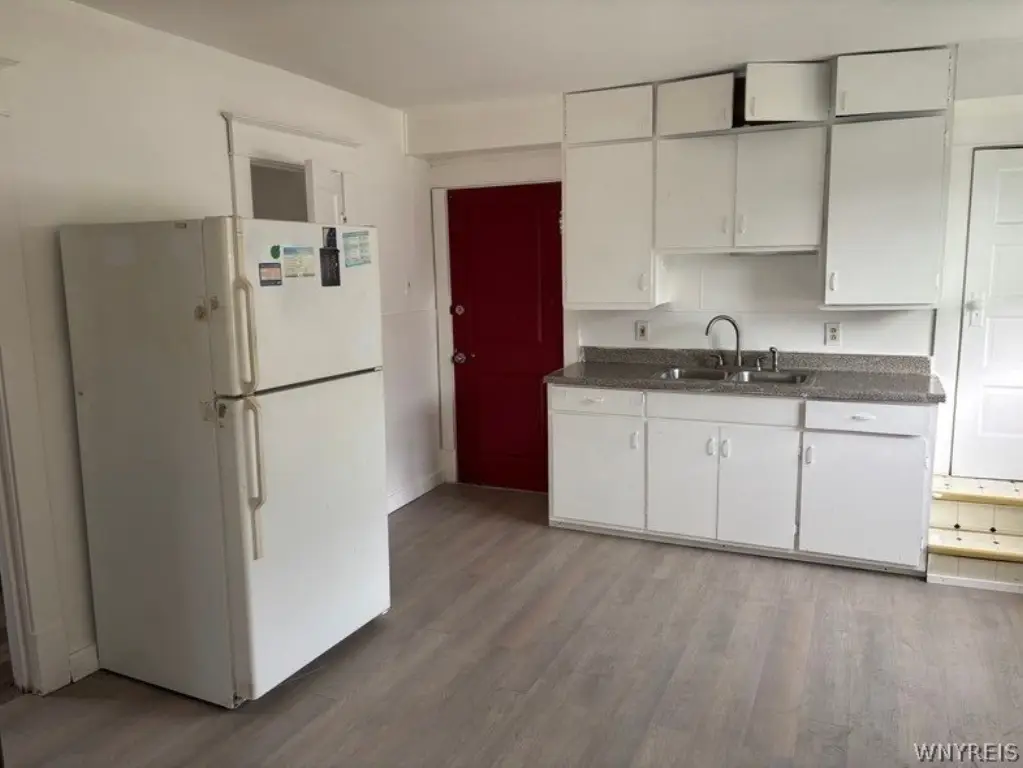
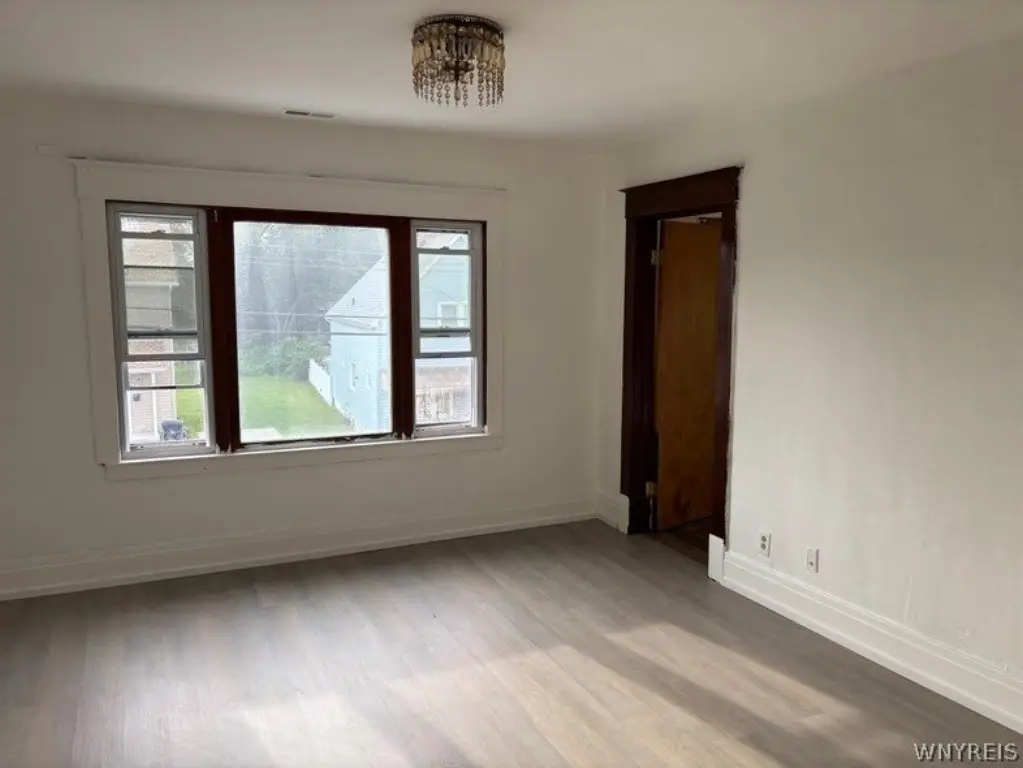
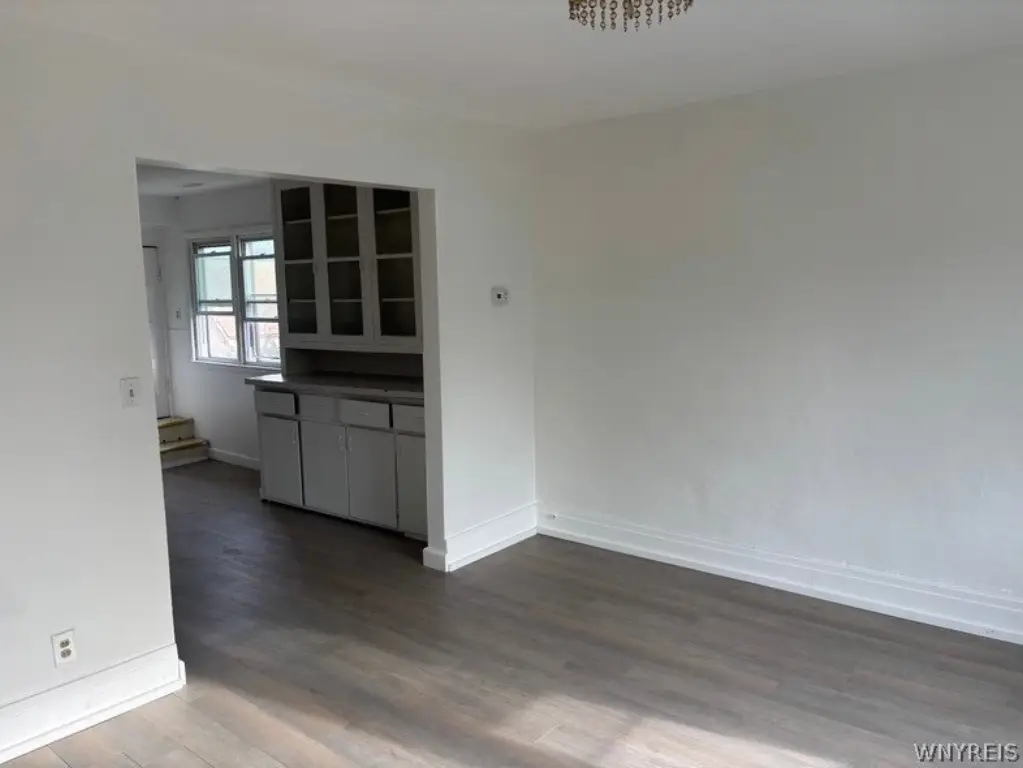
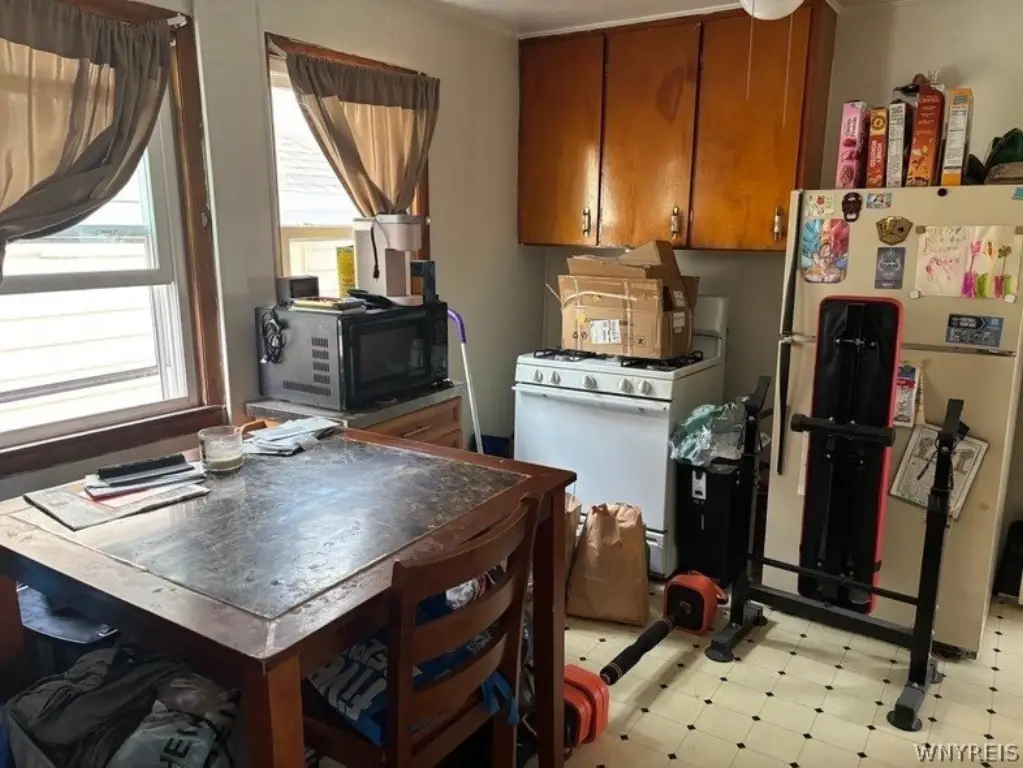
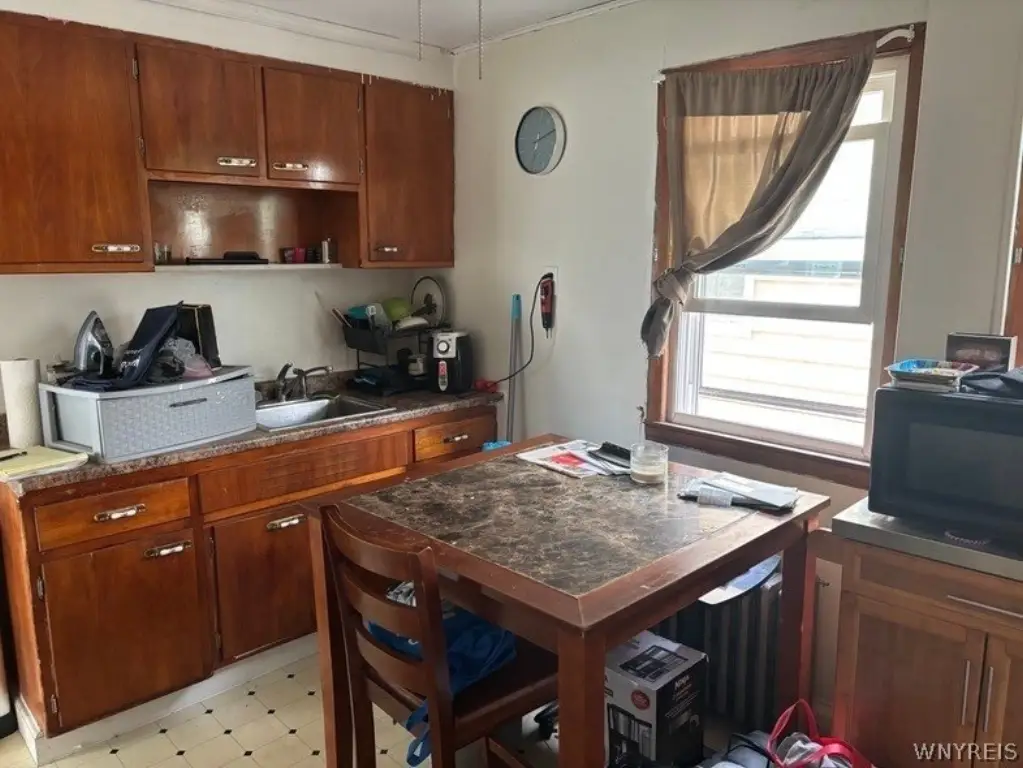
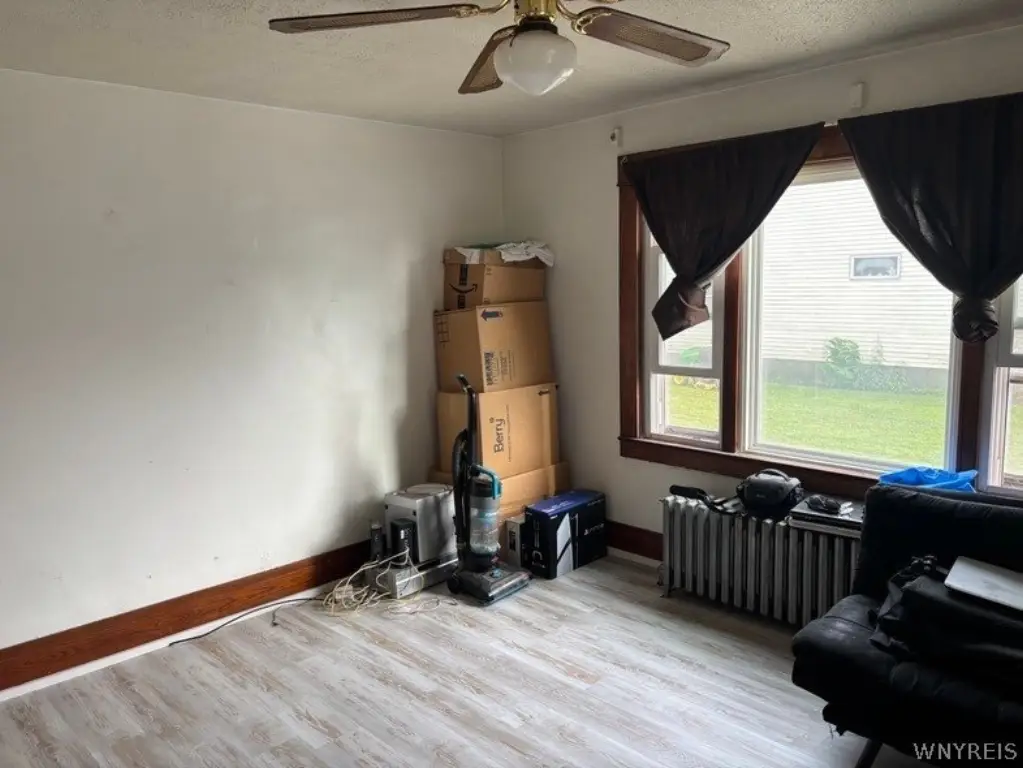
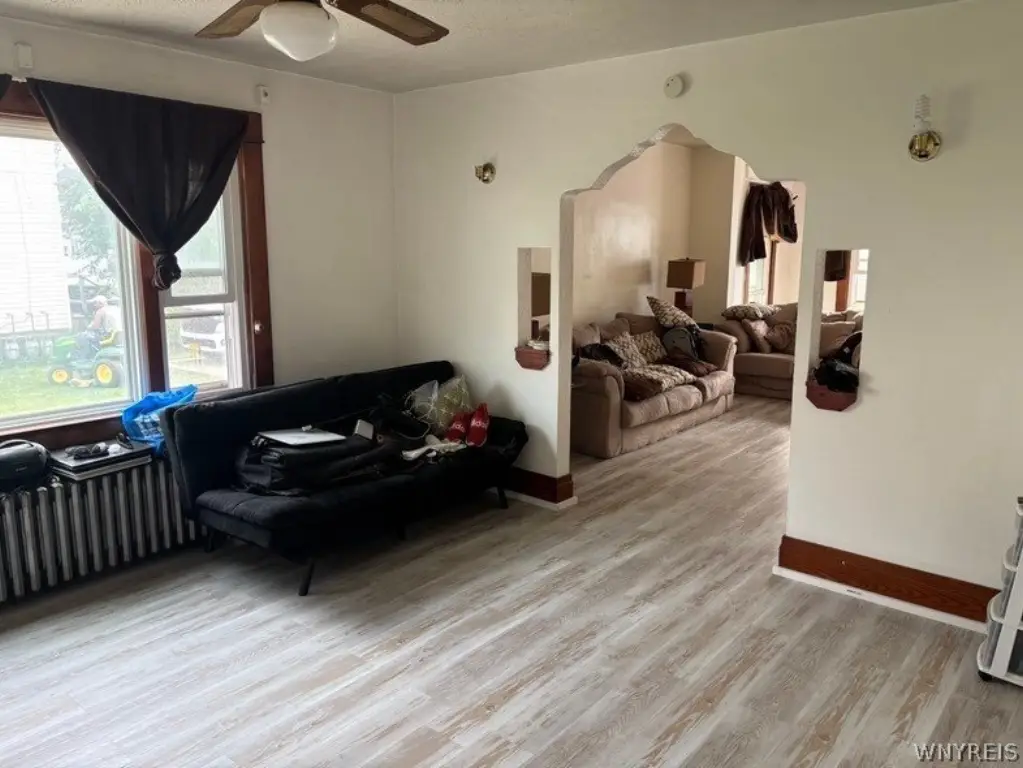
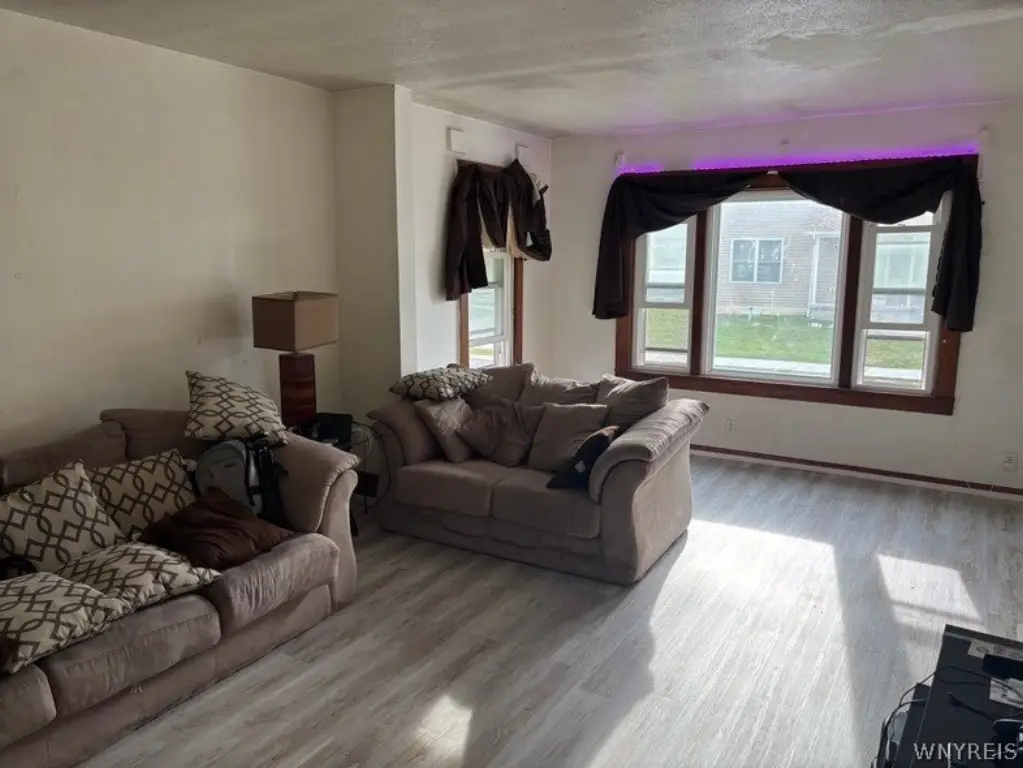
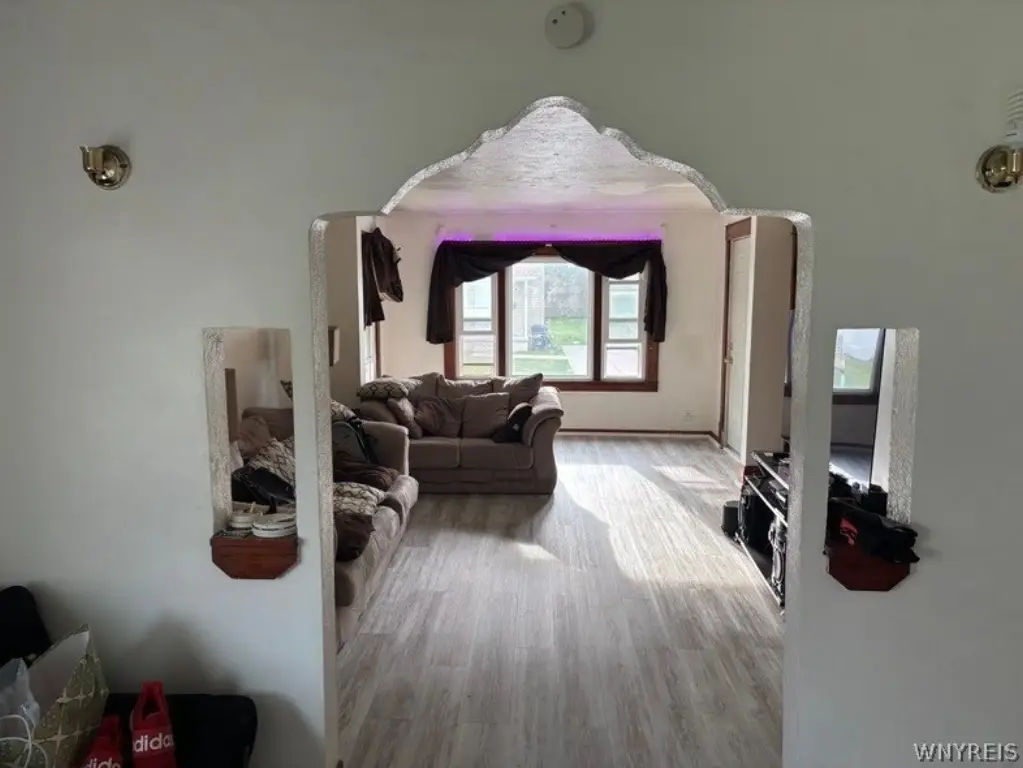
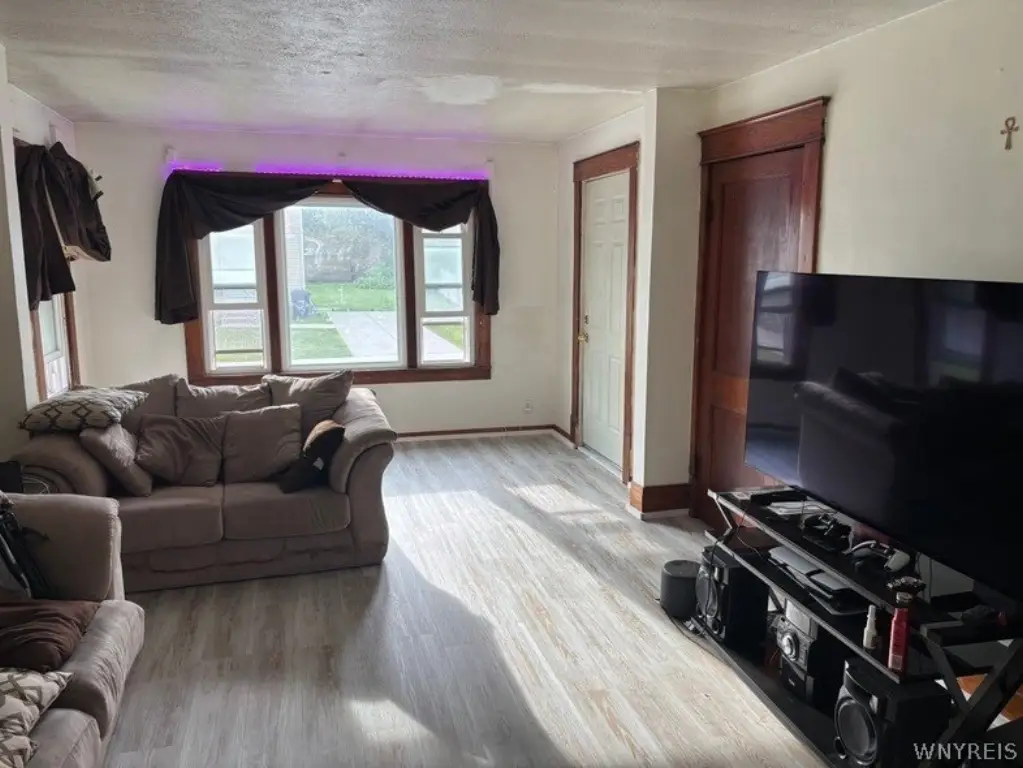
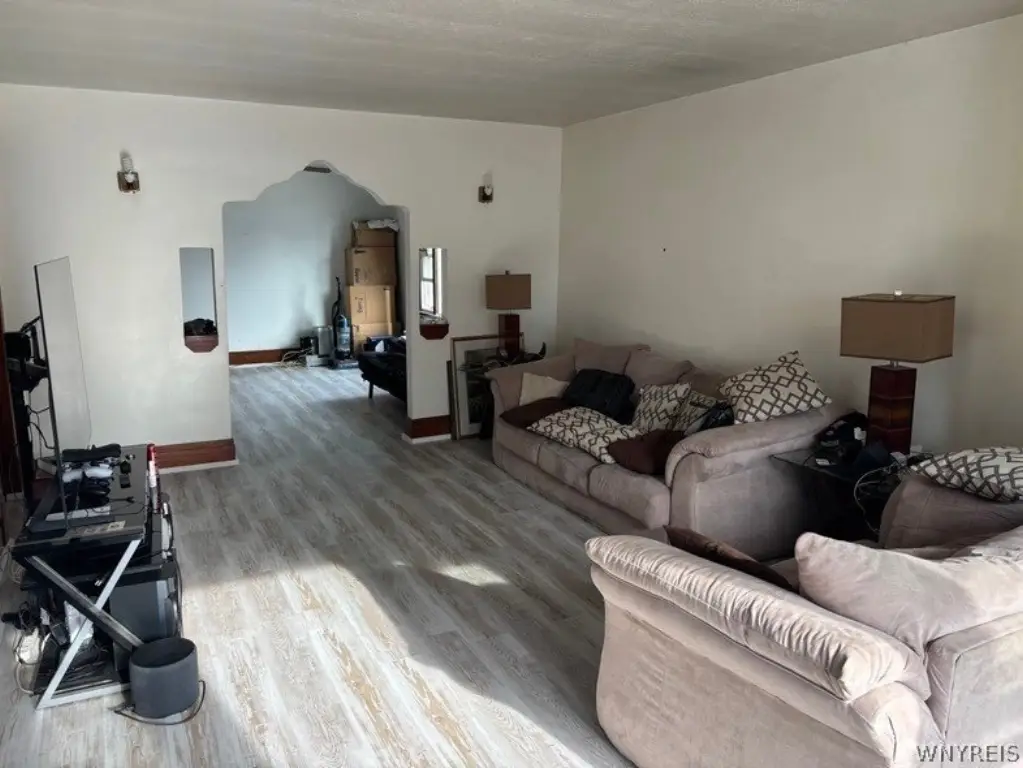
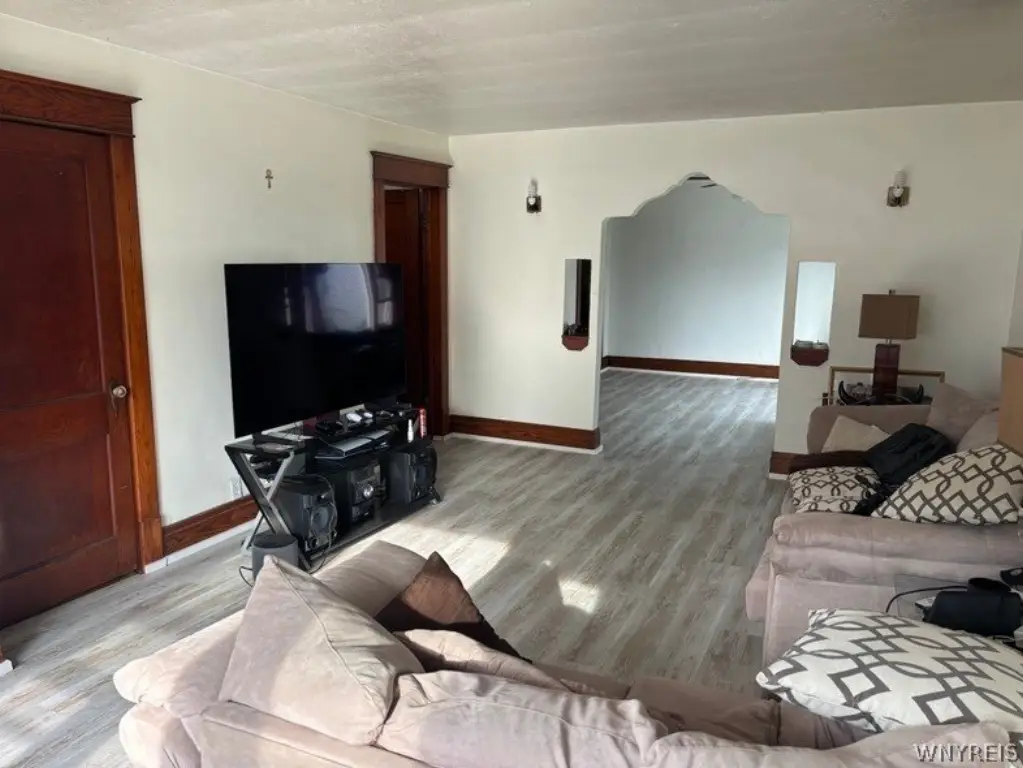
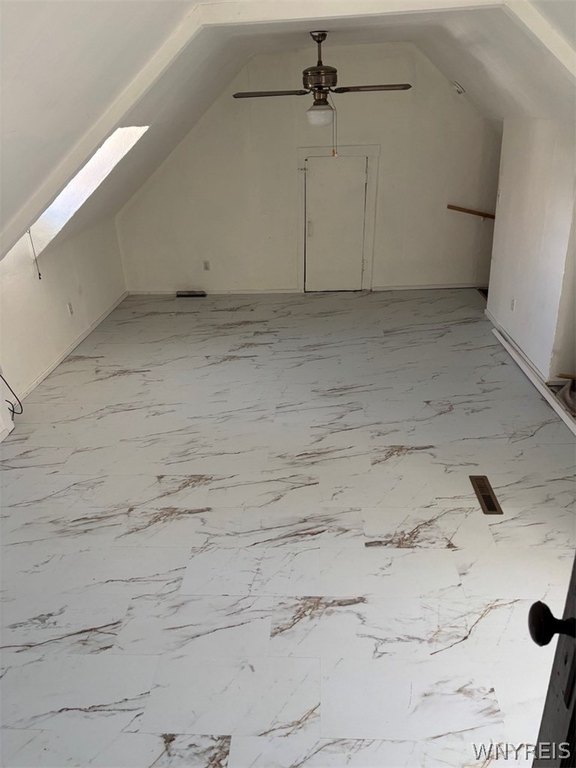
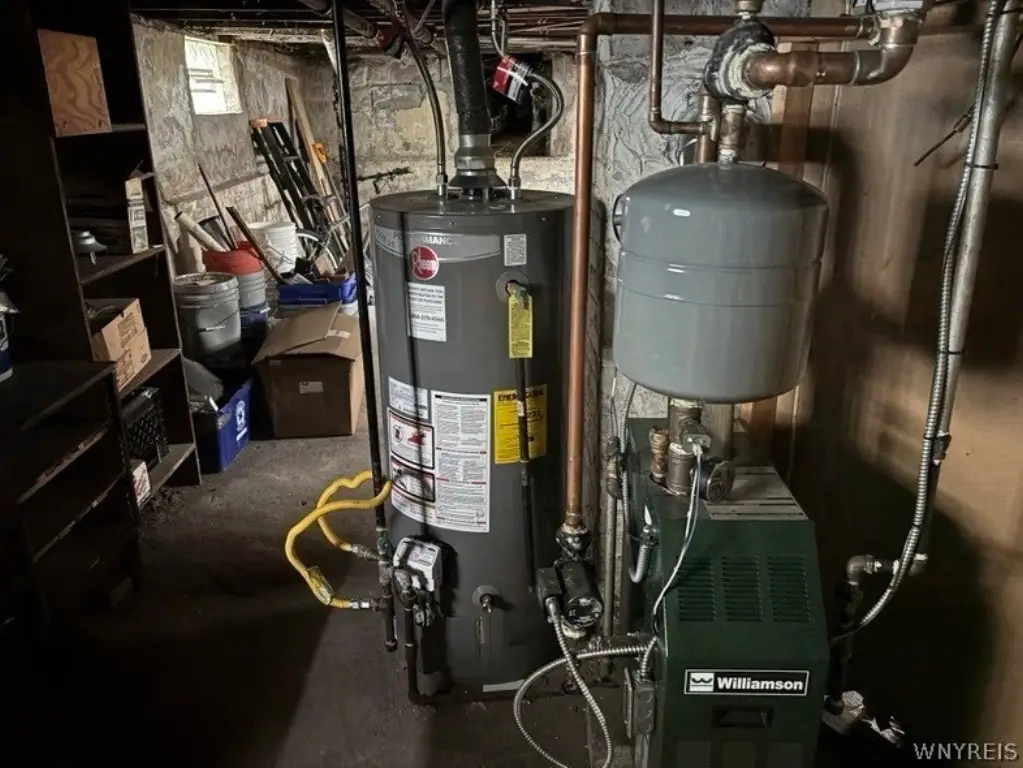
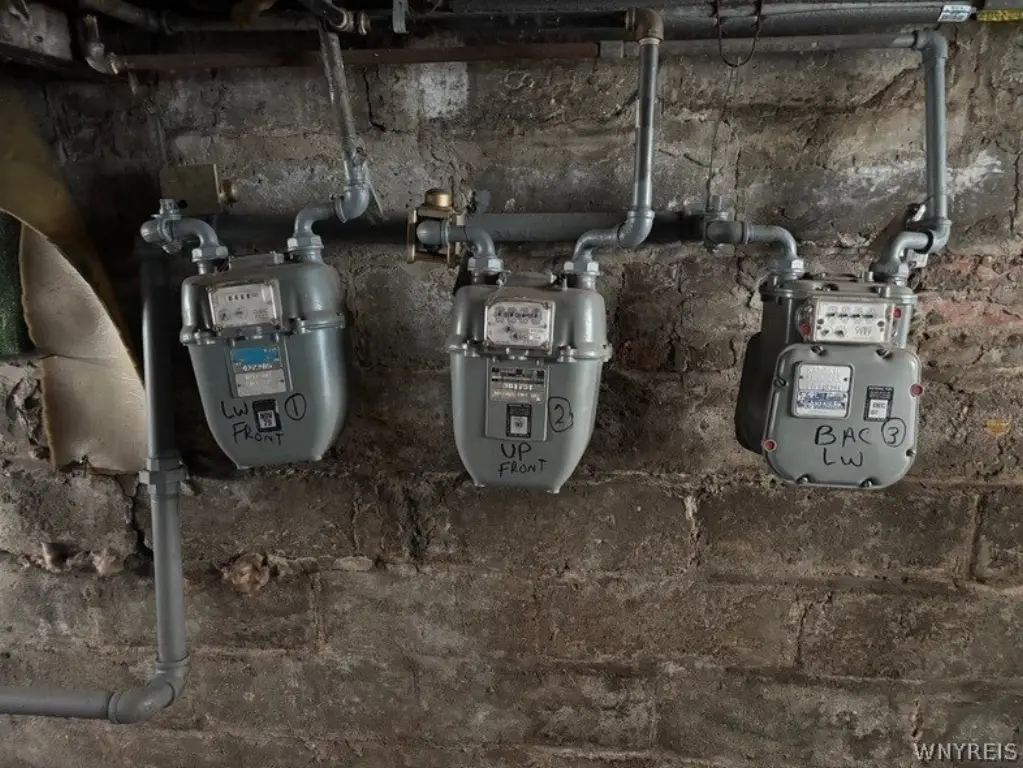
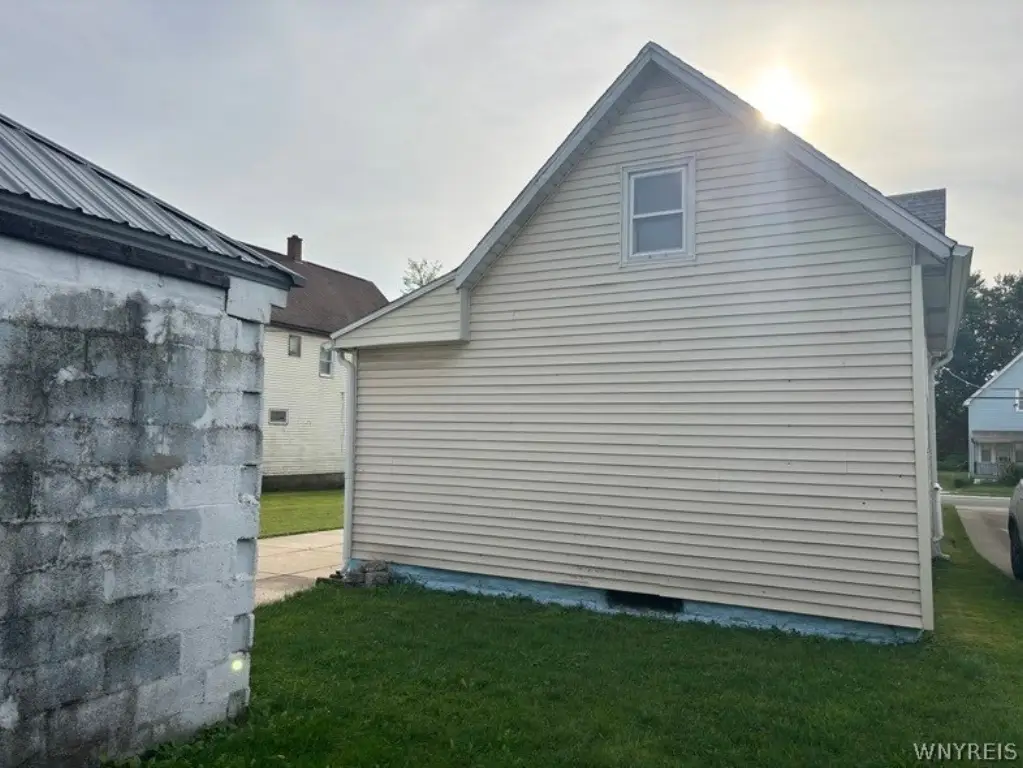
This 2,444-square-foot triplex, built in 1920, occupies a 0.2009-acre double lot and includes three distinct living units. The upper unit is vacant and has a large eat-in kitchen, attic access, some newer windows, and a furnace approximately 3 years old. The lower unit has a formal dining room, large living room, eat-in kitchen, new flooring, and a boiler approximately 3 years old; it is occupied by a month-to-month tenant. A vacant rear two-story unit provides an oversized bedroom, kitchen, dining room, and new flooring, with a furnace approximately 6 years old.
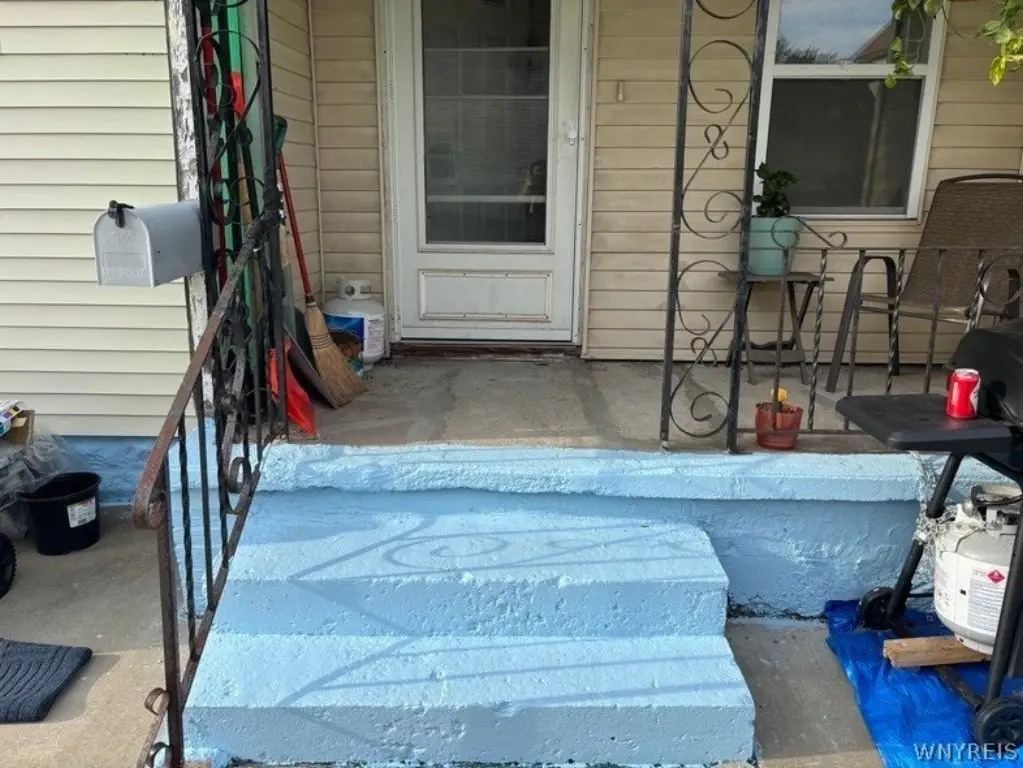
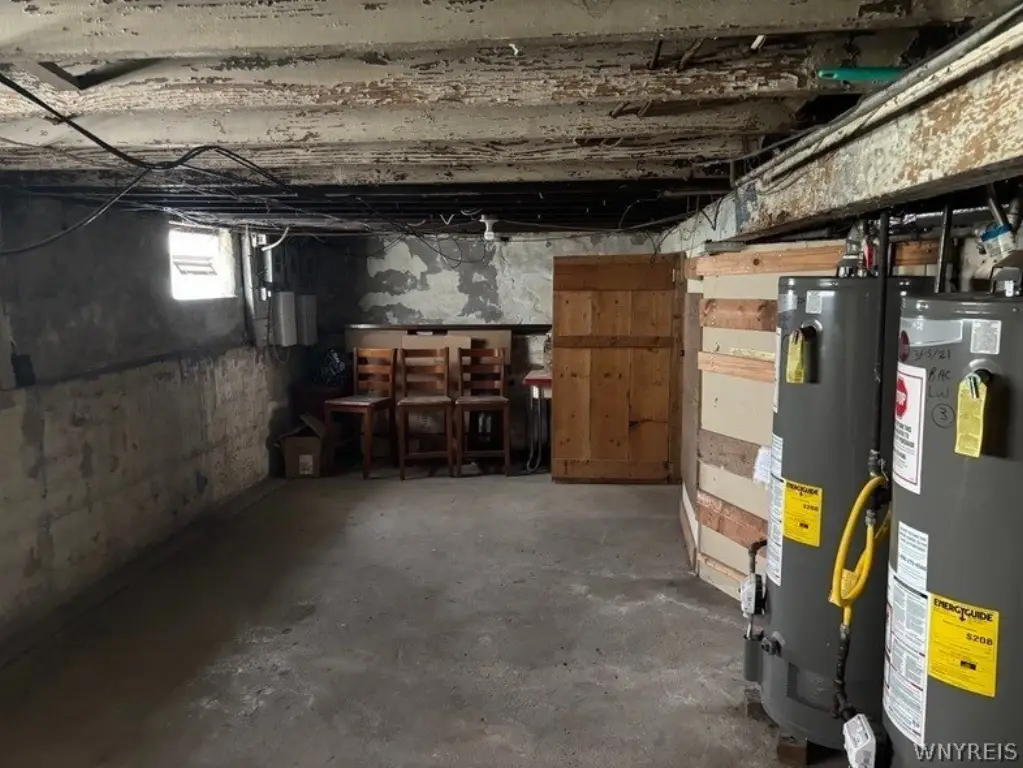
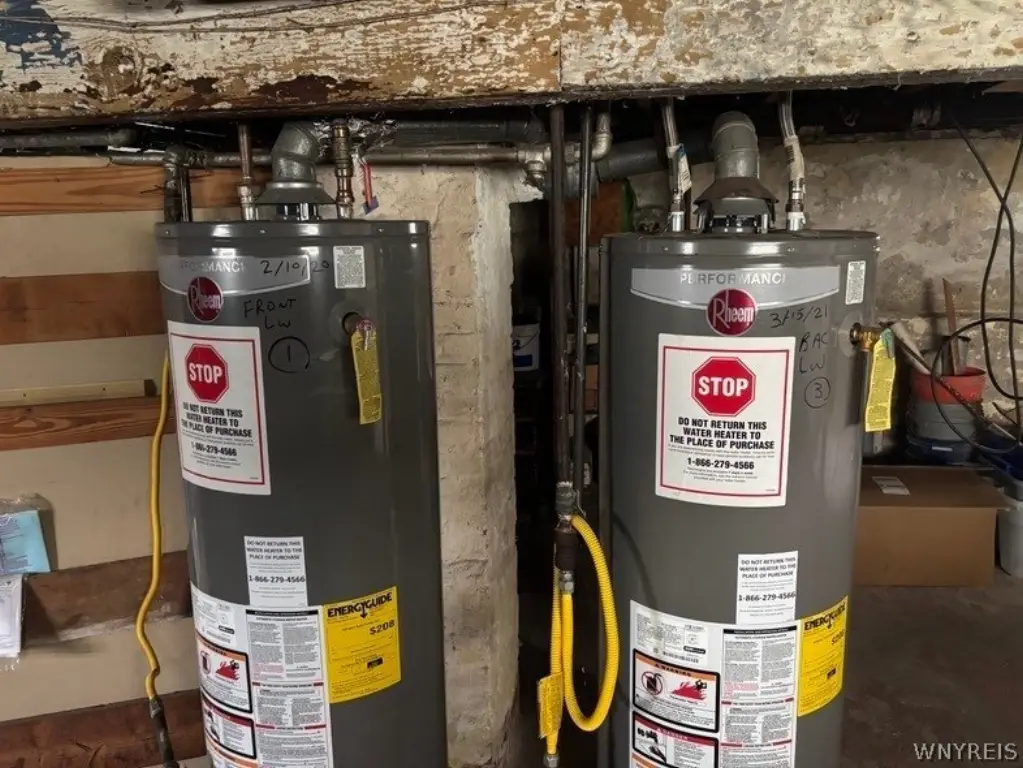
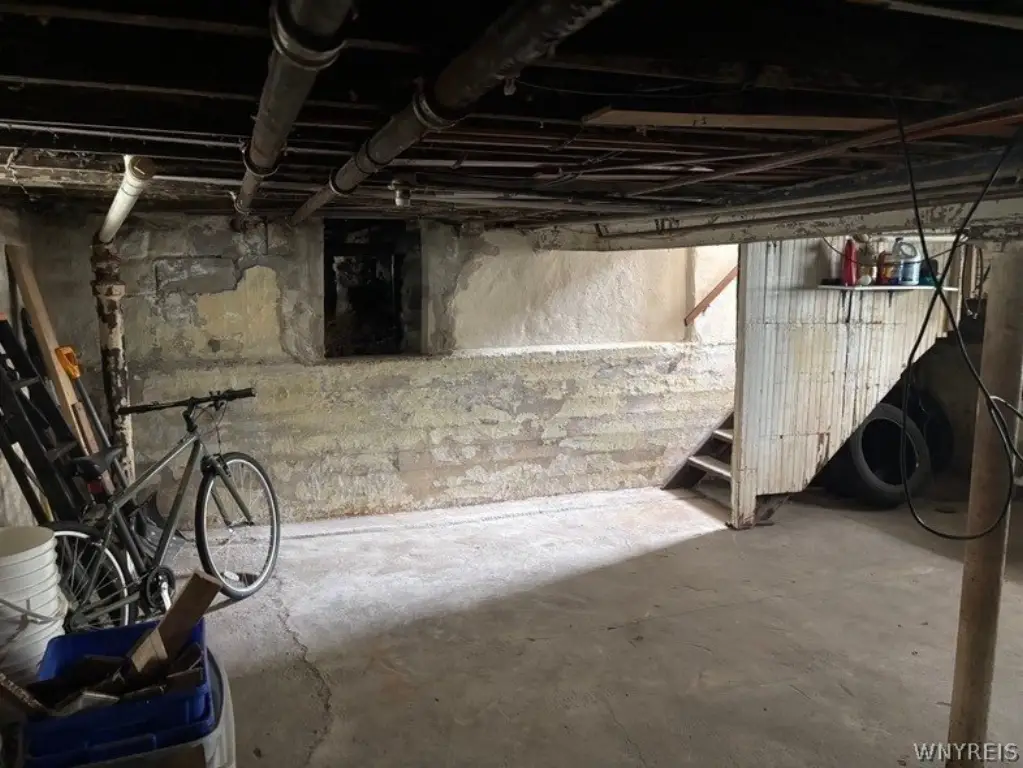
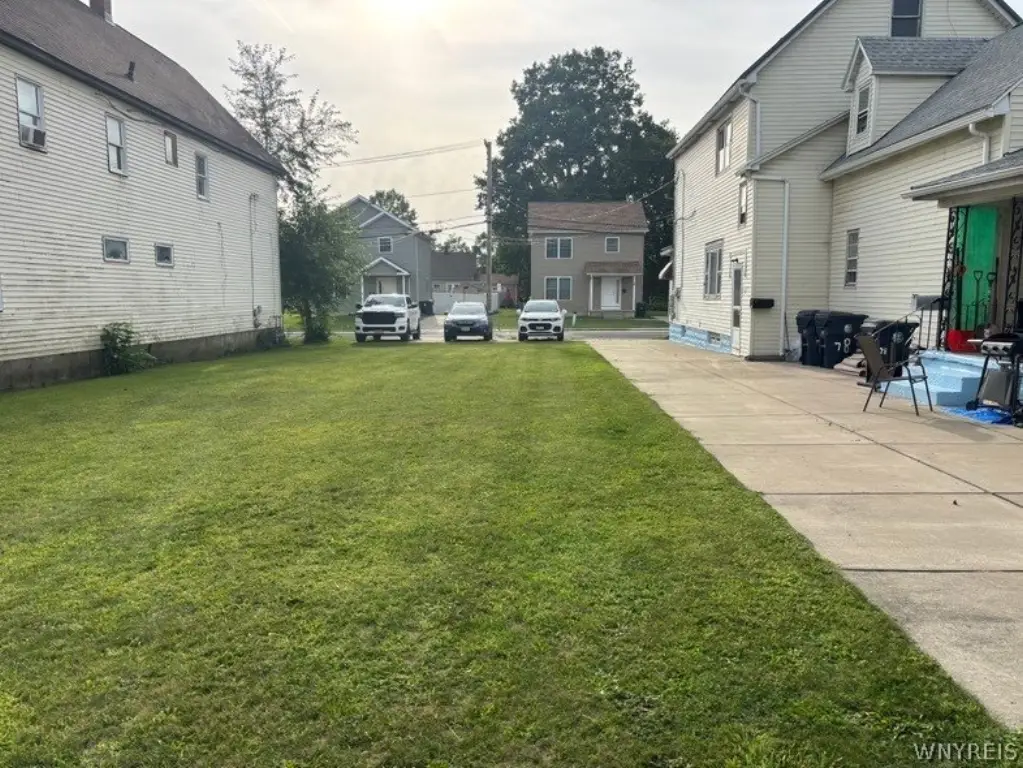
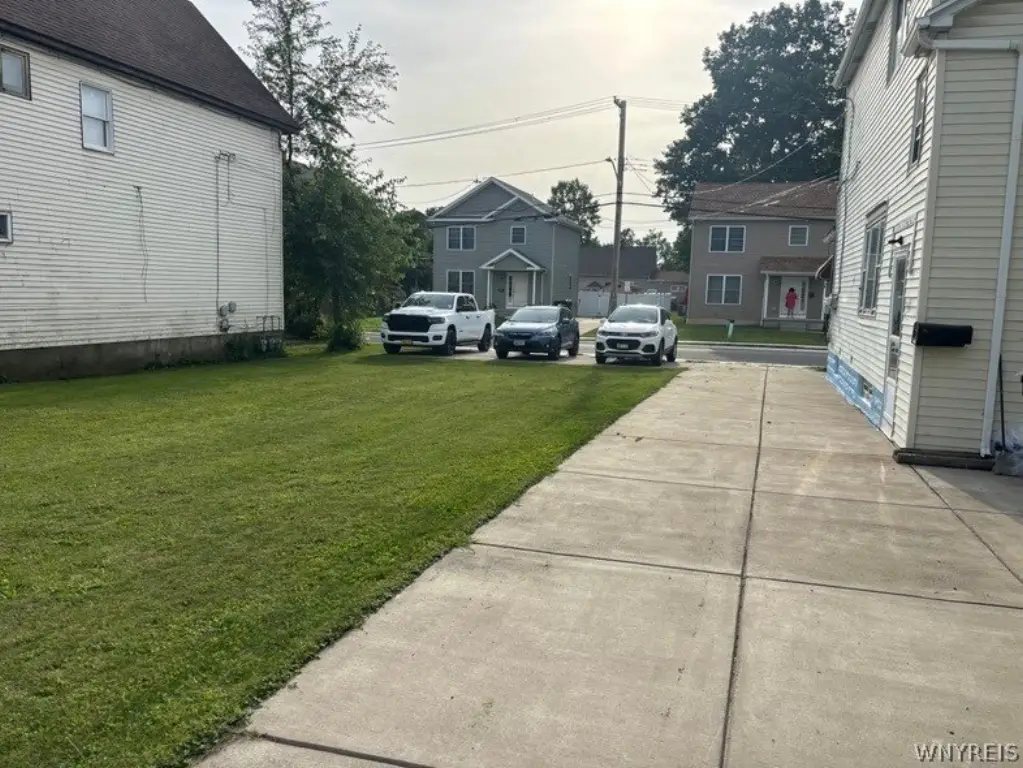
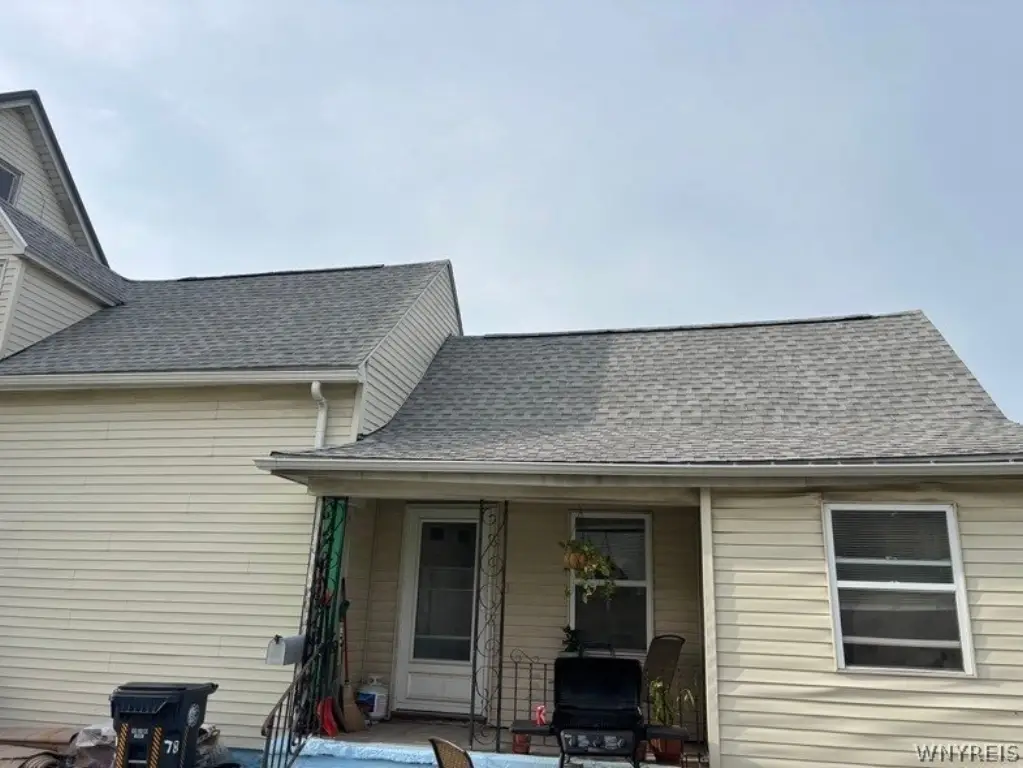
Recent property improvements include newer roofs on the house and garage in 2025/2026, hot water tanks installed in 2020, 2021 and 2025, a concrete driveway, and three additional off-street parking spaces. The property also features a clean, dry basement with glass block windows, vinyl siding, front and side porches, a garage, and public water service.
Recent property improvements include newer roofs on the house and garage in 2025/2026, hot water tanks installed in 2020, 2021 and 2025, a concrete driveway, and three additional off-street parking spaces. The property also features a clean, dry basement with glass block windows, vinyl siding, front and side porches, a garage, and public water service.
Key Highlights
- 2,444‑square‑foot triplex on a 0.2009‑acre double lot
- Three‑unit 2/2/1 layout with upper and rear units vacant
- House and garage roofs replaced in 2025/2026
Property Analytics
Unlock full access to Insights
Subscribe to Realmo Intelligence
Open Analytics
Current Use
Lease Details
3
Residential units
Location Intelligence
Trade Area within ½ mile
479
Businesses Nearby
Explore this area
Business Placement
Demographics for 14218, NY
20,878
Population
9,478
Households
2.2
Avg Household Size
38
Median Age
21%
College-Educated
88%
High-School Grad
8.1 sq mi
ZIP Area
2,578
Density / Sq Mi
$50,484
Median Household Income
$36,457
Median Earnings
$829
Median Rent
$135,000
Median Home Value
Check the figures for this property
Cap Rate, Value Estimation, Potential NOI and more
View Realmo Analytics
Market
Vacancy Rate% for Multifamily in Northeast region






Frequently Asked Questions
What type of property is this?
Triplex - Three-unit property with recent improvements and multiple off-street parking spaces.
Where is this triplex located?
The property is located at 78 Center Street Buffalo, NY.
What is the asking price?
The asking price for this property is $229,900.
What are key features of this property?
This property features: 2,444‑square‑foot triplex on a 0.2009‑acre double lot; Three‑unit 2/2/1 layout with upper and rear units vacant; House and garage roofs replaced in 2025/2026


