Fourplex with Five
For Sale
$2,550,000
7782 Newman Avenue, Huntington Beach, CA 92647
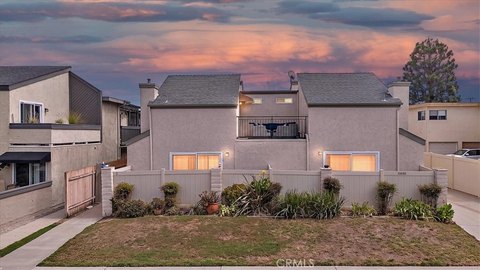
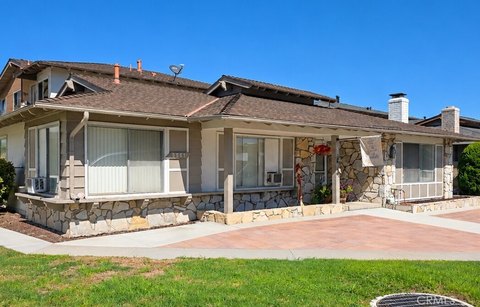
Well-maintained fourplex offering one 3-bedroom unit and three 2-bedroom units plus five garages and additional back parking.
Property Size4,796 SF
Days on Market137
Property Features for 7782 Newman Avenue
General Information
Standard status
Active
Size
4,796 SF
Total Parking Spaces
11
Property subtype
Quadruplex
Site & Location
Neighborhood
Beach Boulevard
Additional Details
Multifamily Units
4
Building Details
Building Size
4,796 SF
Year Built
1978
Tenancy
Multi
Listing Agency:
CAL BEST REALTY
Listed By:
JOHNNY CHANG · License #00853937
(626) 284-8008
Source:
Velocityrealtysd
Added: Jun 9
Changed: Oct 23
Last Checked: Oct 23 at 1:50PM
Displayed information is deemed reliable but is not guaranteed and should be independently verified. All listing content including descriptions, pricing, images are the copyrighted material of CAL BEST REALTY

Ask AI about this property
Review the available facts, identify missing information and prepare questions for the agent.
Investment Insights
Based on property information with market context.
This well-maintained fourplex features one large front unit with 3 bedrooms and 2.5 bathrooms, along with three additional units with 2 bedrooms and 2 bathrooms. The property includes five garages and parking for additional vehicles in the back, supporting convenient off-street parking for residents.
Located on an excellent cul-de-sac street in Huntington Beach, the property is positioned for easy day-to-day convenience, with access described as close to the beach and shopping.
The current configuration provides a mix of unit sizes within a single fourplex layout, supported by the on-site garage and rear parking capacity.
Located on an excellent cul-de-sac street in Huntington Beach, the property is positioned for easy day-to-day convenience, with access described as close to the beach and shopping.
The current configuration provides a mix of unit sizes within a single fourplex layout, supported by the on-site garage and rear parking capacity.
Key Highlights
- Fourplex with one 3‑bedroom, 2.5‑bath front unit and three 2‑bedroom, 2‑bath units
- Five garages plus parking for 6 more cars in the back
- Well‑maintained 4‑plex on a cul‑de‑sac street
Financial Insights
Estimated NOI and Cap Rate
NOI / Yr
$112,084
Cap Rate
4.40%
Suggested Prices Based on Cap Rates
Cap Rate 5%
$2,241,680
$2.2M
Cap Rate 7%
$1,601,200
$1.6M
Cap Rate 9%
$1,245,378
$1.2M
Market Conditions
NOI Build-Up for 4,796 SF
Gross rent
$164.0K $34.20/SF
− Vacancy
−$3.9K −$0.81/SF
EGI
$160.1K $33.39/SF
− OpEx
−$48.0K −$10.02/SF
NOI
$112.1K $23.37/SF
Area
Huntington Beach, CA
Vacancy
2.38%
Lease Rate
$34.20 /SF/Yr
Expense Ratio
30.00%
Simulate Cap Rate and NOI
Suggested Prices Based on Cap Rates
Cap Rate 5%
$2,241,680
Cap Rate 7%
$1,601,200
Cap Rate 9%
$1,245,378
Alternative Uses
Best Use
Multifamily LT 5
$1.60M
$1.40M – $1.87M
NOI $112,084 @ 7.0% cap · market cap 4.40%
Second Best
Apartment 5plus
$1.48M
$1.29M – $1.72M
NOI $103,389 @ 7.0% cap · market cap 4.05%
Theoretical Best
Specialty Retail
$1.66M
$1.45M – $1.93M
NOI $116,025 @ 7.0% cap · market cap 4.55%
Zoning and permitted uses should be independently verified with authorities.
How Realmo checks its estimates
Property Analytics
Contact the owner directly
Get the owner's phone numbers and email
Open Analytics
Lease Details
4
Residential units
Multi-tenant
Tenancy
Location Intelligence
Trade Area within ½ mile
2,495
Businesses Nearby
Explore this area
Business Placement
Demographics for 92647, CA
60,455
Population
22,340
Households
2.7
Avg Household Size
38
Median Age
39%
College-Educated
91%
High-School Grad
7.5 sq mi
ZIP Area
8,061
Density / Sq Mi
$107,877
Median Household Income
$47,882
Median Earnings
$2,400
Median Rent
$963,900
Median Home Value
Check the figures for this property
Cap Rate, Value Estimation, Potential NOI and more
View Realmo Analytics
Market
Vacancy Rate% for Multifamily in West region



Frequently Asked Questions
What type of property is this?
Quadplex - Well-maintained fourplex offering one 3-bedroom unit and three 2-bedroom units plus five garages and additional back parking.
Where is this quadplex located?
The property is located at 7782 Newman Avenue Huntington Beach, CA.
What is the asking price?
The asking price for this property is $2,550,000.
What are key features of this property?
This property features: Fourplex with one 3‑bedroom, 2.5‑bath front unit and three 2‑bedroom, 2‑bath units; Five garages plus parking for 6 more cars in the back; Well‑maintained 4‑plex on a cul‑de‑sac street


