Duplex Property with Canal
For Sale
$899,000
759 S Biscayne River Dr, Miami, FL 33169
Residential Income, Miami, FL
Property SizeContact for details
Lot Size0.59 Acres
Days on Market47
Property Features for 759 S Biscayne River Dr
General Information
Property type
Residential Multi Family
Property subtype
Duplex
Zoning description
0100
Bedrooms
6
Full bathrooms
6
Rooms
Bathroom 6, Bedroom 4, Bedroom 6, Bathroom 2, Bathroom 1, Bathroom 4, Bedroom 1, Bedroom 5, Bedroom 2, Bathroom 3, Bedroom 3, Bathroom 5
Subdivision
BISC GARDENS SEC F PT 1
Lot features
<1 Acre, Flood Zone
Standard status
Active
APN
30-21-23-022-0030
Lot size
0.59 Acres
Taxes and HOA fees
Tax Year
2025
Tax Description
14-23 52 41 .59 AC BISCAYNE GARDENS SEC F PT 1 LOT 5 PB 44-46 LOT SIZE 100 X 258 OR 21767-3149 10 2003 1 COC 23216-1067 03 2005 4
Tax Annual Amount
9634
Legal Description
14-23 52 41 .59 AC BISCAYNE GARDENS SEC F PT 1 LOT 5 PB 44-46 LOT SIZE 100 X 258 OR 21767-3149 10 2003 1 COC 23216-1067 03 2005 4
Utilities
Sewer type
Septic Tank
Cooling system
Zoned, Electric
Water front features
Canal Access
Water front
1
Building Details
Year built
1951
Floors in Building
1
Flooring type
Tile - Ceramic
Building materials
CBSConcreteBlockStructure, Block
Roof type
Shingle
Listing Agency:
Florida Homegain, Corp
(786) 290-4793
Listed By:
Magda Robles · License #0630346
(954) 343-4444
Added: Aug 28
Changed: Oct 10
Last Checked: Oct 13 at 7:06AM
MLS# A12079196
Copyright © 2026 Miami REALTORS®. All rights reserved. All information provided by the listing agent/broker is deemed reliable but is not guaranteed and should be independently verified.
Investment Insights
Based on property information with market context.
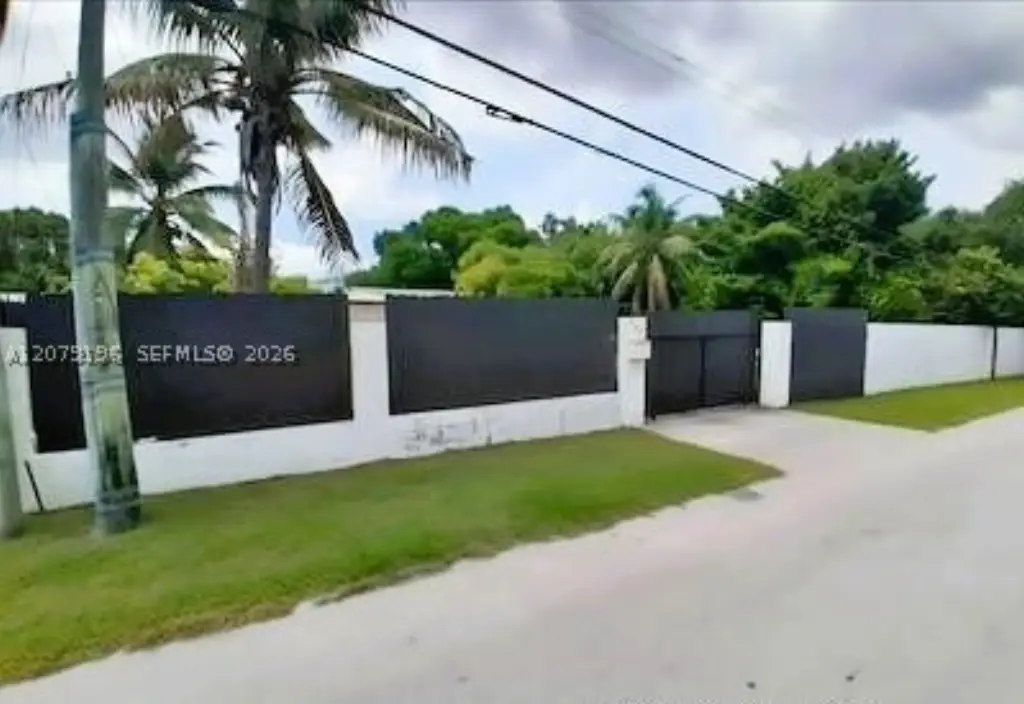
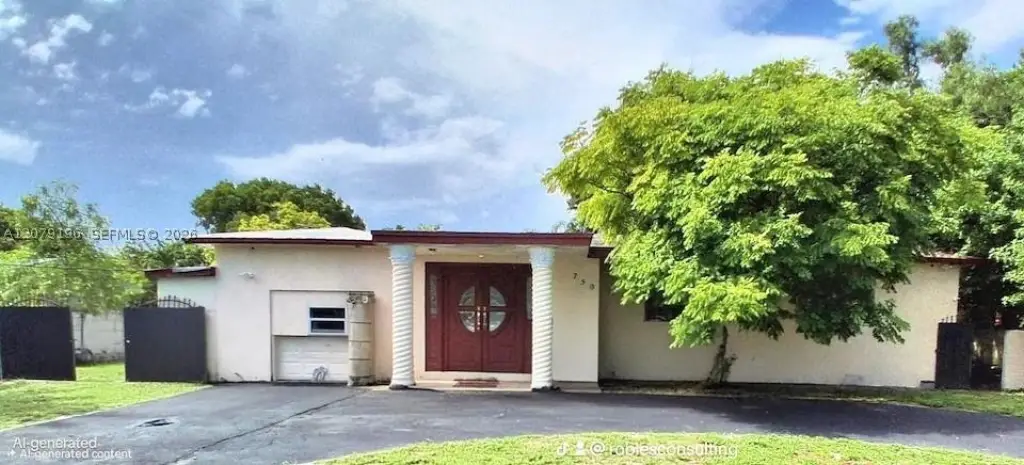
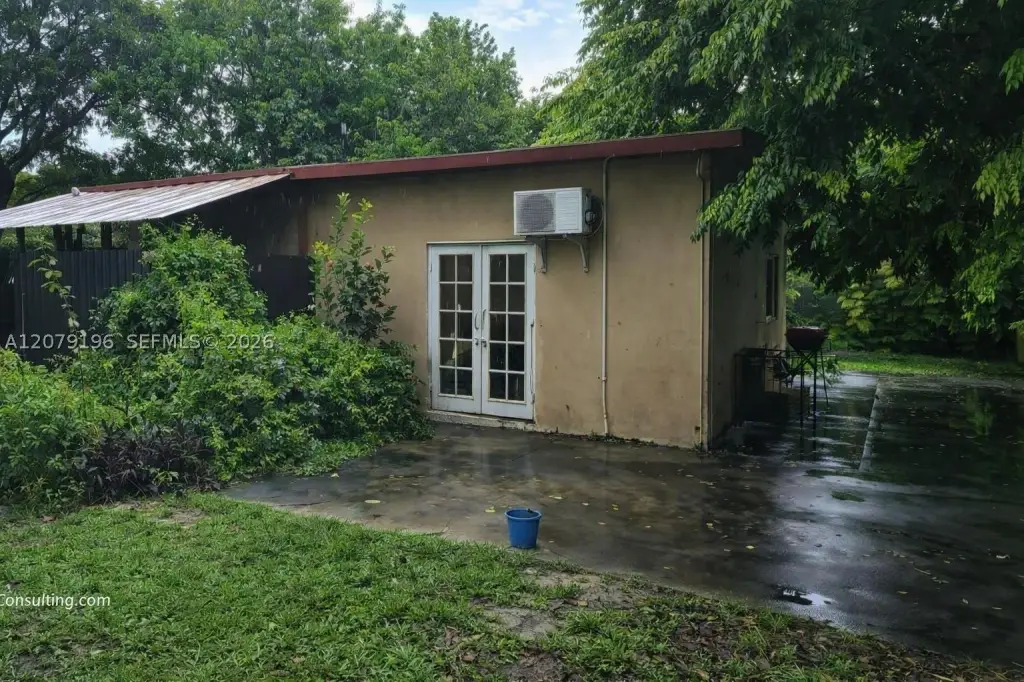
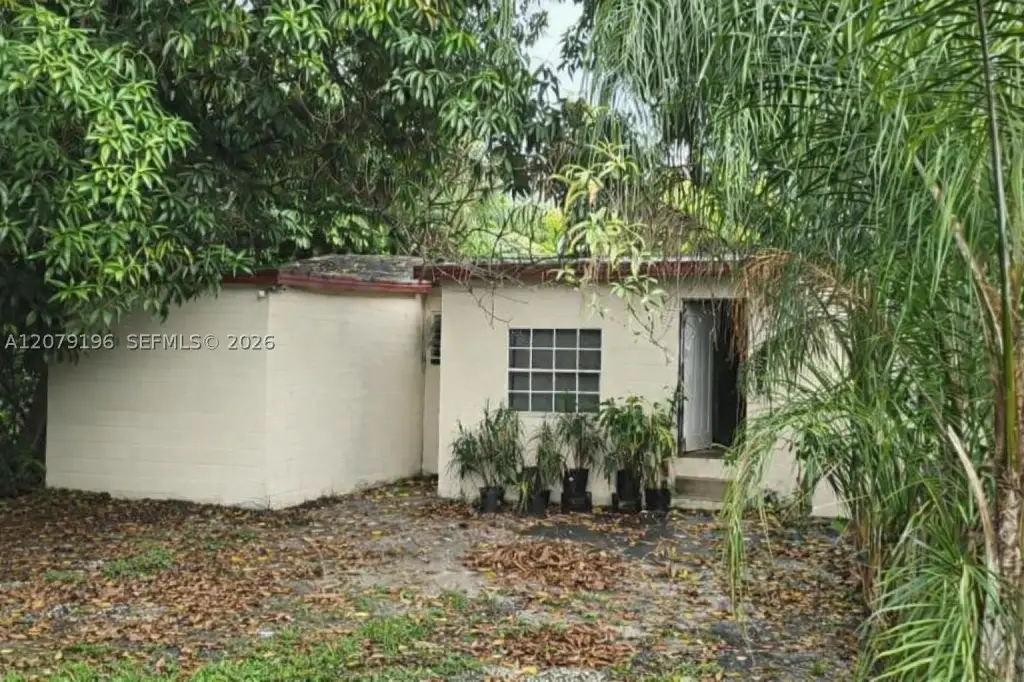
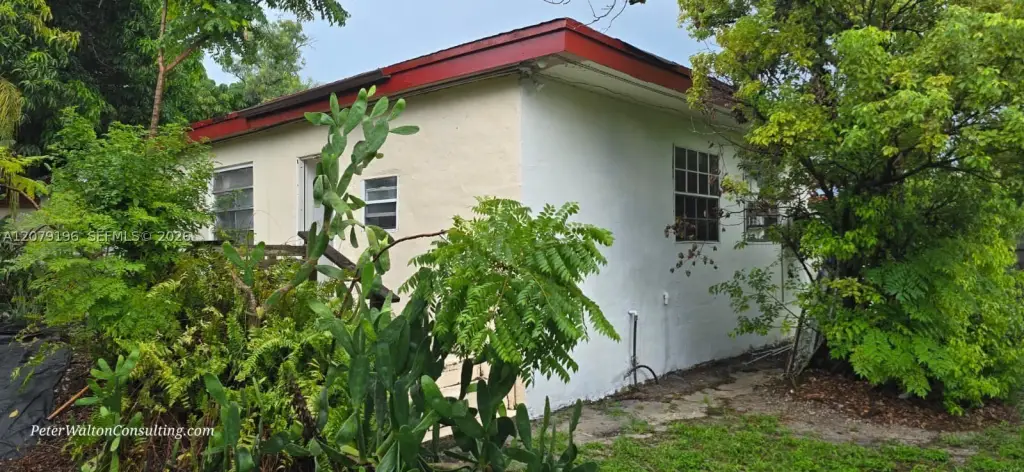
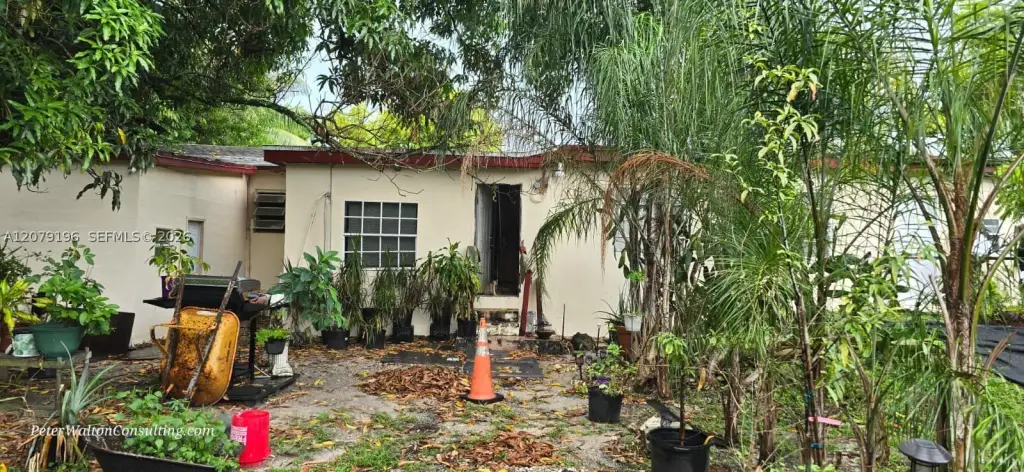
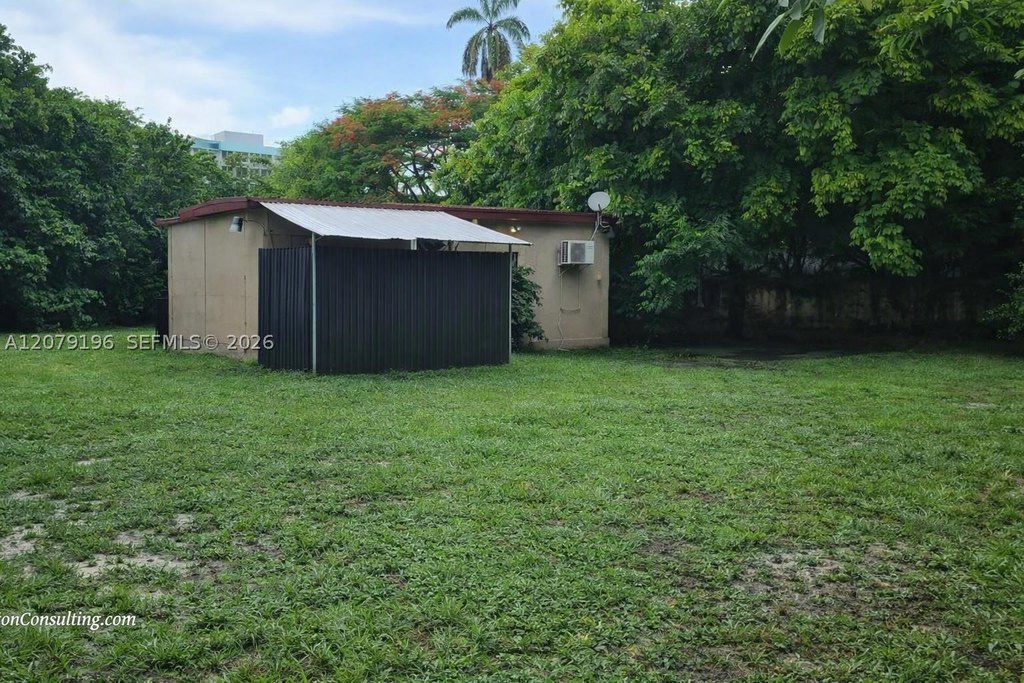
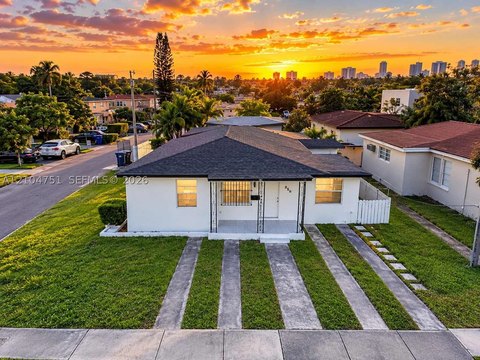
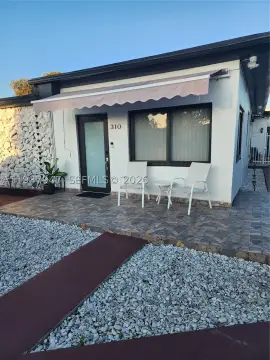
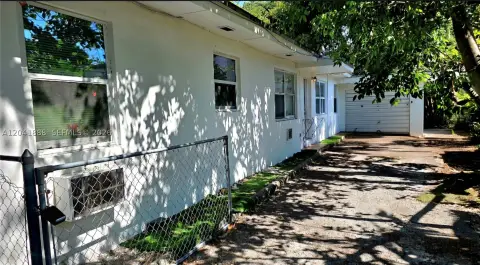
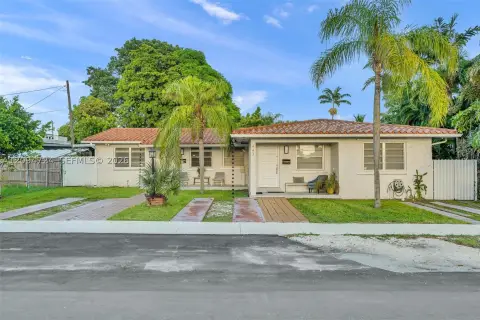
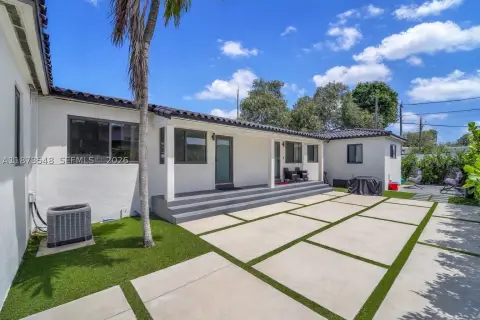
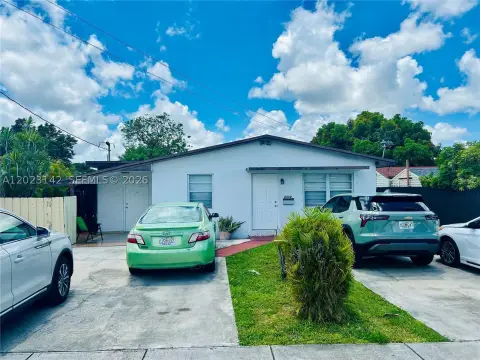
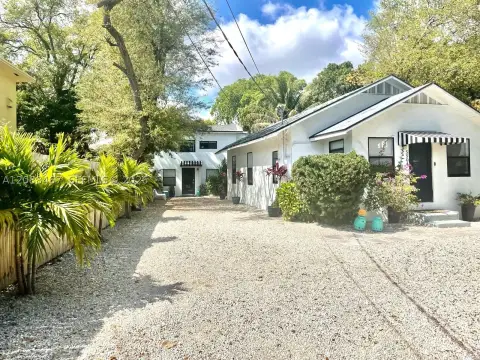
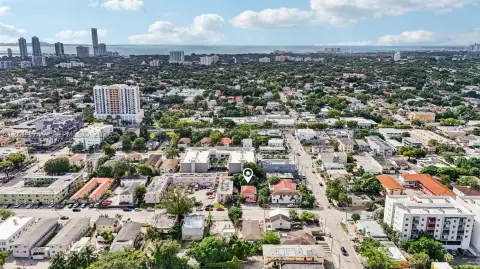
This 1951 property occupies a 0.59-acre lot and includes a four-bedroom main house, a duplex with one bedroom and one bathroom on each side, and separate in-law quarters in a guest house. Across the living spaces, the property has 7+ bedrooms and 7 bathrooms. The main house has central A/C; the other units have split A/C. Water service is from a well, and the property has three septic tanks. A circular driveway, gated and walled perimeter, and space for boat parking are also present.
The lot borders the freshwater Biscayne Canal, with access suited to small, shallow-draft watercraft. Hard Rock Stadium is a five-minute drive away; South Florida beaches are 15 minutes away, and the airport is 20 minutes away.
The property is offered as-is, and the seller will not resolve municipal liens, violations, or open permits. Buyer due diligence is required, including independent review of liens, permits, and zoning.
The lot borders the freshwater Biscayne Canal, with access suited to small, shallow-draft watercraft. Hard Rock Stadium is a five-minute drive away; South Florida beaches are 15 minutes away, and the airport is 20 minutes away.
The property is offered as-is, and the seller will not resolve municipal liens, violations, or open permits. Buyer due diligence is required, including independent review of liens, permits, and zoning.
Key Highlights
- 0.59‑acre lot with frontage on the freshwater Biscayne Canal
- Main house with 4 bedrooms, duplex units with 1 bedroom and 1 bathroom each, plus a separate guest house
- 7+ bedrooms and 7 bathrooms across the living spaces
Property Analytics
Unlock full access to Insights
Subscribe to Realmo Intelligence
Open Analytics
Current Use
Lease Details
Yes
Utilities to site
Location Intelligence
Trade Area within ½ mile
916
Businesses Nearby
Explore this area
Business Placement
Demographics for 33169, FL
42,308
Population
14,815
Households
2.9
Avg Household Size
37
Median Age
22%
College-Educated
85%
High-School Grad
6.8 sq mi
ZIP Area
6,222
Density / Sq Mi
$59,686
Median Household Income
$34,327
Median Earnings
$1,536
Median Rent
$352,800
Median Home Value
Check the figures for this property
Cap Rate, Value Estimation, Potential NOI and more
View Realmo Analytics
Market
Vacancy Rate% for Multifamily in South region

Questions? Ask Rey
Realmo’s AI knows this listing — price, zoning, demand, history. Ask anything.


Frequently Asked Questions
What type of property is this?
Duplex - Multiple living spaces include a main residence, two duplex units, and a detached guest house.
Where is this duplex located?
The property is located at 759 S Biscayne River Dr Miami, FL.
What is the asking price?
The asking price for this property is $899,000.
What are key features of this property?
This property features: 0.59‑acre lot with frontage on the freshwater Biscayne Canal; Main house with 4 bedrooms, duplex units with 1 bedroom and 1 bathroom each, plus a separate guest house; 7+ bedrooms and 7 bathrooms across the living spaces