Downtown Mixed-Use Buildings
For Sale
$2,250,000
74 Carroll St, Binghamton, NY 13901
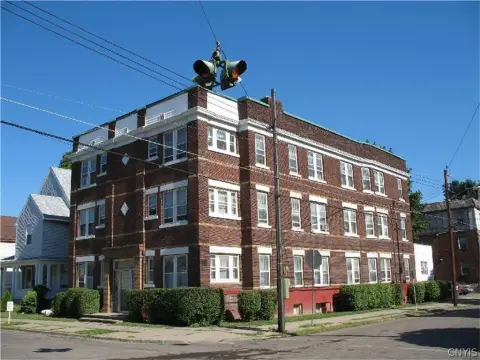
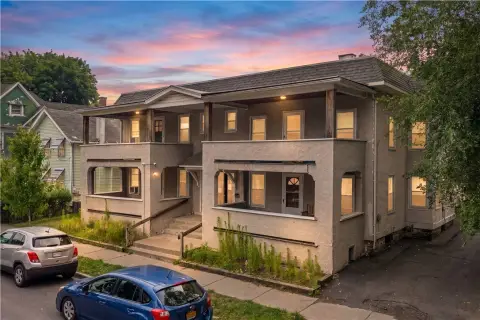
Three strategically located mixed-use buildings combining street-level retail and student-focused residential units downtown.
Property Size13,020 SF
Days on Market124
Property Features for 74 Carroll St
General Information
Standard status
Active
Size
13,020 SF
Property subtype
Multifamily
Building Details
Building Size
13,020 SF
Year Built
1970
Listed By:
Scott Warren, CCIM, CIREC · License #NY #10491212432
(607) 621-0439
Source:
Svn
Added: Jun 23
Changed: Oct 10
Last Checked: Oct 23 at 5:52AM
Displayed information is deemed reliable but is not guaranteed and should be independently verified. All listing content including descriptions, pricing, images are the copyrighted material of Scott Warren, CCIM, CIREC

Ask AI about this property
Review the available facts, identify missing information and prepare questions for the agent.
Investment Insights
Based on property information with market context.
This offering includes three mixed-use buildings in Downtown Binghamton, pairing ground-floor commercial space with residential housing above. 74 Carroll Street is a 13,020 SF property with five residential units totaling 25 student beds above commercial space. The residential units feature multiple bathrooms, loft-style configurations, updated finishes, and secure coded access at both the building and unit levels. A recently executed commercial lease supports additional commercial income, and off-street parking is included, along with a larger parcel size than typically found downtown.
29 and 31 Court Street are positioned along prominent downtown blocks just steps from Water Street, surrounded by approximately 1,300 student beds. Each property features ground-floor retail with student housing above. The location is described as highly walkable, with nearby restaurants, coffee shops, nightlife, daily amenities, and convenient access to university transportation routes and public transportation.
For tenants and operators, the portfolio offers a diversified structure with street-level retail and student-focused residential units across three buildings. With secure building access and updated unit finishes at 74 Carroll Street, the residential component is designed for shared occupancy living. The mix of commercial tenancy and residential income within a connected downtown setting may appeal to buyers seeking multiple income streams in a single package.
29 and 31 Court Street are positioned along prominent downtown blocks just steps from Water Street, surrounded by approximately 1,300 student beds. Each property features ground-floor retail with student housing above. The location is described as highly walkable, with nearby restaurants, coffee shops, nightlife, daily amenities, and convenient access to university transportation routes and public transportation.
For tenants and operators, the portfolio offers a diversified structure with street-level retail and student-focused residential units across three buildings. With secure building access and updated unit finishes at 74 Carroll Street, the residential component is designed for shared occupancy living. The mix of commercial tenancy and residential income within a connected downtown setting may appeal to buyers seeking multiple income streams in a single package.
Key Highlights
- Three mixed‑use buildings in Downtown Binghamton with street‑level commercial and student‑focused residential units
- 74 Carroll Street: 13,020 SF mixed‑use property with 5 residential units totaling 25 student beds above commercial space
- 74 Carroll Street includes updated finishes and secure coded access at the building and unit levels
Financial Insights
Estimated NOI and Cap Rate
NOI / Yr
$130,968
Cap Rate
5.82%
Suggested Prices Based on Cap Rates
Cap Rate 5%
$2,619,360
$2.6M
Cap Rate 7%
$1,870,971
$1.9M
Cap Rate 9%
$1,455,200
$1.5M
Market Conditions
NOI Build-Up for 13,020 SF
Gross rent
$195.3K $15.00/SF
− Vacancy
−$8.2K −$0.63/SF
EGI
$187.1K $14.37/SF
− OpEx
−$56.1K −$4.31/SF
NOI
$131.0K $10.06/SF
Area
Broome County, NY
Vacancy
4.20%
Lease Rate
$15.00 /SF/Yr
Expense Ratio
30.00%
Simulate Cap Rate and NOI
Suggested Prices Based on Cap Rates
Cap Rate 5%
$2,619,360
Cap Rate 7%
$1,870,971
Cap Rate 9%
$1,455,200
Alternative Uses
Best Use
Retail
$1.87M
$1.64M – $2.18M
NOI $130,968 @ 7.0% cap · market cap 5.82%
Second Best
Apartment 5plus
$1.55M
$1.36M – $1.81M
NOI $108,468 @ 7.0% cap · market cap 4.82%
Theoretical Best
Office A
$3.23M
$2.83M – $3.77M
NOI $226,111 @ 7.0% cap · market cap 10.05%
Zoning and permitted uses should be independently verified with authorities.
How Realmo checks its estimates
Property Analytics
Contact the owner directly
Get the owner's phone numbers and email
Open Analytics
Current Use
Location Intelligence
Trade Area within ½ mile
2,001
Businesses Nearby
Explore this area
Business Placement
Demographics for 13901, NY
20,548
Population
10,148
Households
2
Avg Household Size
40
Median Age
26%
College-Educated
87%
High-School Grad
23.0 sq mi
ZIP Area
893
Density / Sq Mi
$54,165
Median Household Income
$36,897
Median Earnings
$806
Median Rent
$152,800
Median Home Value
Check the figures for this property
Cap Rate, Value Estimation, Potential NOI and more
View Realmo Analytics
Market
Vacancy Rate% for Multifamily in Northeast region





Frequently Asked Questions
What type of property is this?
Apartment building - Three strategically located mixed-use buildings combining street-level retail and student-focused residential units downtown.
Where is this apartment building located?
The property is located at 74 Carroll St Binghamton, NY.
What is the asking price?
The asking price for this property is $2,250,000.
What are key features of this property?
This property features: Three mixed‑use buildings in Downtown Binghamton with street‑level commercial and student‑focused residential units; 74 Carroll Street: 13,020 SF mixed‑use property with 5 residential units totaling 25 student beds above commercial space; 74 Carroll Street includes updated finishes and secure coded access at the building and unit levels