Multi-Tenant Retail
For Sale
Contact for pricing
Pending
712 West Pipeline Road, Hurst, TX 76053
Commercial-zoned shopping center with service-oriented tenants, modern construction, and access to established retail and employment concentrations.
Property Size17,780 SF
Days on Market56
Property Features for 712 West Pipeline Road
General Information
Standard status
Pending
Size
17,780 SF
Property subtype
Retail
Zoning
Commercial
Occupancy
88%
Lease Type
NNN
Net Operating Income
$278,664
Building Details
Year Built
2016
Buildings
1
Units
7
Tenancy
Multi
Listing Agency:
Marcus & Millichap - Dallas
Listed By:
Philip Levy · License #TX 522087
(972) 755-5225
Source:
Crexi
Added: Aug 26
Changed: Oct 16
Last Checked: Oct 19 at 6:32AM
Displayed information is deemed reliable but is not guaranteed and should be independently verified. All listing content including descriptions, pricing, images are the copyrighted material of Marcus & Millichap - Dallas

Ask AI about this property
Review the available facts, identify missing information and prepare questions for the agent.
Investment Insights
Based on property information with market context.
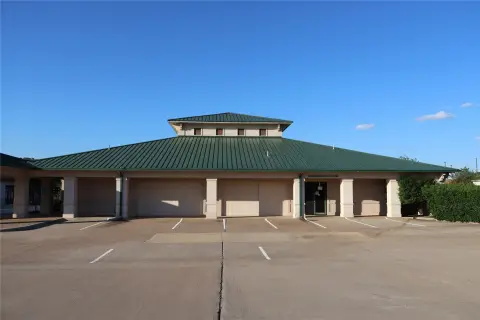
The Shops at Hurst is a 17,780-square-foot shopping center completed in 2016 and configured for multiple retail tenants. Current occupancy is 88 percent, with 54 percent of the gross leasable area leased under triple-net terms. The tenant roster includes Pizza Hut, Workout Anytime, Dr. Jin Lin Dentistry, Texas Tumble Wash, Total Wireless, and NK Beauty Bar. A metal roof design supports a lower-maintenance building profile.
Positioned at 712 West Pipeline Road in Hurst, Texas, the center is less than 1.5 miles from North East Mall, near Loop 820 and Airport Freeway (TX-183). Nearby retail includes Walmart Neighborhood Market, Dollar Tree, Advance Auto Parts, and America’s Best Contacts & Eyeglasses. DFW International Airport, American Airlines headquarters, Bell Textron, and Lockheed Martin are also identified as major employment drivers in the surrounding corridor.
Positioned at 712 West Pipeline Road in Hurst, Texas, the center is less than 1.5 miles from North East Mall, near Loop 820 and Airport Freeway (TX-183). Nearby retail includes Walmart Neighborhood Market, Dollar Tree, Advance Auto Parts, and America’s Best Contacts & Eyeglasses. DFW International Airport, American Airlines headquarters, Bell Textron, and Lockheed Martin are also identified as major employment drivers in the surrounding corridor.
Key Highlights
- 17,780‑square‑foot multi‑tenant shopping center
- 88 percent occupied; 54 percent of gross leasable area on triple‑net terms
- Built in 2016 with a metal roof design
Financial Insights
Estimated NOI and Cap Rate
NOI / Yr
$295,120
Cap Rate
6.71%
Suggested Prices Based on Cap Rates
Cap Rate 5%
$5,902,400
$5.9M
Cap Rate 7%
$4,216,000
$4.2M
Cap Rate 9%
$3,279,111
$3.3M
Market Conditions
NOI Build-Up for 17,780 SF
Gross rent
$443.8K $24.96/SF
− Vacancy
−$22.2K −$1.25/SF
EGI
$421.6K $23.71/SF
− OpEx
−$126.5K −$7.11/SF
NOI
$295.1K $16.60/SF
Area
Tarrant County, TX
Vacancy
5.00%
Lease Rate
$24.96 /SF/Yr
Expense Ratio
30.00%
Simulate Cap Rate and NOI
Suggested Prices Based on Cap Rates
Cap Rate 5%
$5,902,400
Cap Rate 7%
$4,216,000
Cap Rate 9%
$3,279,111
Alternative Uses
Best Use
Retail
$4.22M
$3.69M – $4.92M
NOI $295,120 @ 7.0% cap · market cap 6.71%
Second Best
—
—
no second resolved use
Theoretical Best
Office A
$6.25M
$5.47M – $7.30M
NOI $437,815 @ 7.0% cap · market cap 9.95%
Zoning and permitted uses should be independently verified with authorities.
How Realmo checks its estimates
Property Analytics
Unlock full access to Insights
Subscribe to Realmo Intelligence
Open Analytics
Current Use
Location Intelligence
Trade Area within ½ mile
525
Businesses Nearby
135k
Monthly Visits Nearby
Balanced
Demand for This Use
Explore this area
Business Placement
Foot Traffic Nearby
Dining 36%
Groceries 32%
Shops & Services 24%
Apparel 8%
Walmart Neighborhood Market
Groceries
43,592 visits/mo
0.0 miles
Braum's Ice Cream & Dairy Stores
Dining
23,110 visits/mo
0.4 miles
Dollar Tree
Shops & Services
21,318 visits/mo
0.1 miles
Taco Bell
Dining
13,697 visits/mo
0.0 miles
Goodwill
Apparel
10,271 visits/mo
0.3 miles
Demographics for 76053, TX
31,935
Population
12,803
Households
2.5
Avg Household Size
36
Median Age
29%
College-Educated
87%
High-School Grad
8.1 sq mi
ZIP Area
3,943
Density / Sq Mi
$62,402
Median Household Income
$39,147
Median Earnings
$1,322
Median Rent
$254,800
Median Home Value
Check the figures for this property
Cap Rate, Value Estimation, Potential NOI and more
View Realmo Analytics
Market
Vacancy Rate% for Retail in South region




Similar Off Market Nearby
- Melbourne Plaza — 900 Melbourne Rd, Hurst, TX 76053
- The Shops at Hurst — 712 W Pipeline Rd, Hurst, TX 76053
- Tello drone — hurst, tx 76053
- Sunglass Hut at Macy's — 1101 Melbourne Rd Ste 300, Hurst, TX 76053
- Northeast Plaza — 8703 W Bedford Euless Rd, Hurst, TX 76053
Frequently Asked Questions
What type of property is this?
Shopping center - Commercial-zoned shopping center with service-oriented tenants, modern construction, and access to established retail and employment concentrations.
Where is this shopping center located?
The property is located at 712 West Pipeline Road Hurst, TX.
What is the asking price?
The asking price for this property is $4,400,000.
What are key features of this property?
This property features: 17,780‑square‑foot multi‑tenant shopping center; 88 percent occupied; 54 percent of gross leasable area on triple‑net terms; Built in 2016 with a metal roof design