Multi-Building Industrial and Office
For Sale
Contact for pricing
701 TILTON RD, Danville, IL 61832
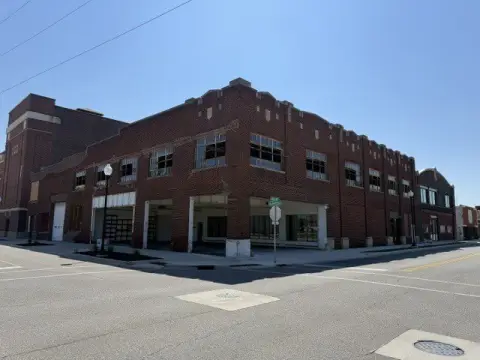
Three buildings with multiple overhead doors and office space provide flexible setup for storage, operations, or mixed use.
Property Size7,323 SF
Price / SF$66.23
Days on Market145
Property Features for 701 TILTON RD
General Information
Standard status
Active
Size
7,323 SF
Class
C
Total Parking Spaces
20
Property subtype
Industrial
Zoning
B-2 Highway Business
Additional Details
Drive-In Doors
6
Building Details
Year Built
1960
Year Renovated
2026
Buildings
3
Listing Agency:
Realty 54
Listed By:
Larry Kuchefski · License #471.008990
(217) 918-0871
Source:
Crexi
Added: May 29
Changed: Oct 9
Last Checked: Oct 19 at 7:14AM
Displayed information is deemed reliable but is not guaranteed and should be independently verified. All listing content including descriptions, pricing, images are the copyrighted material of Realty 54

Ask AI about this property
Review the available facts, identify missing information and prepare questions for the agent.
Investment Insights
Based on property information with market context.
The property consists of three well-maintained buildings designed to support business use, storage, or mixed-use configurations. The main building is a solid concrete block structure with a framed office addition and additional office space at the rear. It features two 14' x 13' overhead doors, 15-foot sidewalls, durable poured concrete flooring, and a steel roof on steel framing. Above the office area, a loft adds extra storage and space for mechanical systems, and the roof was replaced in 2026.
A second building provides additional flexible workspace with a 30' x 60' post-frame structure, steel siding and roofing, and end-ready access. It includes a service door and 16' x 10' overhead doors on both ends, supporting equipment movement or drive-through capability. The building is fully insulated with OSB-lined walls and ceiling and heated with a gas-fired hanging heater. Note that this structure has no plumbing.
A detached 48' x 36' garage rounds out the setup with two 9' x 10' overhead doors, a service door, and a fully insulated interior. This building includes forced-air heating and cooling, two water heaters, washer and dryer hookups, a deep sink, restroom, and a separate shower room, which can fit workshop needs or other support-oriented uses. Leasing is negotiable.
A second building provides additional flexible workspace with a 30' x 60' post-frame structure, steel siding and roofing, and end-ready access. It includes a service door and 16' x 10' overhead doors on both ends, supporting equipment movement or drive-through capability. The building is fully insulated with OSB-lined walls and ceiling and heated with a gas-fired hanging heater. Note that this structure has no plumbing.
A detached 48' x 36' garage rounds out the setup with two 9' x 10' overhead doors, a service door, and a fully insulated interior. This building includes forced-air heating and cooling, two water heaters, washer and dryer hookups, a deep sink, restroom, and a separate shower room, which can fit workshop needs or other support-oriented uses. Leasing is negotiable.
Key Highlights
- Three‑building setup for storage, business space, or mixed use, with office space plus multiple overhead doors across the property.
- Main concrete block building with framed office addition and rear office space; includes two 14' x 13' overhead doors, 15' sidewalls, and poured concrete flooring.
- Steel roof on the main building recently replaced in 2026; steel framing supports the roof, with a loft above office space for storage and mechanical systems.
Financial Insights
Estimated NOI and Cap Rate
NOI / Yr
$37,107
Cap Rate
7.65%
Suggested Prices Based on Cap Rates
Cap Rate 5%
$742,140
$742.1K
Cap Rate 7%
$530,100
$530.1K
Cap Rate 9%
$412,300
$412.3K
Market Conditions
NOI Build-Up for 7,323 SF
Gross rent
$58.0K $7.92/SF
− Vacancy
−$5.0K −$0.68/SF
EGI
$53.0K $7.24/SF
− OpEx
−$15.9K −$2.17/SF
NOI
$37.1K $5.07/SF
Area
Vermilion County, IL
Vacancy
8.60%
Lease Rate
$7.92 /SF/Yr
Expense Ratio
30.00%
Simulate Cap Rate and NOI
Suggested Prices Based on Cap Rates
Cap Rate 5%
$742,140
Cap Rate 7%
$530,100
Cap Rate 9%
$412,300
Alternative Uses
Best Use
Warehouse
$643.7K
$563.2K – $751.0K
NOI $45,059 @ 7.0% cap · market cap 9.29%
Second Best
Industrial
$530.1K
$463.8K – $618.5K
NOI $37,107 @ 7.0% cap · market cap 7.65%
Theoretical Best
Specialty Retail
$1.43M
$1.25M – $1.66M
NOI $99,864 @ 7.0% cap · market cap 20.59%
Zoning and permitted uses should be independently verified with authorities.
How Realmo checks its estimates
Property Analytics
Unlock full access to Insights
Subscribe to Realmo Intelligence
Open Analytics
Current Use
Lease Details
6
Drive-in doors
Location Intelligence
Trade Area within ½ mile
103
Businesses Nearby
Balanced
Demand for This Use
Explore this area
Business Placement
Demographics for 61832, IL
32,878
Population
16,390
Households
2
Avg Household Size
40
Median Age
17%
College-Educated
90%
High-School Grad
27.3 sq mi
ZIP Area
1,204
Density / Sq Mi
$45,264
Median Household Income
$37,288
Median Earnings
$805
Median Rent
$78,400
Median Home Value
Check the figures for this property
Cap Rate, Value Estimation, Potential NOI and more
View Realmo Analytics
Market
Vacancy Rate% for Industrial in Midwest region




Frequently Asked Questions
What type of property is this?
Flex space - Three buildings with multiple overhead doors and office space provide flexible setup for storage, operations, or mixed use.
Where is this flex space located?
The property is located at 701 TILTON RD Danville, IL.
What is the asking price?
The asking price for this property is $485,000.
What are key features of this property?
This property features: Three‑building setup for storage, business space, or mixed use, with office space plus multiple overhead doors across the property.; Main concrete block building with framed office addition and rear office space; includes two 14' x 13' overhead doors, 15' sidewalls, and poured concrete flooring.; Steel roof on the main building recently replaced in 2026; steel framing supports the roof, with a loft above office space for storage and mechanical systems.


