Renovated Mixed-Use Building For
For Sale
$650,000
7 Saint Andrews Blvd, Chillicothe, OH 45601
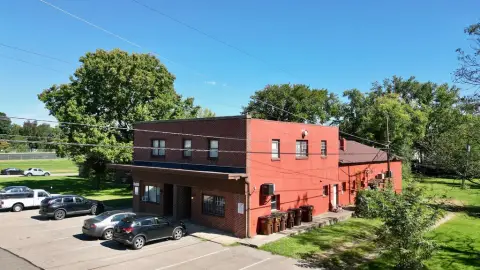
Renovated mixed-use building with high visibility and ample parking.
Property Size4,832 SF
Price / SF$134.52
Days on Market253
Property Features for 7 Saint Andrews Blvd
General Information
Standard status
Active
Size
4,832 SF
Property subtype
Retail
Building Details
Building Size
4,832 SF
Year Built
1928
Listing Agency:
NAI Ohio Equities
Listed By:
Chad Boggs · License #OH #2023003870
(614) 595-2752
Source:
Ohioequities
Added: Jan 27
Changed: Sep 10
Last Checked: Oct 5 at 5:31PM
Displayed information is deemed reliable but is not guaranteed and should be independently verified. All listing content including descriptions, pricing, images are the copyrighted material of NAI Ohio Equities
Investment Insights
Based on property information with market context.
This commercially zoned property presents a re-development opportunity for commercial and residential purposes. The 4,832 square foot fully renovated mixed-use building is located adjacent to the Chillicothe Country Club. The location offers visibility with a traffic count of approximately 20,000 vehicles per day. It is positioned in a retail area behind Chipotle and Bob Evans. The property is located on Historic US Route 50 and offers proximity to Ross County Airport, State Routes 23, 35, and 104. It features a paved parking lot and irrigation infrastructure. The property can be purchased with 1075 Western Ave, with a parcel split to occur upon closing if purchased separately.
Key Highlights
- High traffic count of 20,000 vehicles per day and strong visibility due to its LOCATION ON HISTORIC US ROUTE 50.
- 4,832 SF FULLY RENOVATED mixed‑use building suitable for commercial or residential re‑development.
- Zoned commercial, offering significant potential for various business ventures.
Financial Insights
Estimated NOI and Cap Rate
NOI / Yr
$35,848
Cap Rate
5.52%
Suggested Prices Based on Cap Rates
Cap Rate 5%
$716,960
$717.0K
Cap Rate 7%
$512,114
$512.1K
Cap Rate 9%
$398,311
$398.3K
Market Conditions
NOI Build-Up for 4,832 SF
Gross rent
$53.3K $11.04/SF
− Vacancy
−$2.1K −$0.44/SF
EGI
$51.2K $10.60/SF
− OpEx
−$15.4K −$3.18/SF
NOI
$35.8K $7.42/SF
Area
Ross County, OH
Vacancy
4.00%
Lease Rate
$11.04 /SF/Yr
Expense Ratio
30.00%
Simulate Cap Rate and NOI
Suggested Prices Based on Cap Rates
Cap Rate 5%
$716,960
Cap Rate 7%
$512,114
Cap Rate 9%
$398,311
Alternative Uses
Best Use
Retail
$512.1K
$448.1K – $597.5K
NOI $35,848 @ 7.0% cap · market cap 5.52%
Second Best
Mixed Use
$455.6K
$398.6K – $531.5K
NOI $31,891 @ 7.0% cap · market cap 4.91%
Theoretical Best
Office A
$911.8K
$797.9K – $1.06M
NOI $63,829 @ 7.0% cap · market cap 9.82%
Zoning and permitted uses should be independently verified with authorities.
Property Analytics
Unlock full access to Insights
Subscribe to Realmo Intelligence
Open Analytics
Current Use
Location Intelligence
Trade Area within ½ mile
256
Businesses Nearby
Explore this area
Business Placement
Demographics for 45601, OH
56,849
Population
23,358
Households
2.4
Avg Household Size
41
Median Age
18%
College-Educated
88%
High-School Grad
348.7 sq mi
ZIP Area
163
Density / Sq Mi
$57,430
Median Household Income
$39,973
Median Earnings
$858
Median Rent
$160,800
Median Home Value
Check the figures for this property
Cap Rate, Value Estimation, Potential NOI and more
View Realmo Analytics
Market
Vacancy Rate% for Retail in Midwest region

Questions? Ask Rey
Realmo’s AI knows this listing — price, zoning, demand, history. Ask anything.






Frequently Asked Questions
What type of property is this?
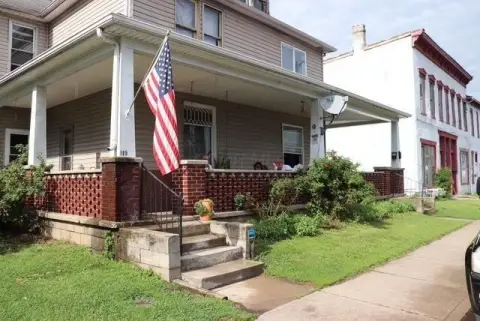
Mixed-use property - Renovated mixed-use building with high visibility and ample parking.
Where is this mixed-use property located?
The property is located at 7 Saint Andrews Blvd Chillicothe, OH.
What is the asking price?
The asking price for this property is $650,000.
What are key features of this property?
This property features: High traffic count of 20,000 vehicles per day and strong visibility due to its LOCATION ON HISTORIC US ROUTE 50.; 4,832 SF FULLY RENOVATED mixed‑use building suitable for commercial or residential re‑development.; Zoned commercial, offering significant potential for various business ventures.