Updated Triplex with Separate
For Sale
$595,000
Pending
673 N 11TH STREET, Philadelphia, PA 19123
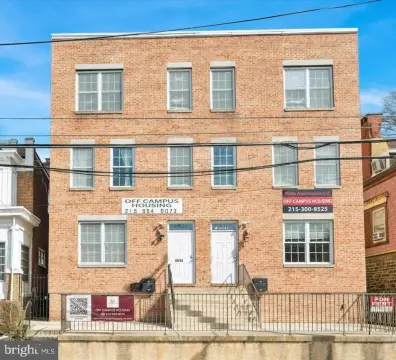
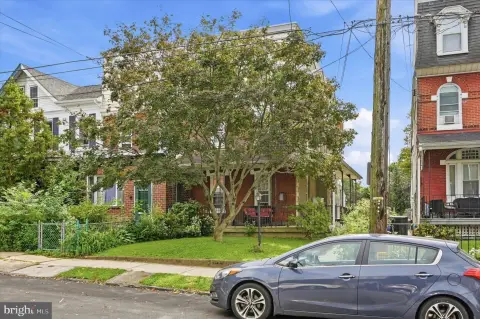
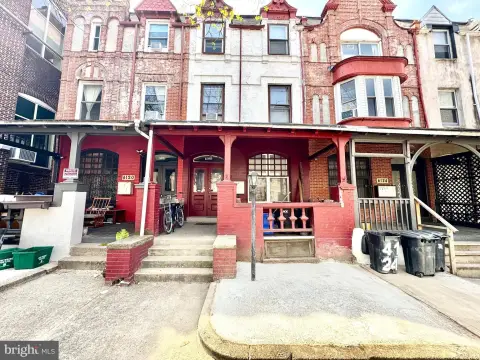
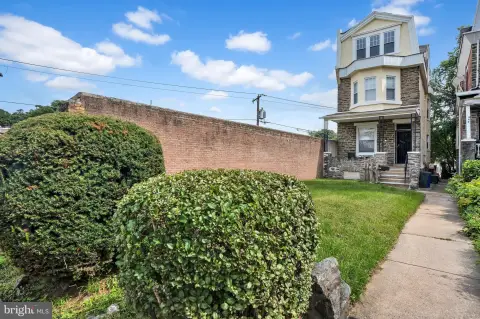
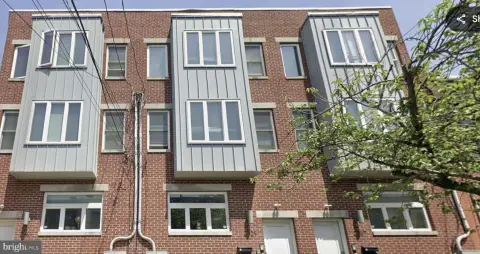
Updated triplex with three separately metered units, including two currently occupied and gas forced-air heat.
Property Size2,694 SF
Days on Market102
Property Features for 673 N 11TH STREET
General Information
Standard status
Pending
Size
2,694 SF
Property subtype
Triplex
Additional Details
Multifamily Units
3
Building Details
Year Built
1915
Listing Agency:
KW Empower
(215) 627-3500
Listed By:
Michael R. McCann · License #AB049770L
(215) 709-4141
Source:
Cummingsrealtors
Added: Jul 14
Changed: Oct 21
Last Checked: Oct 20 at 9:18PM
Displayed information is deemed reliable but is not guaranteed and should be independently verified. All listing content including descriptions, pricing, images are the copyrighted material of KW Empower

Ask AI about this property
Review the available facts, identify missing information and prepare questions for the agent.
Investment Insights
Based on property information with market context.
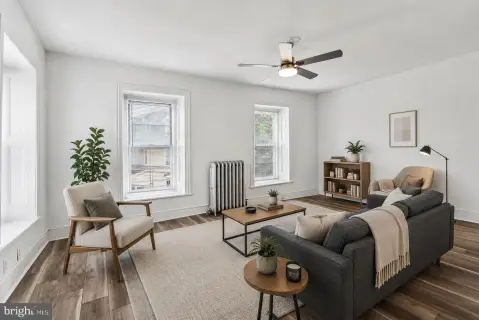
This well-maintained, updated triplex includes three separately metered units. Two units are currently occupied. Unit 1 is an oversized two-bedroom residence with a bright living room featuring soaring ceilings and a decorative fireplace mantel, an eat-in kitchen, a full bathroom, and a second bedroom at the rear, along with a bonus room that can support a variety of uses. Unit 1 provides access to an unfinished basement and a back patio. Unit 2 is an open, sunlit studio with high ceilings, crown molding, and a decorative fireplace mantel. Unit 3 is the largest, offering a bi-level layout with four bedrooms and one bathroom, including an open living room and kitchen and two bedrooms on each level.
The property is located at 673 N 11th Street in Philadelphia, with proximity to Fairmount Avenue, Broad Street, Spring Garden Street, Northern Liberties, public transit, I-676, and Center City. The surrounding area includes restaurants, cafes, entertainment, and new construction.
Utilities are provided by gas forced-air heat and individual gas water heaters for the units.
The property is located at 673 N 11th Street in Philadelphia, with proximity to Fairmount Avenue, Broad Street, Spring Garden Street, Northern Liberties, public transit, I-676, and Center City. The surrounding area includes restaurants, cafes, entertainment, and new construction.
Utilities are provided by gas forced-air heat and individual gas water heaters for the units.
Key Highlights
- Updated triplex (built 1915) with three separately metered units—two currently occupied
- Unit 1: oversized 2BR with eat‑in kitchen, full bath, bonus room, and rear access to the unfinished basement and back patio
- Unit 2: open, sunlit studio with high ceilings, crown molding, and decorative fireplace mantel
Financial Insights
Estimated NOI and Cap Rate
NOI / Yr
$45,973
Cap Rate
7.73%
Suggested Prices Based on Cap Rates
Cap Rate 5%
$919,460
$919.5K
Cap Rate 7%
$656,757
$656.8K
Cap Rate 9%
$510,811
$510.8K
Market Conditions
NOI Build-Up for 2,694 SF
Gross rent
$69.5K $25.80/SF
− Vacancy
−$3.8K −$1.42/SF
EGI
$65.7K $24.38/SF
− OpEx
−$19.7K −$7.31/SF
NOI
$46.0K $17.06/SF
Area
Philadelphia, PA
Vacancy
5.51%
Lease Rate
$25.80 /SF/Yr
Expense Ratio
30.00%
Simulate Cap Rate and NOI
Suggested Prices Based on Cap Rates
Cap Rate 5%
$919,460
Cap Rate 7%
$656,757
Cap Rate 9%
$510,811
Alternative Uses
Best Use
Multifamily LT 5
$656.8K
$574.7K – $766.2K
NOI $45,973 @ 7.0% cap · market cap 7.73%
Second Best
Apartment 5plus
$605.4K
$529.7K – $706.3K
NOI $42,375 @ 7.0% cap · market cap 7.12%
Theoretical Best
—
—
same as Best Use
Zoning and permitted uses should be independently verified with authorities.
How Realmo checks its estimates
Property Analytics
Unlock full access to Insights
Subscribe to Realmo Intelligence
Open Analytics
Lease Details
3
Residential units
Location Intelligence
Trade Area within ½ mile
4,152
Businesses Nearby
Explore this area
Business Placement
Demographics for 19123, PA
18,793
Population
10,636
Households
1.8
Avg Household Size
33
Median Age
66%
College-Educated
93%
High-School Grad
1.3 sq mi
ZIP Area
14,456
Density / Sq Mi
$95,872
Median Household Income
$73,760
Median Earnings
$1,687
Median Rent
$544,700
Median Home Value
Check the figures for this property
Cap Rate, Value Estimation, Potential NOI and more
View Realmo Analytics
Market
Vacancy Rate% for Multifamily in Northeast region



Frequently Asked Questions
What type of property is this?
Triplex - Updated triplex with three separately metered units, including two currently occupied and gas forced-air heat.
Where is this triplex located?
The property is located at 673 N 11TH STREET Philadelphia, PA.
What is the asking price?
The asking price for this property is $595,000.
What are key features of this property?
This property features: Updated triplex (built 1915) with three separately metered units—two currently occupied; Unit 1: oversized 2BR with eat‑in kitchen, full bath, bonus room, and rear access to the unfinished basement and back patio; Unit 2: open, sunlit studio with high ceilings, crown molding, and decorative fireplace mantel


