Historic Five-Story Office
For Sale
$2,200,000
251 S Camac St, Philadelphia, PA 19107
Flexible multi-level space with original architectural details and a documented history of office and restaurant use.
Property Size5,542 SF
Price / SF$396.97
Days on Market79
Property Features for 251 S Camac St
General Information
Standard status
Active
Size
5,542 SF
Building Details
Year Built
1825
Listing Agency:
Ehret Realty Inc
Listed By:
Emily M Stout · License #RM420868
(610) 656-5065
Source:
Riverfoxrealty
Added: Jul 30
Changed: Oct 3
Last Checked: Oct 15 at 12:40AM
Displayed information is deemed reliable but is not guaranteed and should be independently verified. All listing content including descriptions, pricing, images are the copyrighted material of Ehret Realty Inc

Ask AI about this property
Review the available facts, identify missing information and prepare questions for the agent.
Investment Insights
Based on property information with market context.
Built in 1825, this five-story historic property contains 5,542 SF and retains original architectural elements across its multi-level layout. The building previously housed the Philadelphia District Attorney’s Office and was later used as a restaurant, providing a documented commercial history beyond its current office classification. The basement is believed to have connections to the Underground Railroad.
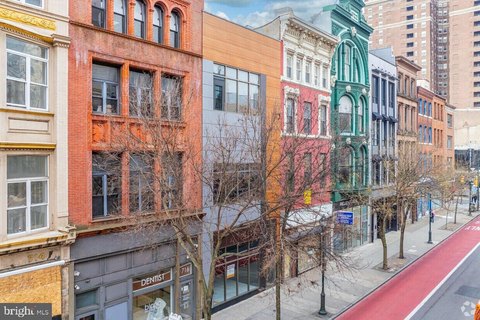
Located at 251 S Camac Street in Philadelphia’s Washington Square West, the property sits on a wooden-block street near Spruce and Locust Streets. The surrounding setting includes the Plastic Club, Sketch Club, and Franklin Inn Club, with City Hall, Broad Street, and Jefferson Hospital also identified nearby. The flexible configuration is presented as suitable for office, gallery, restaurant, or coworking use.
Located at 251 S Camac Street in Philadelphia’s Washington Square West, the property sits on a wooden-block street near Spruce and Locust Streets. The surrounding setting includes the Plastic Club, Sketch Club, and Franklin Inn Club, with City Hall, Broad Street, and Jefferson Hospital also identified nearby. The flexible configuration is presented as suitable for office, gallery, restaurant, or coworking use.
Key Highlights
- 5,542 SF historic building constructed in 1825
- Five‑story layout with original architectural details
- Former Philadelphia District Attorney’s Office location
Financial Insights
Estimated NOI and Cap Rate
NOI / Yr
$72,930
Cap Rate
3.32%
Suggested Prices Based on Cap Rates
Cap Rate 5%
$1,458,600
$1.5M
Cap Rate 7%
$1,041,857
$1.0M
Cap Rate 9%
$810,333
$810.3K
Market Conditions
NOI Build-Up for 5,542 SF
Gross rent
$121.7K $21.96/SF
− Vacancy
−$24.5K −$4.41/SF
EGI
$97.2K $17.55/SF
− OpEx
−$24.3K −$4.39/SF
NOI
$72.9K $13.16/SF
Area
Philadelphia, PA
Vacancy
20.10%
Lease Rate
$21.96 /SF/Yr
Expense Ratio
25.00%
Simulate Cap Rate and NOI
Suggested Prices Based on Cap Rates
Cap Rate 5%
$1,458,600
Cap Rate 7%
$1,041,857
Cap Rate 9%
$810,333
Alternative Uses
Best Use
Office B
$1.04M
$911.6K – $1.22M
NOI $72,930 @ 7.0% cap · market cap 3.32%
Second Best
—
—
no second resolved use
Theoretical Best
Multifamily LT 5
$1.35M
$1.18M – $1.58M
NOI $94,574 @ 7.0% cap · market cap 4.30%
Zoning and permitted uses should be independently verified with authorities.
How Realmo checks its estimates
Property Analytics
Unlock full access to Insights
Subscribe to Realmo Intelligence
Open Analytics
Current Use
Location Intelligence
Trade Area within ½ mile
26,359
Businesses Nearby
Explore this area
Business Placement
Demographics for 19107, PA
17,600
Population
10,239
Households
1.7
Avg Household Size
32
Median Age
72%
College-Educated
92%
High-School Grad
0.5 sq mi
ZIP Area
35,200
Density / Sq Mi
$70,382
Median Household Income
$57,694
Median Earnings
$1,691
Median Rent
$452,500
Median Home Value
Check the figures for this property
Cap Rate, Value Estimation, Potential NOI and more
View Realmo Analytics
Market
Vacancy Rate% for Office in Philadelphia, PA





Frequently Asked Questions
What type of property is this?
Office building - Flexible multi-level space with original architectural details and a documented history of office and restaurant use.
Where is this office building located?
The property is located at 251 S Camac St Philadelphia, PA.
What is the asking price?
The asking price for this property is $2,200,000.
What are key features of this property?
This property features: 5,542 SF historic building constructed in 1825; Five‑story layout with original architectural details; Former Philadelphia District Attorney’s Office location


